Texas Service Sector Expands Strongly in July

Texas Service Sector Outlook Survey
Texas Service Sector Expands Strongly in July
For this month’s survey, Texas business executives were asked supplemental questions on revenue, the labor market, wages and prices. Results for these questions from the Texas Manufacturing Outlook Survey, Texas Service Sector Outlook Survey and Texas Retail Outlook Survey have been released together. Read the special questions results.
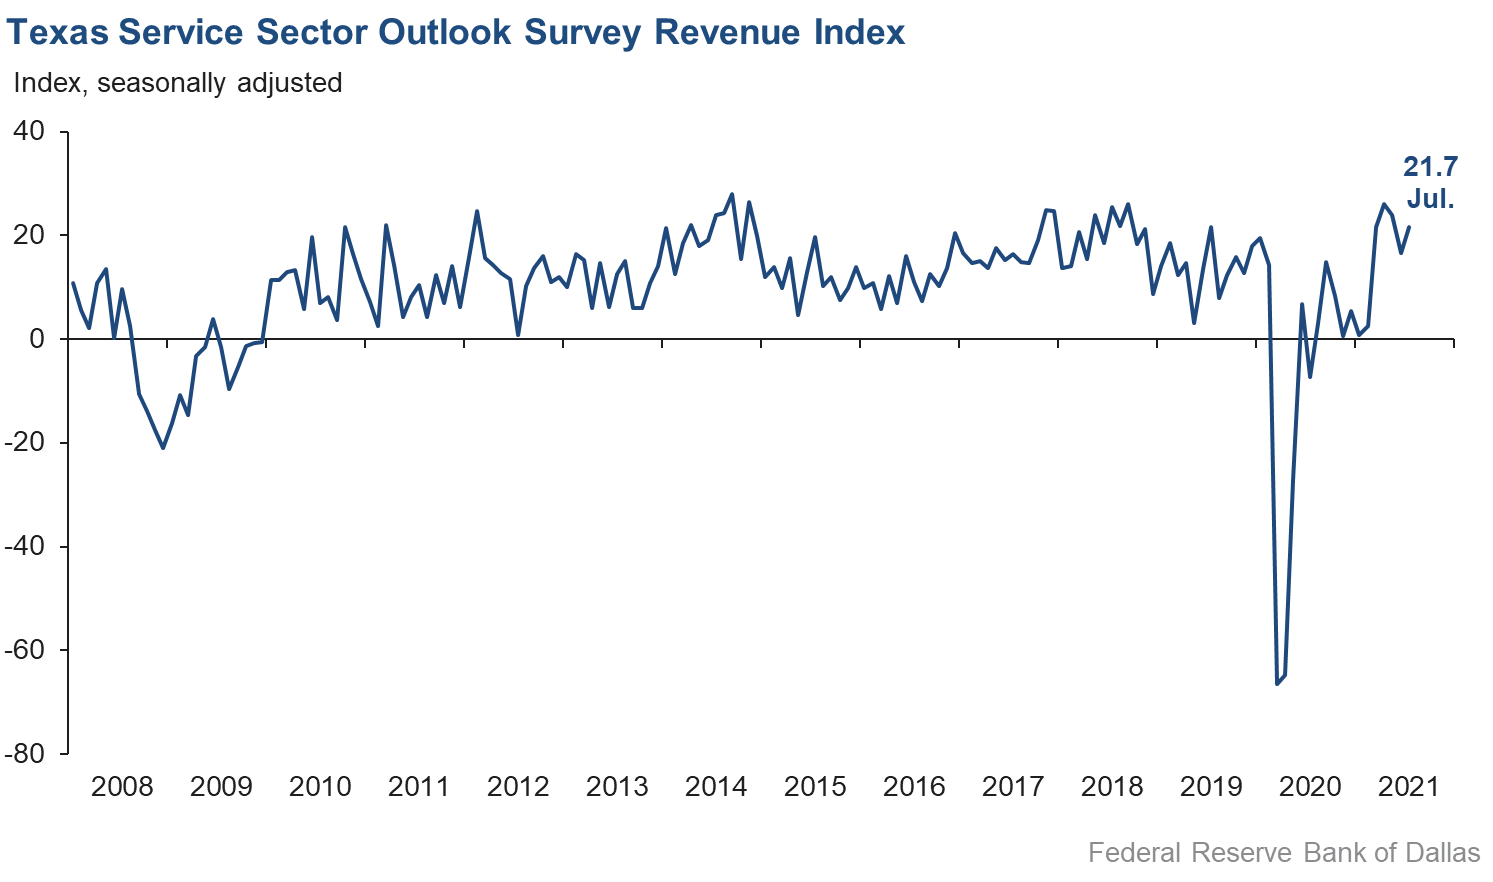
The pace of growth in the Texas service sector accelerated in July, according to business executives responding to the Texas Service Sector Outlook Survey. The revenue index, a key measure of state service sector conditions, increased from 16.7 in June to 21.7 in July.
Labor market indicators continued to point to improvements in July, with further growth in employment and hours worked. The employment index rose from 11.1 to 13.5, and the part-time employment index added nearly three points to rise to 8.3. The hours worked index slipped slightly from 10.8 to 8.5 but stayed well above its series average of 2.4.
Perceptions of broader business conditions remained elevated in July. The general business activity index slipped three points to 33.3, with nearly 40 percent of respondents noting improvement compared with June. The company outlook index increased from 21.7 to 25.0, while the capital expenditures index rose to 20.7—its highest level since 2018. The outlook uncertainty index increased from 1.5 to 6.6.
Price and wage pressures eased somewhat in July, though they remain near record levels. The wages and benefits index declined from a record high of 31.4 to 27.2. The selling prices index declined from 28.6 to 24.4, while the input prices index slipped three points to 42.0.
Respondents’ expectations regarding future business activity remained high, though optimism moderated slightly. The future general business activity index fell from 43.0 to 37.5, while the future revenue index inched down from 54.5 to 52.1. Other future service sector activity indexes such as employment and capital expenditures increased slightly, suggesting that respondents expect robust growth going forward.

Texas Retail Outlook Survey
Texas Retail Sales Flatten After Two Months of Decline
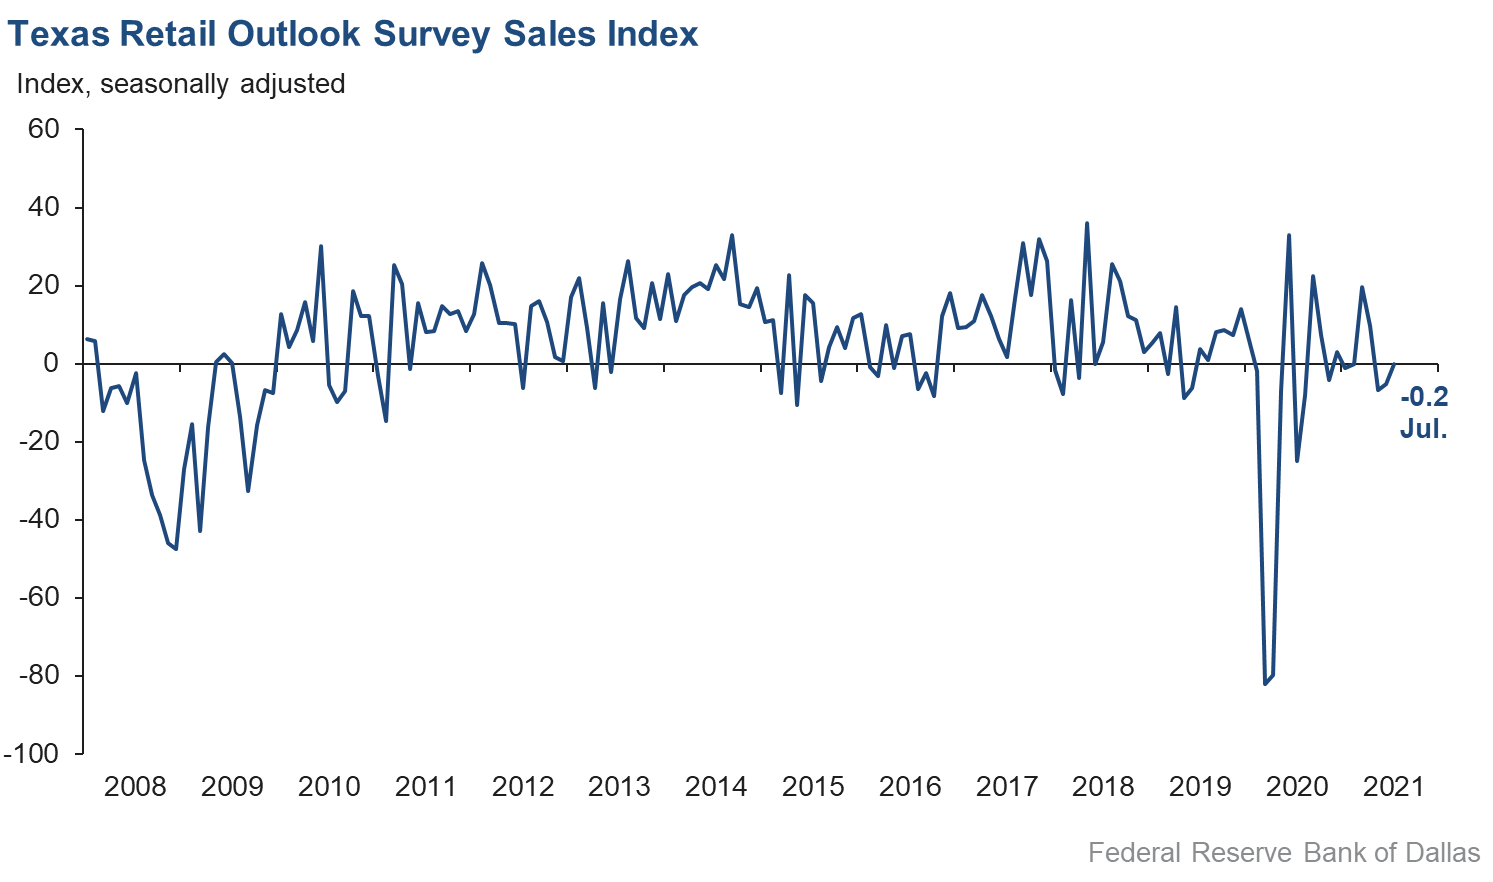
Retail sales activity was roughly unchanged in July compared with June, according to business executives responding to the Texas Retail Outlook Survey. The sales index, a key measure of state retail activity, improved from -5.3 in June to -0.2 in July, suggesting no net change in sales. Inventories remained under pressure, though the inventories index’s rise from -17.1 to -6.4 suggests some easing in recent declines.
Retail labor market indicators remained weak in July, with employment holding flat and a further shortening of average workweek length. The employment index dipped from 0.9 to -0.7, suggesting little net change in hiring compared with June. The hours worked index improved but remained in negative territory at -2.6.
Retailers’ perceptions of broader business conditions continued to be positive on net, though index movements were mixed. The general business activity index plunged 15 points to 15.8, its lowest reading since Winter Storm Uri in February. The company outlook index picked up over six points to 11.8, while the outlook uncertainty index added six points to rise to 14.9.
Retail price and wage pressures eased notably from last month’s record-high levels. The selling prices index shed over 14 points to 42.9, though over half of firms still report increasing prices compared with June. The input prices index declined from 59.2 to 51.8, while the wages and benefits index declined from 20.2 to 15.8.
Retailer optimism moderated somewhat in July when looking ahead to the rest of the year. The future general business activity index fell from 37.8 to 24.1, while the future sales index slipped slightly from 61.2 to 58.9. However, other indexes of future retail activity such as employment picked up slightly and suggest that expectations remain high for strong growth in the coming months.
The Texas Retail Outlook Survey is a component of the Texas Service Sector Outlook Survey that uses information only from respondents in the retail and wholesale sectors.
Next release: August 31, 2021
Data were collected July 13–21, and 277 Texas service sector business executives, of which 49 were retailers, responded to the survey. The Dallas Fed conducts the Texas Service Sector Outlook Survey monthly to obtain a timely assessment of the state’s service sector activity. Firms are asked whether revenue, employment, prices, general business activity and other indicators increased, decreased or remained unchanged over the previous month.
Survey responses are used to calculate an index for each indicator. Each index is calculated by subtracting the percentage of respondents reporting a decrease from the percentage reporting an increase. When the share of firms reporting an increase exceeds the share reporting a decrease, the index will be greater than zero, suggesting the indicator has increased over the prior month. If the share of firms reporting a decrease exceeds the share reporting an increase, the index will be below zero, suggesting the indicator has decreased over the prior month. An index will be zero when the number of firms reporting an increase is equal to the number of firms reporting a decrease. Data have been seasonally adjusted as necessary.
Texas Service Sector Outlook Survey
Historical data are available from January 2007 to the most current release month.
| Business Indicators Relating to Facilities and Products in Texas Current (versus previous month) | ||||||||
| Indicator | Jul Index | Jun Index | Change | Series Average | Trend* | % Reporting Increase | % Reporting No Change | % Reporting Decrease |
Revenue | 21.7 | 16.7 | +5.0 | 11.0 | 12(+) | 36.8 | 48.1 | 15.1 |
Employment | 13.5 | 11.1 | +2.4 | 6.1 | 12(+) | 21.5 | 70.5 | 8.0 |
Part–Time Employment | 8.3 | 5.4 | +2.9 | 1.3 | 8(+) | 11.2 | 85.9 | 2.9 |
Hours Worked | 8.5 | 10.8 | –2.3 | 2.4 | 11(+) | 13.0 | 82.5 | 4.5 |
Wages and Benefits | 27.2 | 31.4 | –4.2 | 14.1 | 14(+) | 30.1 | 67.0 | 2.9 |
Input Prices | 42.0 | 44.9 | –2.9 | 25.2 | 15(+) | 44.5 | 53.0 | 2.5 |
Selling Prices | 24.4 | 28.6 | –4.2 | 5.5 | 12(+) | 29.8 | 64.8 | 5.4 |
Capital Expenditures | 20.7 | 15.3 | +5.4 | 9.7 | 11(+) | 21.9 | 76.9 | 1.2 |
| General Business Conditions Current (versus previous month) | ||||||||
| Indicator | Jul Index | Jun Index | Change | Series Average | Trend** | % Reporting Improved | % Reporting No Change | % Reporting Worsened |
Company Outlook | 25.0 | 21.7 | +3.3 | 5.4 | 12(+) | 30.8 | 63.4 | 5.8 |
General Business Activity | 33.3 | 36.2 | –2.9 | 3.6 | 6(+) | 38.4 | 56.5 | 5.1 |
| Indicator | Jul Index | Jun Index | Change | Series Average | Trend* | % Reporting Increase | % Reporting No Change | % Reporting Decrease |
Outlook Uncertainty† | 6.6 | 1.5 | +5.1 | 10.5 | 2(+) | 19.7 | 67.2 | 13.1 |
| Business Indicators Relating to Facilities and Products in Texas Future (six months ahead) | ||||||||
| Indicator | Jul Index | Jun Index | Change | Series Average | Trend* | % Reporting Increase | % Reporting No Change | % Reporting Decrease |
Revenue | 52.1 | 54.5 | –2.4 | 37.3 | 15(+) | 58.8 | 34.5 | 6.7 |
Employment | 41.9 | 37.8 | +4.1 | 22.1 | 15(+) | 46.2 | 49.4 | 4.3 |
Part–Time Employment | 16.7 | 18.4 | –1.7 | 6.6 | 14(+) | 19.8 | 77.1 | 3.1 |
Hours Worked | 14.9 | 14.9 | 0.0 | 5.7 | 15(+) | 17.1 | 80.7 | 2.2 |
Wages and Benefits | 52.7 | 49.1 | +3.6 | 36.0 | 15(+) | 54.0 | 44.7 | 1.3 |
Input Prices | 51.6 | 51.7 | –0.1 | 43.4 | 175(+) | 55.6 | 40.5 | 4.0 |
Selling Prices | 37.4 | 39.3 | –1.9 | 23.0 | 15(+) | 42.0 | 53.4 | 4.6 |
Capital Expenditures | 32.0 | 29.2 | +2.8 | 23.2 | 14(+) | 36.0 | 60.0 | 4.0 |
| General Business Conditions Future (six months ahead) | ||||||||
| Indicator | Jul Index | Jun Index | Change | Series Average | Trend** | % Reporting Improved | % Reporting No Change | % Reporting Worsened |
Company Outlook | 31.3 | 36.0 | –4.7 | 16.8 | 12(+) | 38.7 | 53.9 | 7.4 |
General Business Activity | 37.5 | 43.0 | –5.5 | 13.9 | 12(+) | 42.3 | 52.9 | 4.8 |
Historical data are available from January 2007 to the most current release month.
| Business Indicators Relating to Facilities and Products in Texas Retail (versus previous month) | ||||||||
| Indicator | Jul Index | Jun Index | Change | Series Average | Trend* | % Reporting Increase | % Reporting No Change | % Reporting Decrease |
| Retail Activity in Texas | ||||||||
Sales | –0.2 | –5.3 | +5.1 | 5.5 | 3(–) | 30.5 | 38.9 | 30.7 |
Employment | –0.7 | 0.9 | –1.6 | 1.8 | 1(–) | 14.7 | 69.9 | 15.4 |
Part–Time Employment | 8.0 | 1.1 | +6.9 | –1.9 | 5(+) | 13.1 | 81.8 | 5.1 |
Hours Worked | –2.6 | –6.7 | +4.1 | –2.1 | 2(–) | 10.2 | 77.0 | 12.8 |
Wages and Benefits | 15.8 | 20.2 | –4.4 | 9.3 | 12(+) | 24.7 | 66.4 | 8.9 |
Input Prices | 51.8 | 59.2 | –7.4 | 19.9 | 15(+) | 57.6 | 36.6 | 5.8 |
Selling Prices | 42.9 | 57.4 | –14.5 | 11.4 | 14(+) | 52.2 | 38.5 | 9.3 |
Capital Expenditures | 23.8 | 20.8 | +3.0 | 7.7 | 6(+) | 25.3 | 73.2 | 1.5 |
Inventories | –6.4 | –17.1 | +10.7 | 2.0 | 5(–) | 21.2 | 51.2 | 27.6 |
| Companywide Retail Activity | ||||||||
Companywide Sales | 5.1 | 5.3 | –0.2 | 7.0 | 5(+) | 33.9 | 37.3 | 28.8 |
Companywide Internet Sales | 1.4 | –1.9 | +3.3 | 5.9 | 1(+) | 21.9 | 57.6 | 20.5 |
| General Business Conditions, Retail Current (versus previous month) | ||||||||
| Indicator | Jul Index | Jun Index | Change | Series Average | Trend** | % Reporting Improved | % Reporting No Change | % Reporting Worsened |
Company Outlook | 11.8 | 5.6 | +6.2 | 3.6 | 5(+) | 18.2 | 75.4 | 6.4 |
General Business Activity | 15.8 | 30.9 | –15.1 | –0.2 | 5(+) | 28.1 | 59.6 | 12.3 |
| Outlook Uncertainty Current (versus previous month) | ||||||||
| Indicator | Jul Index | Jun Index | Change | Series Average | Trend* | % Reporting Increase | % Reporting No Change | % Reporting Decrease |
Outlook Uncertainty† | 14.9 | 8.7 | +6.2 | 8.6 | 2(+) | 21.3 | 72.3 | 6.4 |
| Business Indicators Relating to Facilities and Products in Texas, Retail Future (six months ahead) | ||||||||
| Indicator | Jul Index | Jun Index | Change | Series Average | Trend* | % Reporting Increase | % Reporting No Change | % Reporting Decrease |
| Retail Activity in Texas | ||||||||
Sales | 58.9 | 61.2 | –2.3 | 32.6 | 15(+) | 64.2 | 30.5 | 5.3 |
Employment | 42.0 | 38.4 | +3.6 | 12.6 | 15(+) | 44.8 | 52.4 | 2.8 |
Part–Time Employment | 15.3 | 19.9 | –4.6 | 1.2 | 12(+) | 19.9 | 75.5 | 4.6 |
Hours Worked | 15.1 | 9.8 | +5.3 | 2.9 | 15(+) | 18.3 | 78.5 | 3.2 |
Wages and Benefits | 54.9 | 46.3 | +8.6 | 27.7 | 15(+) | 56.1 | 42.7 | 1.2 |
Input Prices | 59.1 | 52.3 | +6.8 | 33.3 | 15(+) | 68.2 | 22.7 | 9.1 |
Selling Prices | 48.8 | 55.6 | –6.8 | 29.2 | 15(+) | 62.8 | 23.3 | 14.0 |
Capital Expenditures | 29.6 | 24.4 | +5.2 | 17.5 | 14(+) | 34.1 | 61.4 | 4.5 |
Inventories | 39.4 | 37.1 | +2.3 | 9.7 | 15(+) | 50.0 | 39.4 | 10.6 |
| Companywide Retail Activity | ||||||||
Companywide Sales | 55.8 | 53.0 | +2.8 | 31.0 | 15(+) | 64.6 | 26.6 | 8.8 |
Companywide Internet Sales | 43.8 | 53.0 | –9.2 | 22.5 | 16(+) | 43.8 | 56.3 | 0.0 |
| General Business Conditions, Retail Future (six months ahead) | ||||||||
| Indicator | Jul Index | Jun Index | Change | Series Average | Trend** | % Reporting Improved | % Reporting No Change | % Reporting Worsened |
Company Outlook | 35.4 | 32.6 | +2.8 | 17.5 | 15(+) | 36.4 | 62.6 | 1.0 |
General Business Activity | 24.1 | 37.8 | –13.7 | 13.3 | 12(+) | 28.9 | 66.3 | 4.8 |
*Shown is the number of consecutive months of expansion or contraction in the underlying indicator. Expansion is indicated by a positive index reading and denoted by a (+) in the table. Contraction is indicated by a negative index reading and denoted by a (–) in the table.
**Shown is the number of consecutive months of improvement or worsening in the underlying indicator. Improvement is indicated by a positive index reading and denoted by a (+) in the table. Worsening is indicated by a negative index reading and denoted by a (–) in the table.
†Added to survey in January 2018.
Data have been seasonally adjusted as necessary, with the exception of the outlook uncertainty index which does not yet have a sufficiently long time series to test for seasonality.
Texas Service Sector Outlook Survey
Texas Retail Outlook Survey
Texas Service Sector Outlook Survey
Comments from Survey Respondents
These comments are from respondents’ completed surveys and have been edited for publication.
- There is a pickup in activity for our company compared with the prior year.
- Our outlook is better now that we are seeing more candidates applying for positions. The greatest issue has been lack of staffing.
- The key issue is supply-chain constraints limiting growth.
- Short-term negative ripples seem to be the reason for minor changes.
- We have not experienced the growth in sales that we were expecting for July and August (as of July 13, 2021); therefore, my outlook is less certain and less optimistic, but we still believe things will improve over the remainder of 2021.
- A shortage of technology professionals continues to impact the ability to deliver. Sales look like they'll pick up in the fall based on more purchasing decisions being made.
- Lending activity has slowed to some extent with loan paydowns slightly exceeding new-loan fundings. There is increased concern for the anticipated waive of new regulations and the political upheaval being created.
- Inflation uncertainty, interest rate uncertainty and increased competition/margin compression [are our concerns].
- We are still looking for signs that inflation is transitory.
- It is a tough market for oil and gas products for production and drilling—very tough.
- As a financial services company, we are both impacted by and concerned about overall investment and economic market conditions. Investment markets are strong this year—a tailwind to our business. But, some are concerned about 2022 or beyond as stimulus ends.
- The very tight labor market has resulted in our company not growing while there are plenty of growth opportunities. Our employees are dealing with limited child care options.
- Not much change for us insurance brokers. Summer until year-end is quieter (we have a lot of January renewals), and we have had fewer storms. We continue to watch the COVID [situation] for a worsening, which would slow hiring and construction.
- Easing of lumber prices should eventually spill over into the cash market and improve the level of real estate deal-making.
- Houses continue to be in short supply, but some are sitting on the market longer because sellers have gotten greedy and are putting too high of an asking price on their homes.
- Construction of high-end custom homes is in high demand, and preferred builders are quoting three years before they can take on a new project. The work-from-home status of government employees is affecting response time on government projects. We're experiencing delays in obtaining responses from government clients on various levels, which have a negative cost impact on fixed fees.
- Competition for talent has been increasing this year and is resulting in additional bonuses and now increased base compensation for our nonpartner professionals. At the same time, we have seen some utilization numbers lighten over the past month; we expect that to continue into July and August when vacations take hold, and with vaccinations, people are actually traveling. There is some mild concern about how work volumes continue, and we are curious if we will see them return to Q1 levels. If not, this year could end up perhaps better than 2020 but not as strong as we had hoped to see given how 2021 started. We are keeping an eye on inflation and the Fed [Federal Reserve] and business and government activity in general. There are a lot of moving pieces, and we can tell the market is jittery.
- Mid-to-late summer is typically a slower time of year for us as clients (attorneys) take summer vacations. Even with the robust pickup after COVID restrictions relaxed, we are still seeing an evening out (decrease) heading into July/August. In early fall, we expect it to be incredibly busy again. Our calendar is already at max capacity.
- This real estate market is the hottest we have ever seen, and there is no sign that it will slow down in the near future. Texas is the place to be, and everyone is deploying money here.
- We continue to see improved demand for legal services. The winter storm instigated a lot of legal work. We are continuing to see increases on the transactional side and perhaps a bit of a slowdown in large bankruptcy filings. There is huge competition for talent right now—particularly for corporate lawyers. There is a lot of pressure on associate salaries, and we have implemented a new pay scale for associates that will feature retroactive bonuses.
- Projects are taking longer to initiate.
- There is a very high level of design/construction in our core area. The limiting factor continues to be a lack of qualified applicants.
- Availability of product to sell to our customers is continuing to be constrained by the lack of computer chips and other supply-chain problems and is impacting our revenue very negatively. We have a strong pipeline, but each month, we keep having a longer and longer time to delivery.
- The price of oil needs to stay at or above $60–$70 per barrel through the end of the year before I expect improvement in my consulting business.
- Supply-chain issues seem to be better. Summer is always strange for us, so getting some of the vacation out of the way is a good thing.
- Our business is based upon travel to the worksite for inspections. The travel restrictions for OCONUS [outside the continental U.S.] travel need to be addressed. We need a national policy on vaccination records and allowing travel to other countries for vaccinated people. Somebody needs to have the authority to solve this issue outside of the state and federal political football it has become.
- We see continued economic improvement across a broad range of industries. There are concerns about recent price increases in materials and supplies. We need increased capex to find digital and e-commerce needs.
- New Delta [COVID variant] surge is having a great impact on those who are considering travel in the short term.
- We still cannot find applicants for hiring. Our concern is that if and when we gain applicants, we will have vacancies filled with under-trained people. It takes time to train people. We have had so many months without applicants that we will have great challenges training new hires for job openings. This poses a multitude of safety and productivity issues and ultimately affects profitability.
- Concerns about how the Delta variant will impact travel/business travel remain. While it is highly unlikely Texas will be shut down again by government action, that doesn't mean the public/business will feel it is safe to travel.
- There is increasing uncertainty about the virus variants, combined with the decreasing numbers of people being vaccinated. This, with the shortage of professional labor in the workforce, is stifling growth. We are feeling more uncertain these days about the next six months of revenue growth.
- Inflation! Inflation! Inflation!
- General labor [wage] is up 20 percent and tough to get.
- Impact of the Delta [COVID] variant remains a concerning unknown that makes forecasting difficult.
- Overall uncertainty has decreased, but the Delta [COVID] variant is putting a scare into health care service providers from a service perspective. Hospital-based admissions and ventilator patients are going up (almost all of the cases are from the unvaccinated population). This is causing an increase in the uncertainty aspect of the health care business environment.
- Though no change month to month, we are realizing the challenges of a limited workforce and extreme increases in costs of goods and services.
- Due to the nature of our mission, 55 percent of our operating expense is labor. We will not be able to raise prices at a rate that covers the increase in labor rates.
- As we return to the office, there is increased risk of the spread of COVID-19, which carries with it some level of uncertainty in those terms. However, there is decreased uncertainty in that our core offerings are to increase as the labor market continues trending toward some degree of expansion.
- We are a hotel company. In July, our properties will see the best month of the year. In August, we see a slowdown in the second half of the month due to school starting. Fourth quarter will be strong. We will leave 2021 significantly better than when we started. First quarter in 2022 should be much better than a year ago, barring another winter storm like last February.
- We are still struggling to find service associates and culinary staff despite significant wage rate increases and hiring and retention bonuses.
- The Delta [COVID] variant is worrying me. Will conventions be canceled, will travel be canceled? Will we be back to mandatory masks? What about school and office workers? It is even more contagious; is this another disaster waiting to happen?
- Inflation and labor shortages [are concerns].
- We are hiring a few employees after the federal [unemployment] subsidy ended but continue to lose others oftentimes because they say they don't want to work or decide to attend a social function and walk off. They know they can get hired again by walking down the street. Hire three, lose four. Hire two, lose one. I have never seen anything like this in my almost-40 years of working. We continue to turn away business due to lack of employees. Raw product prices continue to significantly increase. It is difficult to raise prices, but we will have to soon. Our downtown area remains sparsely populated with little activity, which is critical to our business.
- The downtown area has improved and has thus brought better revenue. The struggle to restaff to pre-COVID levels has remained difficult. Quality of employees is not there. Unemployment claims are still coming in steadily. The business climate has improved, and the city is busier on all fronts.
- Uncertainty has increased in July over June due to the COVID cases rising.
- July is traditionally a slower month. We are open seven days a week now instead of six to help lower our occupancy costs. Right now, the things affecting our business are: training and staff retention and how that affects our services; wages; COVID-19 picking up with the Delta [COVID] variant and unvaccinated people; and the weather affecting our outdoor seating with rain and heat, to name a few.
- The Delta [COVID] variant has created more uncertainty.
- We won two major grants—one for one year in the amount of $747,500 specifically for COVID Cares training. The other is the renewal of our MBDA [minority business development agency] Business Center at $410,000 a year, totaling $2,050,000 for a five-year cycle. We are currently pending another grant specifically for COVID support to women in the amount of $200,000 and hoping to get word on it as it's good for two years. In addition, we are in the process of a grant with others on a national level for [an] award that would be $500,000 for two years. So, we are excited about the opportunity to hire more, expand our reach and support rural areas of the region.
- We had hoped that labor tightness would have corrected a bit, but that does not seem to be the case.
- The general environment seems to be improving. We're still seeing supply-chain challenges. For example, we place a PO [purchase order] with a supplier that typically requires seven to 10 days lead time, and that's getting pushed to 21 days. Also, our orders are being shorted by up to 50 percent of the requested quantities. Suppliers claim people aren't coming to work, so production is down 30 percent. Poultry suppliers expect some winter challenges to resolve by September, so we might see some relief soon.
- Weather conditions have been detrimental to sales (part of agriculture). Having some difficulty sourcing employees. The cost to attract and retain employees is escalating. Input cost is much higher than last year and rising. We are having difficulty raising selling prices fast enough to keep up with inflation.
- The COVID spike has increased in our area, creating some concern. Inventories are still diminished.
- Automotive inventories remain very low, and parts availability remains a real issue.
- We are seeing retail used-car and truck prices soften.
- The microchip shortage and other supply-chain issues continue to adversely impact the car/truck business. New-car/truck inventories are at all-time lows without any short-term improvement seen. Hopefully, we will see some improvement in fourth quarter, but that is unknown at this point.
Historical Data
Historical data can be downloaded dating back to January 2007.
Indexes
Download indexes for all indicators. For the definitions of all variables, see Data Definitions.
Texas Service Sector Outlook Survey |
Texas Retail Outlook Survey |
| Unadjusted | Unadjusted |
| Seasonally adjusted | Seasonally adjusted |
All Data
Download indexes and components of the indexes (percentage of respondents reporting increase, decrease, or no change). For the definitions of all variables, see Data Definitions.
Texas Service Sector Outlook Survey |
Texas Retail Outlook Survey |
| Unadjusted | Unadjusted |
| Seasonally adjusted | Seasonally adjusted |
Questions regarding the Texas Service Sector Outlook Survey can be addressed to Christopher Slijk at christopher.slijk@dal.frb.org.
Sign up for our email alert to be automatically notified as soon as the latest Texas Service Sector Outlook Survey is released on the web.