
Texas Service Sector Outlook Survey
Modest growth continues in Texas service sector
For this month’s survey, Texas business executives were asked supplemental questions on wages, prices and outlook concerns. Results for these questions from the Texas Manufacturing Outlook Survey, Texas Service Sector Outlook Survey and Texas Retail Outlook Survey have been released together. Read the special questions results.
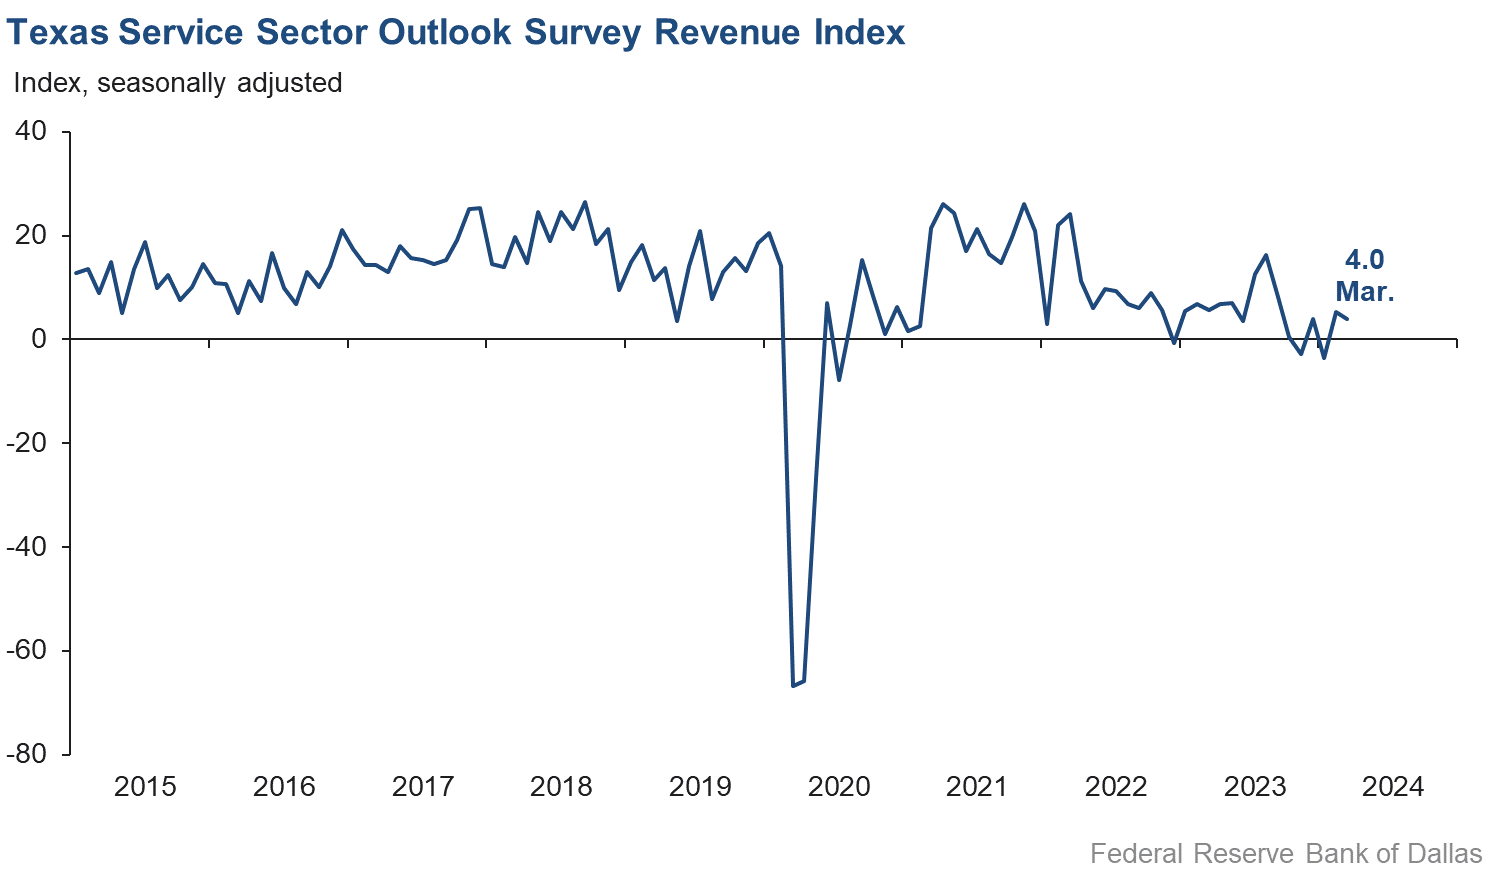
Texas service sector activity expanded in March, according to business executives responding to the Texas Service Sector Outlook Survey. The revenue index, a key measure of state service sector conditions, held mostly steady at 4.0, indicative of below-average activity growth.
Labor market measures suggested no growth in employment and work weeks. The employment index fell five points to -1.2 in March. The part-time employment index also fell from 2.8 to -1.2, while the hours worked index held steady at 0.7. These near-zero readings suggest flat employment and work hours in March.
Respondents in March continued to perceive worsening broader business conditions. The general business activity index remained negative and fell two points to -5.5. The company outlook index fell from 3.8 to -0.1, with the near-zero figure indicating companies’ outlooks did not improve in March. The outlook uncertainty index increased four points to 10.2.
Selling price pressure remained unchanged, while input price pressures eased. Wage growth accelerated slightly in March. The selling price index was unchanged at 7.7 while the input price index fell from 34.3 to 30.4. The wages and benefits index increased four points to 19.5.
Respondents’ expectations regarding future business activity continued to reflect optimism in March. The future general business activity index fell but remained in positive territory at 5.4, and the future revenue index held mostly steady at 39.2. Other future service-sector activity indexes such as employment and capital expenditures remained in firmly positive territory, reflecting expectations for continued growth in the next six months.

Texas Retail Outlook Survey
Texas retail sales fall, but at a slower rate for the second month in a row
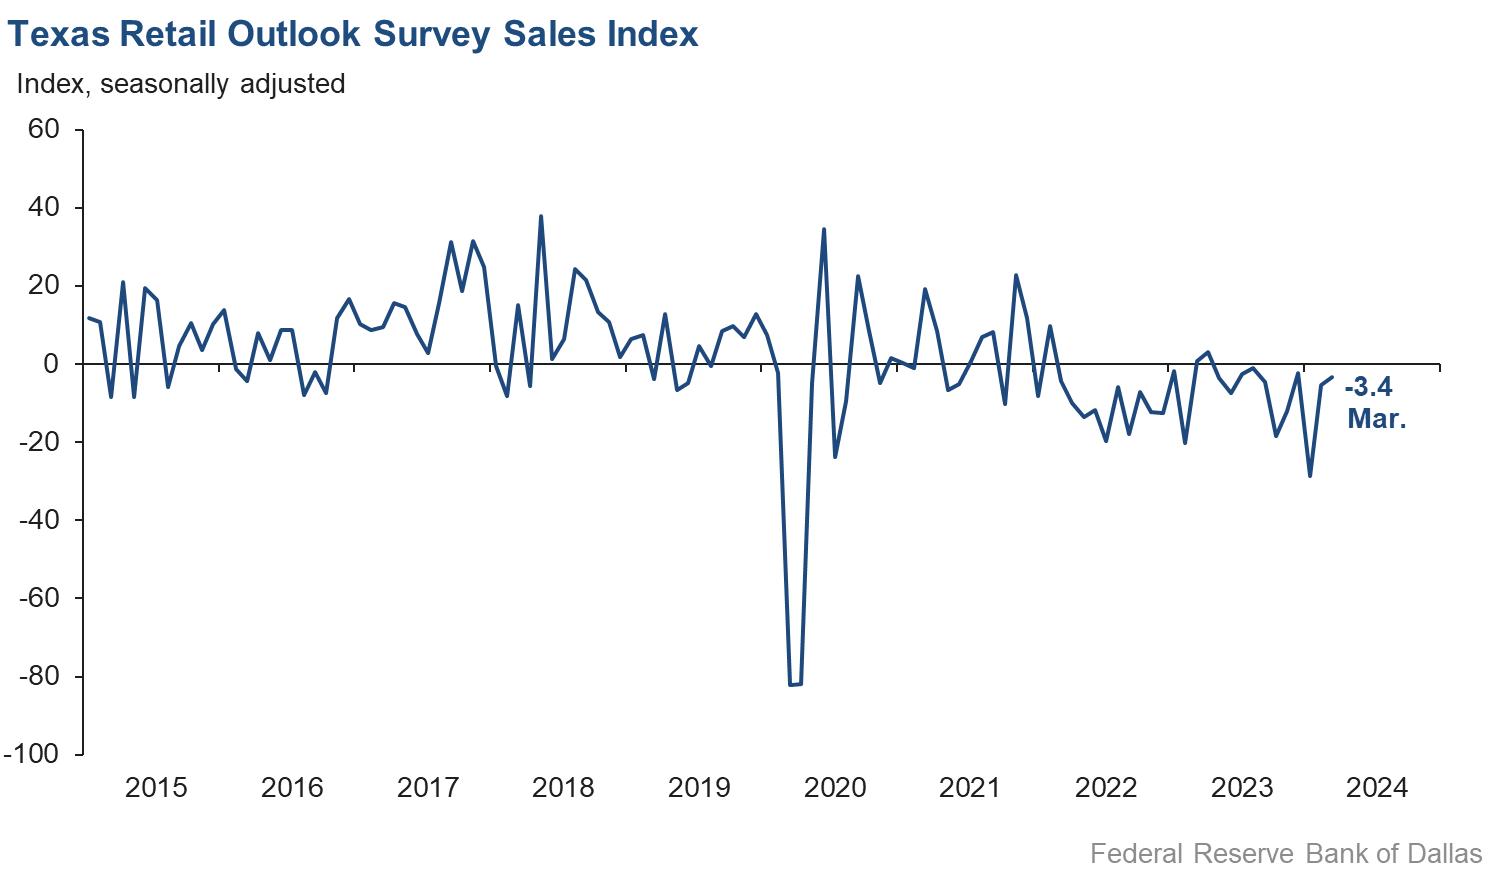
Retail sales activity declined in March, but at a slightly slower pace than last month, according to business executives responding to the Texas Retail Outlook Survey. The sales index, a key measure of state retail activity, increased from -5.3 to -3.4, indicating retail sales fell at a slower rate than the previous month. Retailers’ inventories grew over the month, with the March index at 16.1.
Retail labor market indicators reflected contraction in employment growth and shorter workweeks in March. The employment index fell from 2.4 to -5.0, and the part-time employment index fell three points to 1.3. The hours worked index fell from -4.6 to -6.3.
Retailers continued to perceive a worsening of broader business conditions in March. The general business activity index increased two points but remained in negative territory at -15.6, while the company outlook index held steady at -4.5. The outlook uncertainty index increased six points to 15.8.
Input price and wage pressures increased while selling price pressure was unchanged in March. The input price index increased five points to 27.0 while the selling price index held mostly steady at 4.4. The wages and benefits index moved up ten points to 22.4.
Expectations for future retail growth improved in March. The future general business activity index increased from -0.9 to 8.2. The future sales index jumped 25 points to 33.5. Other indexes of future retail activity such as employment and capital expenditures were positive and increased, reflecting expectations for continued retail sales growth in the next six months.
Next release: April 30, 2024
Data were collected March 12–20, and 276 of the 414 Texas service sector business executives surveyed submitted a response. The Dallas Fed conducts the Texas Service Sector Outlook Survey monthly to obtain a timely assessment of the state’s service sector activity. Firms are asked whether revenue, employment, prices, general business activity and other indicators increased, decreased or remained unchanged over the previous month.
Survey responses are used to calculate an index for each indicator. Each index is calculated by subtracting the percentage of respondents reporting a decrease from the percentage reporting an increase. When the share of firms reporting an increase exceeds the share reporting a decrease, the index will be greater than zero, suggesting the indicator has increased over the prior month. If the share of firms reporting a decrease exceeds the share reporting an increase, the index will be below zero, suggesting the indicator has decreased over the prior month. An index will be zero when the number of firms reporting an increase is equal to the number of firms reporting a decrease.
Data have been seasonally adjusted as necessary.
Texas Service Sector Outlook Survey
Historical data are available from January 2007 to the most current release month.
| Business Indicators Relating to Facilities and Products in Texas Current (versus previous month) | ||||||||
| Indicator | Mar Index | Feb Index | Change | Series Average | Trend* | % Reporting Increase | % Reporting No Change | % Reporting Decrease |
Revenue | 4.0 | 5.2 | –1.2 | 10.7 | 2(+) | 24.0 | 55.9 | 20.0 |
Employment | –1.2 | 3.8 | –5.0 | 6.4 | 1(–) | 10.7 | 77.4 | 11.9 |
Part–Time Employment | –1.2 | 2.8 | –4.0 | 1.5 | 1(–) | 3.2 | 92.4 | 4.4 |
Hours Worked | 0.7 | 0.3 | +0.4 | 2.7 | 2(+) | 7.7 | 85.3 | 7.0 |
Wages and Benefits | 19.5 | 15.4 | +4.1 | 15.8 | 46(+) | 22.3 | 74.9 | 2.8 |
Input Prices | 30.4 | 34.3 | –3.9 | 28.0 | 47(+) | 33.9 | 62.7 | 3.5 |
Selling Prices | 7.7 | 7.7 | 0.0 | 7.7 | 44(+) | 18.3 | 71.1 | 10.6 |
Capital Expenditures | 6.7 | 10.3 | –3.6 | 10.0 | 44(+) | 14.9 | 76.9 | 8.2 |
| General Business Conditions Current (versus previous month) | ||||||||
| Indicator | Mar Index | Feb Index | Change | Series Average | Trend** | % Reporting Improved | % Reporting No Change | % Reporting Worsened |
Company Outlook | –0.1 | 3.8 | –3.9 | 4.4 | 1(–) | 12.7 | 74.4 | 12.8 |
General Business Activity | –5.5 | –3.9 | –1.6 | 2.5 | 22(–) | 11.2 | 72.1 | 16.7 |
| Indicator | Mar Index | Feb Index | Change | Series Average | Trend* | % Reporting Increase | % Reporting No Change | % Reporting Decrease |
Outlook Uncertainty | 10.2 | 6.7 | +3.5 | 13.5 | 34(+) | 21.3 | 67.6 | 11.1 |
| Business Indicators Relating to Facilities and Products in Texas Future (six months ahead) | ||||||||
| Indicator | Mar Index | Feb Index | Change | Series Average | Trend* | % Reporting Increase | % Reporting No Change | % Reporting Decrease |
Revenue | 39.2 | 37.8 | +1.4 | 37.4 | 47(+) | 48.9 | 41.5 | 9.7 |
Employment | 21.9 | 20.9 | +1.0 | 23.2 | 47(+) | 30.9 | 60.1 | 9.0 |
Part–Time Employment | 5.5 | 6.8 | –1.3 | 6.7 | 21(+) | 12.0 | 81.5 | 6.5 |
Hours Worked | 4.9 | 5.5 | –0.6 | 5.8 | 47(+) | 11.6 | 81.7 | 6.7 |
Wages and Benefits | 36.0 | 33.7 | +2.3 | 37.4 | 47(+) | 39.6 | 56.8 | 3.6 |
Input Prices | 38.1 | 40.3 | –2.2 | 44.6 | 207(+) | 44.7 | 48.8 | 6.6 |
Selling Prices | 24.7 | 22.5 | +2.2 | 24.7 | 47(+) | 32.9 | 58.8 | 8.2 |
Capital Expenditures | 17.4 | 18.1 | –0.7 | 23.0 | 46(+) | 24.5 | 68.4 | 7.1 |
| General Business Conditions Future (six months ahead) | ||||||||
| Indicator | Mar Index | Feb Index | Change | Series Average | Trend** | % Reporting Improved | % Reporting No Change | % Reporting Worsened |
Company Outlook | 12.2 | 15.6 | –3.4 | 15.5 | 5(+) | 23.7 | 64.8 | 11.5 |
General Business Activity | 5.4 | 12.0 | –6.6 | 12.1 | 4(+) | 21.7 | 62.0 | 16.3 |
Historical data are available from January 2007 to the most current release month.
| Business Indicators Relating to Facilities and Products in Texas Retail (versus previous month) | ||||||||
| Indicator | Mar Index | Feb Index | Change | Series Average | Trend* | % Reporting Increase | % Reporting No Change | % Reporting Decrease |
| Retail Activity in Texas | ||||||||
Sales | –3.4 | –5.3 | +1.9 | 3.8 | 11(–) | 23.5 | 49.6 | 26.9 |
Employment | –5.0 | 2.4 | –7.4 | 1.8 | 1(–) | 7.6 | 79.8 | 12.6 |
Part–Time Employment | 1.3 | 4.5 | –3.2 | –1.5 | 2(+) | 3.0 | 95.3 | 1.7 |
Hours Worked | –6.3 | –4.6 | –1.7 | –2.1 | 3(–) | 4.7 | 84.3 | 11.0 |
Wages and Benefits | 22.4 | 12.9 | +9.5 | 11.3 | 44(+) | 26.1 | 70.2 | 3.7 |
Input Prices | 27.0 | 22.3 | +4.7 | 22.8 | 47(+) | 33.7 | 59.6 | 6.7 |
Selling Prices | 4.4 | 3.8 | +0.6 | 13.7 | 46(+) | 26.8 | 50.8 | 22.4 |
Capital Expenditures | 4.8 | 12.6 | –7.8 | 7.9 | 4(+) | 12.9 | 79.0 | 8.1 |
Inventories | 16.1 | 18.9 | –2.8 | 2.7 | 5(+) | 34.8 | 46.5 | 18.7 |
| Companywide Retail Activity | ||||||||
Companywide Sales | 2.4 | –12.6 | +15.0 | 5.0 | 1(+) | 24.5 | 53.5 | 22.1 |
Companywide Internet Sales | 6.5 | –11.8 | +18.3 | 4.1 | 1(+) | 21.0 | 64.5 | 14.5 |
| General Business Conditions, Retail Current (versus previous month) | ||||||||
| Indicator | Mar Index | Feb Index | Change | Series Average | Trend** | % Reporting Improved | % Reporting No Change | % Reporting Worsened |
Company Outlook | –4.5 | –5.0 | +0.5 | 1.9 | 6(–) | 8.7 | 78.1 | 13.2 |
General Business Activity | –15.6 | –18.0 | +2.4 | –2.1 | 9(–) | 8.2 | 68.0 | 23.8 |
| Outlook Uncertainty Current (versus previous month) | ||||||||
| Indicator | Mar Index | Feb Index | Change | Series Average | Trend* | % Reporting Increase | % Reporting No Change | % Reporting Decrease |
Outlook Uncertainty | 15.8 | 9.5 | +6.3 | 11.4 | 4(+) | 26.3 | 63.2 | 10.5 |
| Business Indicators Relating to Facilities and Products in Texas, Retail Future (six months ahead) | ||||||||
| Indicator | Mar Index | Feb Index | Change | Series Average | Trend* | % Reporting Increase | % Reporting No Change | % Reporting Decrease |
| Retail Activity in Texas | ||||||||
Sales | 33.5 | 8.7 | +24.8 | 30.6 | 10(+) | 41.3 | 50.9 | 7.8 |
Employment | 17.3 | 9.3 | +8.0 | 12.9 | 15(+) | 23.7 | 69.9 | 6.4 |
Part–Time Employment | 8.7 | 5.8 | +2.9 | 1.6 | 4(+) | 14.1 | 80.5 | 5.4 |
Hours Worked | –0.9 | –8.0 | +7.1 | 2.5 | 2(–) | 9.4 | 80.3 | 10.3 |
Wages and Benefits | 37.2 | 22.5 | +14.7 | 29.1 | 47(+) | 39.3 | 58.7 | 2.1 |
Input Prices | 39.2 | 14.0 | +25.2 | 34.0 | 47(+) | 45.1 | 49.0 | 5.9 |
Selling Prices | 21.2 | 2.0 | +19.2 | 29.1 | 47(+) | 40.4 | 40.4 | 19.2 |
Capital Expenditures | 10.9 | 5.4 | +5.5 | 16.8 | 4(+) | 22.7 | 65.5 | 11.8 |
Inventories | 15.9 | 8.6 | +7.3 | 10.7 | 5(+) | 33.0 | 49.8 | 17.1 |
| Companywide Retail Activity | ||||||||
Companywide Sales | 30.7 | 8.0 | +22.7 | 29.2 | 10(+) | 38.9 | 52.9 | 8.2 |
Companywide Internet Sales | 0.0 | 5.3 | –5.3 | 21.2 | 1() | 17.9 | 64.1 | 17.9 |
| General Business Conditions, Retail Future (six months ahead) | ||||||||
| Indicator | Mar Index | Feb Index | Change | Series Average | Trend** | % Reporting Improved | % Reporting No Change | % Reporting Worsened |
Company Outlook | 15.4 | 4.2 | +11.2 | 15.1 | 2(+) | 23.4 | 68.6 | 8.0 |
General Business Activity | 8.2 | –0.9 | +9.1 | 10.4 | 1(+) | 23.0 | 62.2 | 14.8 |
*Shown is the number of consecutive months of expansion or contraction in the underlying indicator. Expansion is indicated by a positive index reading and denoted by a (+) in the table. Contraction is indicated by a negative index reading and denoted by a (–) in the table.
**Shown is the number of consecutive months of improvement or worsening in the underlying indicator. Improvement is indicated by a positive index reading and denoted by a (+) in the table. Worsening is indicated by a negative index reading and denoted by a (–) in the table.
Data have been seasonally adjusted as necessary.
Texas Service Sector Outlook Survey
Texas Retail Outlook Survey
Texas Service Sector Outlook Survey
Comments from survey respondents
These comments are from respondents’ completed surveys and have been edited for publication.
- General business activity has picked up.
- We are seeing a slowdown in capital expenditures for existing real estate buildings.
- We were forced to raise prices 7 percent this month because labor expense is too high.
- The elections are still a variable that keeps the uncertainty high.
- The general level of business activity is healthy, but current growth is dismal.
- Relatively stable at the moment, tentatively watching prices tick back up.
- Our company has already laid off all nonessential staff. There is no liquidity in the market, no ability to get debt. Fear of a recession continues to dominate, and the Federal Reserve is hesitant to signal rate cuts.
- We are hiring new support people for our sales and brokerage business.
- The property insurance industry has become very tough here in Texas, especially in 2024. Rapidly increasing premium rates plus higher deductibles are being applied to all homeowners, residential and commercial property owners. It’s very tough to find affordable terms, and many insurance companies are restricting what they offer. It's a very serious issue that doesn't appear to be addressed on any governmental level.
- The level of transaction activity in commercial real estate (sales, financing, new development pursuits) is anticipated to increase in the second half of the year, as soon as the Federal Reserve starts reducing rates.
- The political rhetoric and upcoming elections will continue to ramp up through the year, and the closer we get to the elections, the more uncertainty and pessimism will grow and dampen consumer sentiment, which is very important to our business.
- We are curtailing business investment due to high interest rates.
- The unmitigated volume of additional regulations promoted by this administration is creating a burden that has and will continue to negatively impact the consumer. The upcoming election could be a critical turning point for our country’s future and community banking. Inflation is now having obvious impacts on some subsets in the economy, and as consumer debt continues to grow, the money volume slows down and we draw closer to a potential recession, there are concerns and the possibility of long-term negative consequences.
- American enterprises need relief. There’s a forming perfect storm that creates a dangerous paralysis.
- The labor market seems to be loosening up a small bit. Things seem to be slowing down. Most developers are finishing up projects already started but not yet looking for another project. The multifamily and industrial sectors seem to still be moving forward. House sales are not moving at all in the higher-priced homes. Rent-to-own is a growing concept. Rising costs still put pressure on profit margins.
- We see a slow start to client spending this year.
- The business climate has slowed. There is uncertainty regarding the general economy, inflation, interest rates and the presidential race. We are somewhat pessimistic for the remainder of 2024.
- Buyers seem paralyzed by a lack of visibility into the future. We work with companies looking for talent. Although unemployment is relatively low and many companies are looking for the right talent, activity didn't increase this year until late February. Many of these companies have had open positions for a while, but it seems they are ready to get them filled because they know they need the right people to grow their companies.
- The number of employees has decreased because of attrition. We are looking for replacements.
- We’ve had a slight uptick in billable hours, and revenue is better year to date.
- While inflation may be propping up the economy some, we are still amazed that the economy has been so resilient, given the many headwinds it is facing.
- Costs are continuing to increase, and borrowing is getting more complex. New government rules keep piling on, harming us as a small business and making it more costly to operate.
- Although we have seen an increase in real estate orders the past month, the general level of business activity still remains sluggish. We don't see this changing until the regional banks’ liquidity issues get resolved and we have a better understanding of where the interest rates are going to settle.
- Our business in the Asian and U.S. markets is growing.
- Our outlook has increased primarily due to our internal efforts and investment in sales and marketing activities.
- Most businesses in our category will continue to assess market data and the potential for a modest rate cut before fully committing to any sort of accelerated growth. Employee wage increases and other associated costs (insurance, workers’ compensation) and the recent Department of Labor rule changes will impact growth.
- Indications are that there is a slowdown on the horizon, yet expenses are rising, including wages and benefits. Productivity in general is down significantly. People don't seem to want to work, and new hires need a lot of training.
- We have the fewest zoning cases for new multifamily dating back to before the Great Recession. Overall activity is low, as are filings across the board at the City of Dallas. If things are not in the pipeline now, the construction sector will feel this pain in 2025 and beyond. This is by far worse than during the pandemic. Dallas County is not a low-cost place to do business.
- The position we are intending to add is one that we have needed to add for many months. We're hoping to find an engineer. If we had more confidence in the market, we would probably add two or three positions. Right now, we feel that the third and fourth quarters are going to be weak. Some of this is due to uncertainty with the election. Some of our worries stem from strength of the economy.
- Election years are always turbulent.
- Way too many regulations. Many regulations do nothing but confuse our customers.
- Higher interest rates have significantly slowed demand for credit and loans. This translates into slower growth and lessened capital expenditures for our clients. Consumers are beginning to show effects of higher borrowing rates and inflation pressures, with increasing past-due loan payments and growing consumer debt.
- General economic indicators remain strong. Client activity is positive and improving. Staffing skilled positions remains challenging.
- Business in the last six weeks has softened. We are in one of our traditionally busiest periods, and we are experiencing a 10 to 15 percent decrease in business demand.
- Sales are starting to pick up. From September 2023 to the end of January 2024, sales were down relative to historical expectations, but February and March seem to be normalizing against historical averages. In discussions with other industry folks, the consensus is that the consumer now has the cost of inflation baked into their budget, so restaurant spending appears to be coming back.
- We are seeing some pressure from a national and global slowdown in West Texas, but it is being counteracted by an increase in oil prices. We believe overall the price of oil will outweigh the negative pressure from a national slowdown. There is not a clear winner right now, but the two combatting sides are making our forecast very unclear and unpredictable.
- Inflation is hurting our business. People cannot afford to buy the products they did before. We have many requests to fill smaller quantities of medications. Prices everywhere are too high.
- We think rates are still too high. Our company profits are still 35 percent lower than three years ago.
- A shakeout of the weak retailer is looming. Fixed costs are not able to be passed on in this environment.
- First quarter of 2024 will be more challenging than the prior year. January was a very soft market, February rebounded somewhat, and March is mixed. Volume is up, but margins shrink. Inventories are too high, and cost-to-carry at today's high interest rates creates double trouble. Grosses are down, expenses up, profits declining.
- New vehicle inventories are increasing at a dramatic rate, raising the cost of inventory financing considerably.
- Return to office and soft business travel continue to impact customer demand. Our cost of food and beverage continues to increase, although slightly slower. It’s the same for labor, not as much pressure to increase wages although continuing inflation is hurting our employees. Increases in selling prices may well be contributing to soft customer demand as well.
- Many new restaurants are opening in Houston. We are oversupplied. We expect many to close. Prices and wages are still high; guests are pushing back. New restaurants are busy; older ones not so much. Rents are still high but not really sustainable. It’s not a good time in our industry.
Historical Data
Historical data can be downloaded dating back to January 2007.
Indexes
Download indexes for all indicators. For the definitions of all variables, see data definitions.
Texas Service Sector Outlook Survey |
Texas Retail Outlook Survey |
| Unadjusted | Unadjusted |
| Seasonally adjusted | Seasonally adjusted |
All Data
Download indexes and components of the indexes (percentage of respondents reporting increase, decrease, or no change). For the definitions of all variables, see data definitions.
Texas Service Sector Outlook Survey |
Texas Retail Outlook Survey |
| Unadjusted | Unadjusted |
| Seasonally adjusted | Seasonally adjusted |
Questions regarding the Texas Service Sector Outlook Survey can be addressed to Jesus Cañas at jesus.canas@dal.frb.org.
Sign up for our email alert to be automatically notified as soon as the latest Texas Service Sector Outlook Survey is released on the web.