Eagle Ford Shale
Advances in horizontal drilling technology have allowed companies to extract oil and natural gas from the Eagle Ford Shale for more than a decade, bringing jobs to many rural communities in South Texas. Using the tabs below, learn more about the growth in oil and natural gas production across the region and its effects on employment.
| Highlights |
|---|
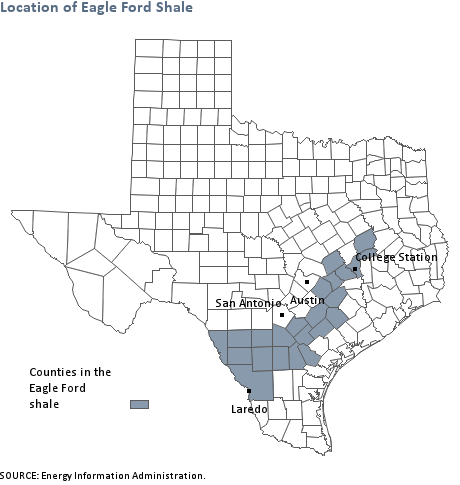
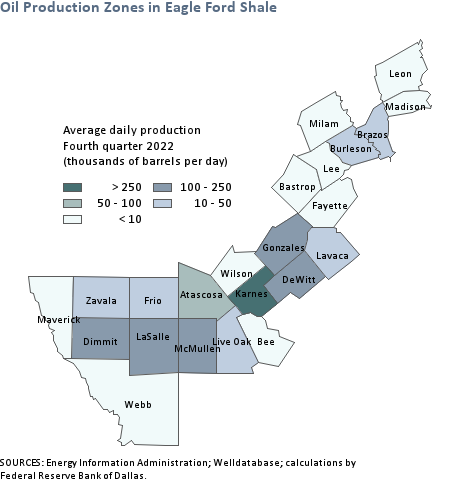
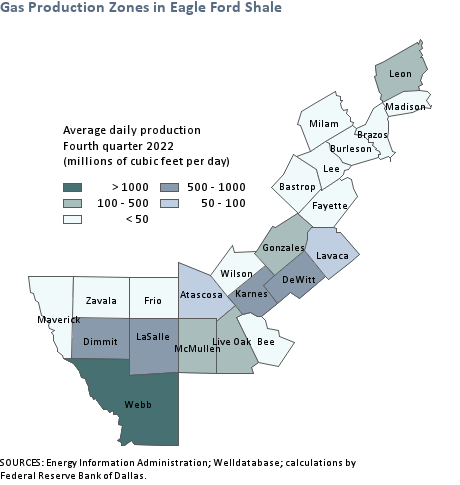
According to the Energy Information Administration, the currently defined boundaries of the Eagle Ford Shale formation fall within a 23-county region. During fourth quarter 2023, the top three counties in terms of crude oil production for the Eagle Ford were Karnes County (259,400 barrels per day (b/d)), Dimmit (117,500 b/d) and La Salle (109,000 b/d). These three counties produced 44 percent of Eagle Ford's oil. Webb county is by far the region's largest producer of natural gas, with production averaging 2.9 billion cubic feet per day in fourth quarter 2023.[1] Major cities close to the Eagle Ford include San Antonio and Austin. Major cities in the Eagle Ford are Laredo and College Station. |
Notes
- For more information on how these production numbers are calculated, see Energy Data Explantory Notes and Resources.
The Eagle Ford Shale forms an arc across 20,000 square miles in South Texas. It begins in Laredo near the Mexico border and extends 400 miles northeast between Austin and Houston. The formation is divided into three zones, commonly referred to as windows (Chart 1).
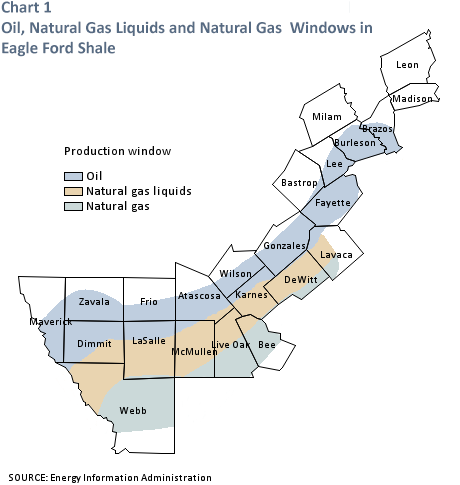
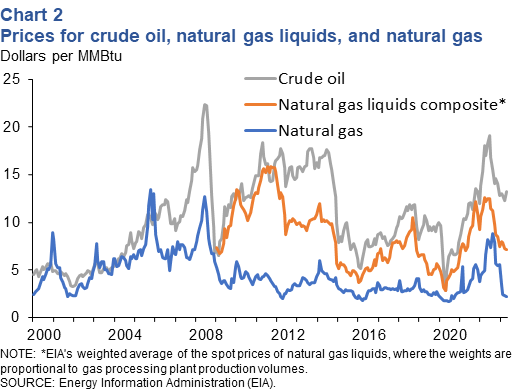
The northernmost window contains high concentrations of oil while the southernmost window contains high concentrations of natural gas. And the central window contains natural gas liquids, such as ethane, propane and butane, which are used to produce a variety of industrial products.[1] These windows have played an important part in the story of the Eagle Ford, as they allow drillers to target different areas depending upon which commodity is most valuable. While companies initially focused on the area's natural gas resources, the other windows have attracted the lion share of activity over the past decade, due to the relatively low price of natural gas in the United States (Chart 2).[2]
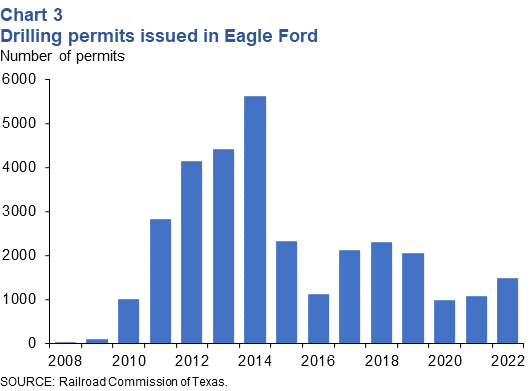
Petrohawk Energy Corp. completed the Eagle Ford's first well in October 2008.[3] Activity was slow to pick up at first, due to the onset of the Great Recession and a sharp decline in natural gas prices. Starting in 2010, though, the area experienced a gold rush that lasted through 2014. The number of drilling permits (Chart 3) and completed wells (Chart 4) skyrocketed, and both oil and gas production followed suit. By the end of 2014 the area was producing 18 percent the country's oil and 8 percent of its natural gas (Chart 5).
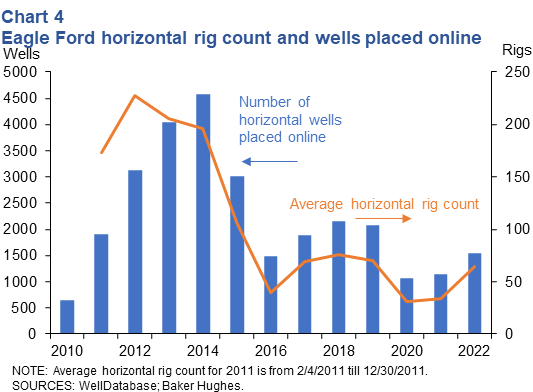
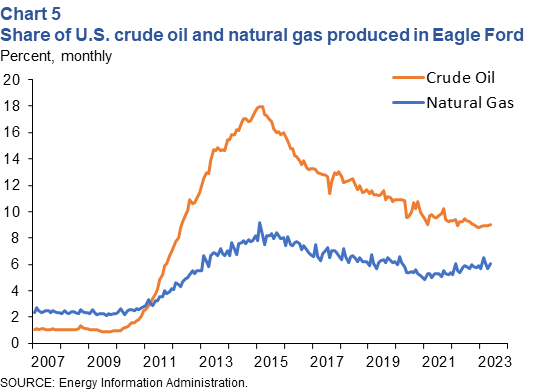
The gold rush ended even faster than it began, though. The boom had been supported by a period of relatively high oil prices but at the end of 2014 those prices declined precipitously. This led to a sharp cutback in drilling activity both inside and outside the Eagle Ford. As in other areas in the country, lower prices spurred E&P companies operating in the Eagle Ford to become more efficient in a variety of ways. This has included shifting drilling activity to the best acreage, finding ways to optimize well spacing and completions design, and reducing costs by increasing scale.
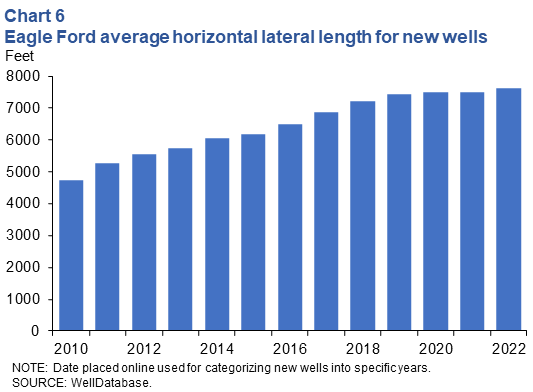
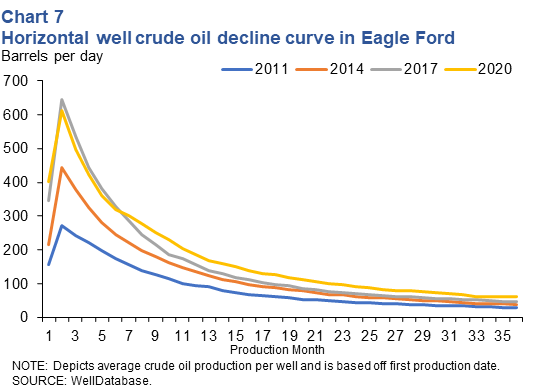
Companies also have made efforts to increase the horizontal lateral length of the wells being drilled (Chart 6). Those lengths have leveled off in recent years, though, to an average of about 7,500 feet. This has had impacts on the well-level economics relative to some other basins, which have seen more substantial changes in lateral length. For example, in the Permian Basin and the Bakken companies drill wells with lateral lengths of near 10,000 feet, on average. While production for new wells in the Eagle Ford saw improvement in the initial years, that improvement has also flatlined in recent years (Chart 7).
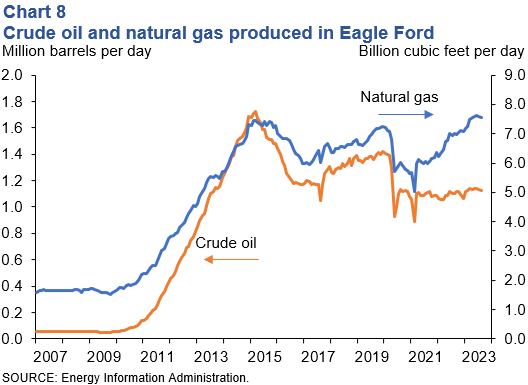
Since the price bust, neither drilling activity nor oil and gas production in the Eagle Ford have recovered back to their peak levels. However, the efficiency gains made by companies since the bust have allowed the economics of the Eagle Ford to remain favorable enough to sustain a reasonable level of activity, stabilizing oil production at over 1 mb/d (Chart 8).[4] In the first quarter 2023 Dallas Fed Energy Survey, operators reported they needed, on average, $56 per barrel to profitably drill a new well in the Eagle Ford, below the average WTI price during the survey period ($69 per barrel).
Estimates from the Energy Information Administration for 2021 estimate the Eagle Ford still contains 30.0 trillion cubic feet in technically recoverable natural gas and 3.6 billion barrels in technically recoverable oil.[5] With the diversity of its resources and its close proximity to the coast, which reduces transportation cost versus other basins, the Eagle Ford is poised to continue producing for many years to come. However, significant growth is unlikely in the coming years in the current pricing environment, as the basin has matured and most of the “sweet” spots in the basin have already been drilled.
Notes
- For more information on natural gas liquids and their many uses, see What Are Natural Gas Liquids and How Are They Used?, Energy Information Administration, April 20, 2012.
- Oil Boom in Eagle Ford Shale Brings New Wealth to South Texas, Southwest Economy, Second Quarter 2012.
- The Discovery of the Eagle Ford Shale, Texas A&M University-Corpus Christi.
- Drilling Productivity Report, Energy Information Administration.
- U.S. Crude Oil and Natural Gas Proved Reserves, Energy Information Administration.
| Highlights |
|---|
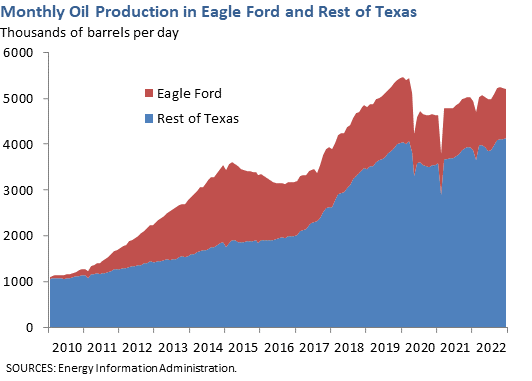
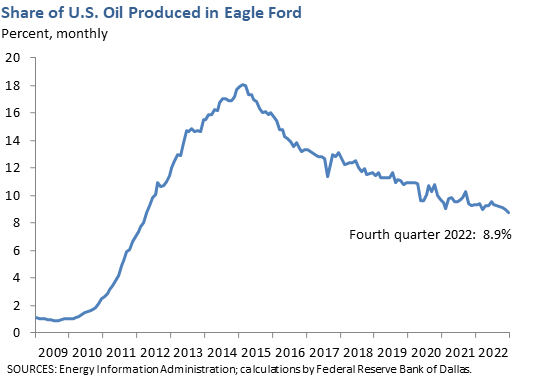
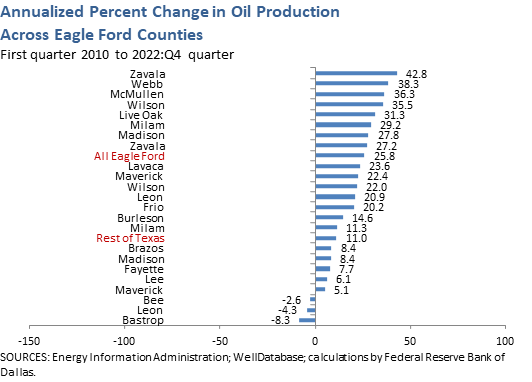
Oil production growth in Eagle Ford began accelerating in 2010. Production in the region approximately doubled every year between 2010 and 2013. Since 2015, production has come down but remains significantly higher than in 2010. The share of U.S. oil produced in the Eagle Ford has also grown rapidly. In January 2010, the Eagle Ford produced just 1 percent of U.S. oil, but in December 2023, it accounted for 8.3 percent of the nation's oil production.[1] The pace of production growth has varied across the counties in the Eagle Ford. Some counties have experienced especially dramatic growth. For instance, in first quarter 2010, La Salle county produced only 1800 barrels per day, but by fourth quarter 2023, it yielded 109,000 barrels per day.[2] |
| Eagle Ford Oil Production Fourth Quarter 2023 |
||
|---|---|---|
| Barrels per day (thousands) |
Year/year change (percent) |
|
| Eagle Ford counties | 1,105.2 | 1.0 |
| Rest of Texas | 4,519.8 | 9.7 |
| SOURCE: Energy Information Administration. | ||
| Top Oil-Producing Counties in Eagle Ford Fourth Quarter 2023 |
||
|---|---|---|
| Barrels per day (thousands) |
Year/year change (percent) |
|
| Karnes | 259.4 | –8.8 |
| Dimmit | 117.5 | 16.0 |
| La Salle | 109.0 | 2.6 |
| SOURCES: Energy Information Administration; WellDatabase; calculations by Federal Reserve Bank of Dallas. |
||
Notes
- Overall production for the Eagle Ford comes directly from the Energy Information Administration's Drilling Productivity Report.
- Data from the Energy Information Administration's Drilling Productivity Report is combined with county-level production data from the Welldatabase.com to estimate county-level production. For more information on how these series are computed, see Energy Data Explanatory Notes and Resources.
| Highlights |
|---|
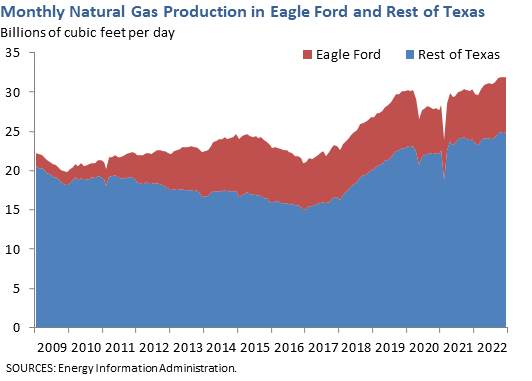
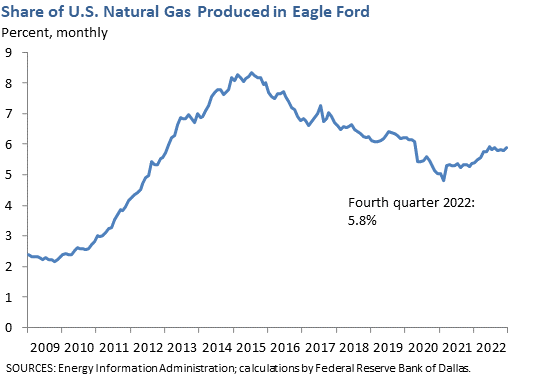
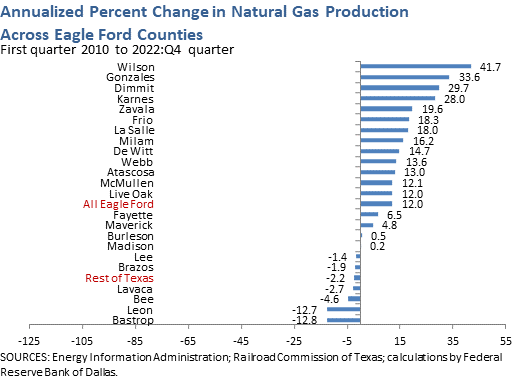
Natural gas production in the Eagle Ford has increased an average of 12.7 percent per year since January 2010. As a result of these increases, the Eagle Ford now accounts for 6.0 percent of all U.S. natural gas production.[1] As with oil production, the growth rate of natural gas production has varied substantially across counties in the Eagle Ford. Webb County remains the largest natural gas producer in the region.[2] |
| Eagle Ford Natural Gas Production Fourth Quarter 2023 |
||
|---|---|---|
| Cubic feet per day (billions) |
Year/year change (percent) |
|
| Eagle Ford counties | 7.6 | 11.6 |
| Rest of Texas | 27.2 | 7.4 |
| SOURCE: Energy Information Administration. | ||
| Top Natural Gas-Producing Counties in Eagle Ford Fourth Quarter 2023 |
||
|---|---|---|
| Cubic feet per day (billions) |
Year/year change (percent) |
|
| Webb | 2.9 | 5.8 |
| La Salle | 0.9 | 7.2 |
| Karnes | 0.8 | 2.5 |
| SOURCES: Energy Information Administration; WellDatabase; calculations by Federal Reserve Bank of Dallas. |
||
Notes
- Overall production for the Eagle Ford comes directly from the Energy Information Administration's Drilling Productivity Report.
- Data from the Energy Information Administration's Drilling Productivity Report is combined with county-level production data from the Railroad Commission of Texas to estimate county-level production. For more information on how these series are computed, see Energy Data Explanatory Notes and Resources.
| Highlights |
|---|
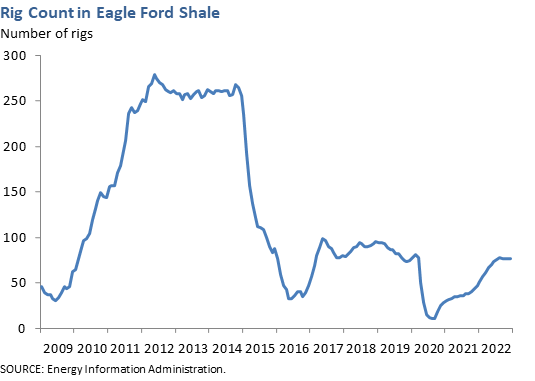
The rig count in the Eagle Ford increased steadily from mid-2009 to mid-2012. In June 2009, only 30 rigs operated in the Eagle Ford; by June 2012, the number of active rigs had soared to 312. The rig count leveled off in mid 2012, hovering between 280 and 310 rigs until December 2014, when the number of rigs began to decrease in response to falling oil prices. |
| Rig Count December 2023 |
||
|---|---|---|
| Number of rigs | Year/year change (percent) |
|
| Eagle Ford counties | 55 | –27.6 |
| Rest of Texas | 252 | –14.6 |
| SOURCE: Baker Hughes. | ||
| Highlights |
|---|
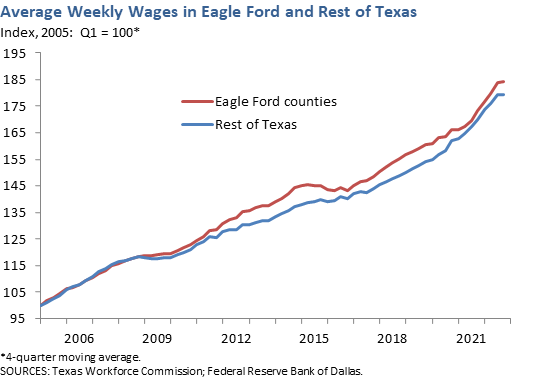
Employment growth in some Eagle Ford counties exceeded 10 percent per year from 2010 to 2014. However, growth slowed after 2014. While wages in the rural counties of Eagle Ford remain lower than in the rest of Texas, their growth is robust. In most counties in the region, annualized wage growth has surpassed that in the rest of the state since first quarter 2010. |
| Employment Fourth Quarter 2023 |
||
|---|---|---|
| Employment (thousands) |
Year/year change (percent) |
|
| Texas | ||
| Eagle Ford counties | 391.8 | 2.4 |
| Rest of Texas | 13,502.7 | 2.4 |
| SOURCE: Bureau of Labor Statistics. | ||

| Wages Fourth Quarter 2023 |
||
|---|---|---|
| Average weekly wage (dollars) | Year/year change (percent) |
|
| Texas | ||
| Eagle Ford counties | $1,024 | 3.1 |
| Rest of Texas | $1,439 | 4.0 |
| SOURCE: Bureau of Labor Statistics. | ||
- Energy Data Explanatory Notes and Resources
Describes the methodology used to compute production for counties in the Eagle Ford. - Spotlight: Oil Patch Productivity Rises; Jobs Vanish, Southwest Economy, Second Quarter 2021.
- Producers, Refiners View Strategies to Trim Texas’ Glut of Ultralight Condensate Oil, Southwest Economy, Fourth Quarter 2014.
- South Texas County Hopes to See Lasting Gains from Eagle Ford Shale Oil Boom: A Conversation with Joel Rodriguez, Southwest Economy, Third Quarter 2014
- Oil Boom in Eagle Ford Shale Brings New Wealth to South Texas, Southwest Economy, Second Quarter 2012.
An article by Dallas Fed economists exploring the economic gains from production growth across the region. - Energy Information Administration Drilling Productivity Report
Monthly estimates of oil and gas production for the Eagle Ford and other U.S. shale plays.