Dallas Fed Energy Survey

Third Quarter | September 23, 2020
Contraction Continues in Oil and Gas Sector but Pace of Decline Has Moderated
What’s New This Quarter
Special questions this quarter focus on OPEC’s role in determining oil prices going forward, whether U.S. crude oil production has peaked, upstream firms’ primary goals for the coming six months, and what price is needed to see a substantial increase in the oil rig count and the completion of drilled but uncompleted wells.
Activity in the oil and gas sector declined modestly in third quarter 2020, according to oil and gas executives responding to the Dallas Fed Energy Survey. The business activity index—the survey’s broadest measure of conditions facing Eleventh District energy firms—remained in negative territory but improved from -66.1 in the second quarter to -6.6 in the third quarter, suggesting that the pace of the contraction has significantly lessened.
Production indexes rose significantly but remained negative, suggesting a moderation in production declines. According to exploration and production (E&P) executives, the oil production index rose from -62.6 in the second quarter to -15.4 in the third. The natural gas production index increased 38 points to -10.1.
The index for capital expenditures for E&P firms increased from -66.1 in the second quarter to -16.4 in the third, indicating a less-severe reduction in capital spending. This means that expenditures are declining but not as much as before. Additionally, the index for capital expenditures for oilfield services firms increased from -73.5 to -35.1.
Conditions among oilfield services firms continued to deteriorate, albeit at a slower rate. The equipment utilization index jumped 50 points to -18.9 in the third quarter, implying utilization declined but at a much slower pace than over the prior quarter. The operating margins index increased from -68.6 to -30.8. The index of prices received for services also remained in negative territory but moved up, from -64.7 to -26.4. Firms found some relief as the input costs continued to decline; the index was -9.5 this quarter.
Labor-related indicators fell again, but at a more modest pace than last quarter. The aggregate employment index posted a sixth consecutive negative reading but moved up from -46.1 to -18.1. Additionally, the index of aggregate employee hours worked increased from -47.0 to -15.3. The index for aggregate wages and benefits remained in negative territory but rose from -41.7 to -19.4.
The company outlook index returned to barely positive territory in the third quarter, coming in at 1.9. The near-zero reading indicates the outlook remained relatively unchanged, a stabilization from the sharp deterioration seen over the prior two quarters. Additionally, fewer firms noted rising uncertainty this quarter than last, and the aggregate uncertainty index fell 19 points to 17.2.
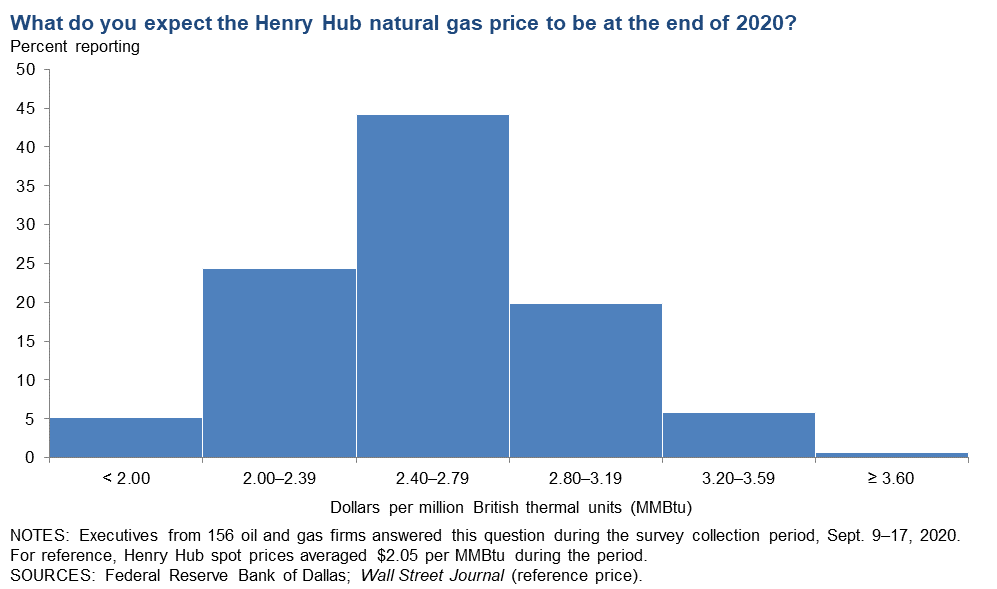
On average, respondents expect a West Texas Intermediate (WTI) oil price of $43.27 per barrel by year-end 2020, with responses ranging from $30 to $60 per barrel. Survey participants expect Henry Hub natural gas prices to be $2.55 per million British thermal units (MMBtu) by year-end. For reference, WTI spot prices averaged $38.47 per barrel during the survey collection period, and Henry Hub spot prices averaged $2.05 per MMBtu.
Next release: December 30, 2020
|
Data were collected on Sept. 9–17, and 166 energy firms responded. Of the respondents, 112 were exploration and production firms and 54 were oilfield services firms. The Dallas Fed conducts the Dallas Fed Energy Survey quarterly to obtain a timely assessment of energy activity among oil and gas firms located or headquartered in the Eleventh District. Firms are asked whether business activity, employment, capital expenditures and other indicators increased, decreased or remained unchanged compared with the prior quarter and with the same quarter a year ago. Survey responses are used to calculate an index for each indicator. Each index is calculated by subtracting the percentage of respondents reporting a decrease from the percentage reporting an increase. When the share of firms reporting an increase exceeds the share reporting a decrease, the index will be greater than zero, suggesting the indicator has increased over the previous quarter. If the share of firms reporting a decrease exceeds the share reporting an increase, the index will be below zero, suggesting the indicator has decreased over the previous quarter. |
Third Quarter | September 23, 2020
Price Forecasts
West Texas Intermediate Crude

| West Texas Intermediate crude oil price (dollars per barrel), year-end 2020 | ||||
| Indicator | Survey Average | Low Forecast | High Forecast | Price During Survey |
Current quarter | $43.27 | $30.00 | $60.00 | $38.47 |
Prior quarter | $42.11 | $22.00 | $65.00 | $37.75 |
| NOTE: Price during survey is an average of daily spot prices during the survey collection period. SOURCES: Energy Information Administration; Federal Reserve Bank of Dallas. | ||||
Henry Hub Natural Gas
| Henry Hub natural gas price (dollars per MMBtu), year-end 2020 | ||||
| Indicator | Survey Average | Low Forecast | High Forecast | Price During Survey |
Current quarter | $2.55 | $1.50 | $4.00 | $2.05 |
Prior quarter | $2.15 | $1.25 | $3.50 | $1.61 |
| NOTE: Price during survey is an average of daily spot prices during the survey collection period. SOURCES: Federal Reserve Bank of Dallas; Wall Street Journal. | ||||
Third Quarter | September 23, 2020
Special Questions
Data were collected Sept. 9–17; 164 oil and gas firms responded to the special questions survey.
All Firms
Do you believe that OPEC will play a bigger role in the determination of the price of oil going forward?
The majority of the executives—74 percent—said they believe OPEC will play a bigger role in the determination of the price of oil going forward. Twenty-six percent do not believe OPEC will play a bigger role.

Do you believe that U.S. oil production has peaked?
Most executives—66 percent—said they believe U.S. oil production has peaked. The remaining 34 percent do not believe U.S. oil production has peaked.

Exploration and Production (E&P) Firms
Which of the following is your firm’s primary goal over the next six months?
Executives from E&P firms were presented with eight potential goals for the next six months and asked to select their firm’s primary goal from the list. Responses were quite varied. Nineteen percent of executives selected “maintain production” as the primary goal over the next six months. The options “grow production,” “find additional sources of capital” and “reduce debt” were each selected by 16 percent of executives. Other options each received 12 percent or less. The responses were markedly different than what was observed when a similar question was asked in fourth quarter 2018 regarding E&P’s goal for 2019, in which the top response was “grow production.”

Oil and Gas Support Services Firms
Which of the following is your firm’s primary goal over the next six months?
Executives from oil and gas support services firms were presented with eight potential goals for the next six months and asked to select their firm’s primary goal from the list. Thirty-one percent of executives selected “grow business activity” as the primary goal. A total of 28 percent chose “maintain business activity” and 11 percent indicated “reduce costs” and “other.” Other options each received seven percent or less.

All Firms
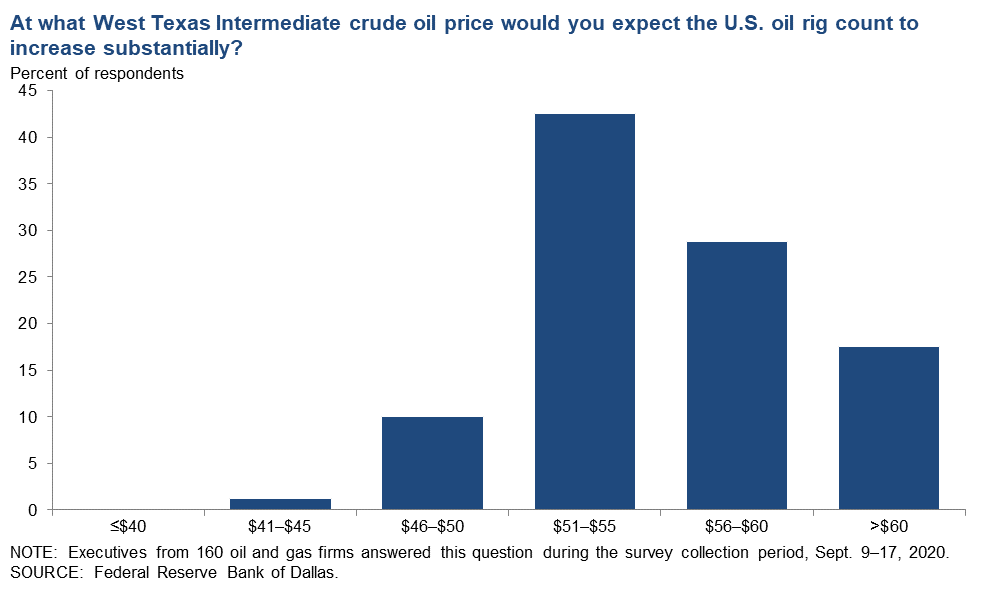
At what West Texas Intermediate crude oil price would you expect the U.S. oil rig count to increase substantially?
Forty-three percent of executives said they expect the U.S. oil rig count to increase substantially if oil prices were $51–$55 per barrel. Twenty-nine percent of executives anticipate the U.S. oil rig count would increase substantially if oil prices were $56–$60 per barrel. Eighteen percent believe the rig count would increase substantially if prices were above $60 a barrel, while 11 percent believe the rig count would rise with prices at or below $50. (Percentages don’t sum to 100 due to rounding.)

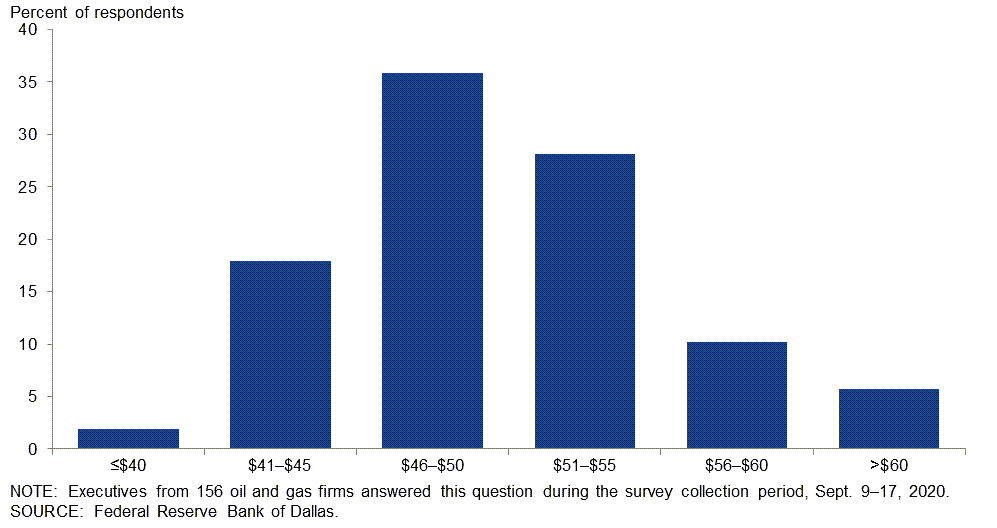
At what West Texas Intermediate crude oil price would you expect a substantial increase in completions of drilled but uncompleted wells (DUCs)?
Thirty-six percent of executives said they expect a substantial increase in the completion of DUCs if oil prices were $46–$50 per barrel. Twenty-eight percent of executives expect a substantial increase if oil prices were $51–$55 per barrel. Eighteen percent believe if oil prices were $41–$45 a barrel, there would be a substantial increase, while 16 percent believe if the price of oil were at or above $56 there would be a substantial increase. Two percent expect a substantial increase at below $40 a barrel.
Special Questions Comments
Exploration and Production Firms
- Each of the oil price answers should be $5 per barrel higher, but operators aren't going to wait as they try to offset production declines, particularly those that have redetermined credit facilities.
- The global oil suppliers of the world (OPEC, Russia, shale producers) have enough oil to bring to market in the $40 to $50 per barrel range. Only the most fit operators and service companies will survive, especially in the U.S. oil patch.
- Sustained oil prices of $50 per barrel would kick things off again.
- Oil prices are currently too low to sustain replacement drilling. This is by design I suspect. There will be no recovery as long as oil demand remains depressed.
- A Biden administration would wreak havoc on our industry—way worse than OPEC. It would put us out of business. We could not survive a Green New Deal.
- Once global oil demand has returned to 100-plus million barrels per day after the economy opens post-vaccine implementation (maybe late 2021), oil supply will not be able to meet the oil demand. This will cause inventories to decline, and the price of oil will overshoot global equilibrium (the oil price where the developing economies can grow, and exploration and development investments will be made, in the $50 to $60 per barrel West Texas Intermediate range), disrupting global economic growth. Thus, the vicious boom/bust cycle in the oil industry will continue in 2022–24 as oil companies overinvest, while demand is being destroyed due to high oil prices (greater than $70 per barrel).
- Lots of undeclared bankruptcies are still in the pipeline in the shale plays. As production drops due to the decline rates for shale, cash flows will demand bankruptcy. Private equity is not going to save the day for them. Merger and acquisition will happen as a Band-Aid.
- OPEC has total control over the price fluctuation due to the production curtailments they have agreed to. Since their curtailment went down to 7.7 million barrels per day, it has affected the price of oil due to the glut that is created worldwide. OPEC meets on Sept. 17, and it will be interesting to see what they propose. The lockdown due to COVID-19 has been detrimental to our country. It has devastated businesses, tourism, restaurants, and many layoffs have occurred. The lockdown needs to be lifted so we can get back to work and create a positive environment for our citizens.
- In addition to uncertainty surrounding the health pandemic, we are in a period of energy transition away from fossil fuels. Going forward, large investment pools of capital will not invest in petroleum. I have lived through several industry booms and busts, but this one is different. I am afraid that only large oil companies with diverse sources of capital will survive. Dividends from one of the major international oil companies are one source of family income, and I am very concerned about the company making a substantial dividend reduction.
Oil and Gas Support Services Firms
- Cash flow is too low, and debt is too high for the majority of oil and gas players in the U.S. Nobody is getting fired for delaying drilling or completion work, as cash is king.
Additional Comments »
Third Quarter | September 23, 2020
Historical data are available from first quarter 2016 to the most current release quarter.
Business Indicators: Quarter/Quarter
| Business Indicators: All Firms Current Quarter (versus previous quarter) | |||||
| Indicator | Current Index | Previous Index | % Reporting Increase | % Reporting No Change | % Reporting Decrease |
Level of Business Activity | –6.6 | –66.1 | 27.3 | 38.8 | 33.9 |
Capital Expenditures | –22.6 | –68.5 | 18.3 | 40.9 | 40.9 |
Supplier Delivery Time | –11.2 | –17.8 | 6.2 | 76.4 | 17.4 |
Employment | –18.1 | –46.1 | 9.0 | 63.9 | 27.1 |
Employee Hours | –15.3 | –47.0 | 14.0 | 56.7 | 29.3 |
Wages and Benefits | –19.4 | –41.7 | 4.8 | 70.9 | 24.2 |
| Indicator | Current Index | Previous Index | % Reporting Improved | % Reporting No Change | % Reporting Worsened |
Company Outlook | 1.9 | –51.0 | 31.8 | 38.2 | 29.9 |
| Indicator | Current Index | Previous Index | % Reporting Increase | % Reporting No Change | % Reporting Decrease |
Uncertainty | 17.2 | 35.7 | 37.4 | 42.3 | 20.2 |
| Business Indicators: E&P Firms Current Quarter (versus previous quarter) | |||||
| Indicator | Current Index | Previous Index | % Reporting Increase | % Reporting No Change | % Reporting Decrease |
Level of Business Activity | –9.9 | –62.6 | 23.4 | 43.2 | 33.3 |
Oil Production | –15.4 | –62.6 | 25.5 | 33.6 | 40.9 |
Natural Gas Wellhead Production | –10.1 | –47.8 | 24.8 | 40.4 | 34.9 |
Capital Expenditures | –16.4 | –66.1 | 20.9 | 41.8 | 37.3 |
Expected Level of Capital Expenditures Next Year | –9.0 | –54.4 | 26.1 | 38.7 | 35.1 |
Supplier Delivery Time | –13.9 | –13.4 | 4.6 | 76.9 | 18.5 |
Employment | –23.2 | –40.3 | 1.8 | 73.2 | 25.0 |
Employee Hours | –19.8 | –38.9 | 7.2 | 65.8 | 27.0 |
Wages and Benefits | –19.6 | –38.2 | 2.7 | 75.0 | 22.3 |
Finding and Development Costs | –32.8 | –42.4 | 2.7 | 61.8 | 35.5 |
Lease Operating Expenses | –27.5 | –54.4 | 6.4 | 59.6 | 33.9 |
| Indicator | Current Index | Previous Index | % Reporting Improved | % Reporting No Change | % Reporting Worsened |
Company Outlook | 9.6 | –45.8 | 34.6 | 40.4 | 25.0 |
| Indicator | Current Index | Previous Index | % Reporting Increase | % Reporting No Change | % Reporting Decrease |
Uncertainty | 22.1 | 32.2 | 40.4 | 41.3 | 18.3 |
| Business Indicators: O&G Support Services Firms Current Quarter (versus previous quarter) | |||||
| Indicator | Current Index | Previous Index | % Reporting Increase | % Reporting No Change | % Reporting Decrease |
Level of Business Activity | 0.0 | –73.5 | 35.2 | 29.6 | 35.2 |
Utilization of Equipment | –18.9 | –69.2 | 26.4 | 28.3 | 45.3 |
Capital Expenditures | –35.1 | –73.5 | 13.0 | 38.9 | 48.1 |
Supplier Delivery Time | –5.7 | –27.5 | 9.4 | 75.5 | 15.1 |
Lag Time in Delivery of Firm's Services | –9.4 | –21.1 | 5.7 | 79.2 | 15.1 |
Employment | –7.4 | –58.5 | 24.1 | 44.4 | 31.5 |
Employment Hours | –5.7 | –64.2 | 28.3 | 37.7 | 34.0 |
Wages and Benefits | –18.9 | –49.0 | 9.4 | 62.3 | 28.3 |
Input Costs | –9.5 | –50.0 | 9.4 | 71.7 | 18.9 |
Prices Received for Services | –26.4 | –64.7 | 9.4 | 54.7 | 35.8 |
Operating Margin | –30.8 | –68.6 | 15.4 | 38.5 | 46.2 |
| Indicator | Current Index | Previous Index | % Reporting Improved | % Reporting No Change | % Reporting Worsened |
Company Outlook | –13.2 | –61.6 | 26.4 | 34.0 | 39.6 |
| Indicator | Current Index | Previous Index | % Reporting Increase | % Reporting No Change | % Reporting Decrease |
Uncertainty | 7.4 | 43.4 | 31.5 | 44.4 | 24.1 |
Business Indicators: Year/Year
| Business Indicators: All Firms Current Quarter (versus same quarter a year ago) | |||||
| Indicator | Current Index | Previous Index | % Reporting Increase | % Reporting No Change | % Reporting Decrease |
Level of Business Activity | –77.3 | –81.1 | 3.7 | 15.3 | 81.0 |
Capital Expenditures | –70.0 | –79.0 | 5.6 | 18.8 | 75.6 |
Supplier Delivery Time | –21.6 | –25.0 | 8.3 | 61.8 | 29.9 |
Employment | –53.3 | –52.4 | 2.5 | 41.7 | 55.8 |
Employee Hours | –47.5 | –54.9 | 4.4 | 43.8 | 51.9 |
Wages and Benefits | –43.8 | –39.0 | 6.8 | 42.6 | 50.6 |
| Indicator | Current Index | Previous Index | % Reporting Improved | % Reporting No Change | % Reporting Worsened |
Company Outlook | –60.2 | –76.5 | 12.8 | 14.2 | 73.0 |
| Business Indicators: E&P Firms Current Quarter (versus same quarter a year ago) | |||||
| Indicator | Current Index | Previous Index | % Reporting Increase | % Reporting No Change | % Reporting Decrease |
Level of Business Activity | –74.3 | –77.8 | 4.6 | 16.5 | 78.9 |
Oil Production | –53.3 | –62.8 | 12.1 | 22.4 | 65.4 |
Natural Gas Wellhead Production | –40.5 | –52.6 | 17.0 | 25.5 | 57.5 |
Capital Expenditures | –68.9 | –75.9 | 6.6 | 17.9 | 75.5 |
Expected Level of Capital Expenditures Next Year | –52.4 | –70.0 | 12.4 | 22.9 | 64.8 |
Supplier Delivery Time | –18.1 | –20.7 | 7.6 | 66.7 | 25.7 |
Employment | –44.0 | –46.0 | 3.7 | 48.6 | 47.7 |
Employee Hours | –32.7 | –46.9 | 5.6 | 56.1 | 38.3 |
Wages and Benefits | –37.0 | –30.1 | 7.4 | 48.1 | 44.4 |
Finding and Development Costs | –53.8 | –52.7 | 1.0 | 44.2 | 54.8 |
Lease Operating Expenses | –47.6 | –60.0 | 4.8 | 42.9 | 52.4 |
| Indicator | Current Index | Previous Index | % Reporting Improved | % Reporting No Change | % Reporting Worsened |
Company Outlook | –52.6 | –70.9 | 16.5 | 14.4 | 69.1 |
| Business Indicators: O&G Support Services Firms Current Quarter (versus same quarter a year ago) | |||||
| Indicator | Current Index | Previous Index | % Reporting Increase | % Reporting No Change | % Reporting Decrease |
Level of Business Activity | –83.3 | –88.3 | 1.9 | 13.0 | 85.2 |
Utilization of Equipment | –86.8 | –81.6 | 1.9 | 9.4 | 88.7 |
Capital Expenditures | –72.2 | –86.0 | 3.7 | 20.4 | 75.9 |
Supplier Delivery Time | –28.9 | –34.7 | 9.6 | 51.9 | 38.5 |
Lag Time in Delivery of Firm's Services | –35.8 | –34.0 | 0.0 | 64.2 | 35.8 |
Employment | –72.2 | –66.7 | 0.0 | 27.8 | 72.2 |
Employment Hours | –77.3 | –72.6 | 1.9 | 18.9 | 79.2 |
Wages and Benefits | –57.4 | –58.8 | 5.6 | 31.5 | 63.0 |
Input Costs | –42.3 | –65.3 | 7.7 | 42.3 | 50.0 |
Prices Received for Services | –71.7 | –71.5 | 3.8 | 20.8 | 75.5 |
Operating Margin | –76.4 | –81.6 | 2.0 | 19.6 | 78.4 |
| Indicator | Current Index | Previous Index | % Reporting Improved | % Reporting No Change | % Reporting Worsened |
Company Outlook | –74.5 | –88.0 | 5.9 | 13.7 | 80.4 |
Third Quarter | September 23, 2020
Activity Chart

Third Quarter | September 23, 2020
Comments from Survey Respondents
These comments are from respondents’ completed surveys and have been edited for publication. Comments from the Special Questions survey can be found below the special questions.
Exploration and Production (E&P) Firms
- We are in terribly uncertain times. The current drop in oil prices is very unsettling as far as what to expect going forward. The November election could severely impair the long-term success of my business if Biden is elected.
- We are fully hedged, but liquidity with the banks through our reserved-based loan continues to be our greatest concern along with a double-dip recession should COVID-19 surge again and a federal government-mandated shutdown be required.
- The following are key points affecting our business. First, survival of the fittest is on display in the industry. Second, everyone in the industry needs to operate with an "owner" mindset to survive, adapt and evolve. This includes engineers, business professionals, field hands and company management. Third, the service sector is taking dramatic steps to conserve cash and cut costs and is passing those cuts along to the industry. This is critical for industry health and survivability.
- We are anxiously awaiting the fall redeterminations for shale players. We believe strongly that banks and operators will have to face reality, which will lead to widespread bankruptcies and asset sales. Banks will likely recover less than 35 cents of each $1 loaned.
- Although drilling costs are down, so is the price of crude oil. It is getting harder to forecast revenue due to the fluctuation in oil prices.
- The poor management by the president and Senate is causing remarkable issues affecting business decisions and management. The Fed [Federal Reserve], using aggressively low interest rates, has managed to temporarily prop up Wall Street, but this is not helping the underlying issues of the country and is not helpful for the average worker, the rank and file, or small companies. I am significantly more discouraged than in previous quarters due to the demonstrated lack of real concern and the lack of effective leadership by this president, his advisers and the Senate.
- Multiple market forces arising from the COVID-19 virus continue to severely impact our business. Excess oil supply continues to hold the oil price around $40 per barrel. Location bias results in a $6 to $10 per barrel discount from the posted price for most of our oil production. Such a price discourages actual drilling, and for select stripper wells, it is insufficient to cover lifting and marketing expense. Two large oilfield services firms have closed many of their service locations in North America, which will greatly increase future mobilization service fees, perhaps to a prohibitive level. These closures are devastating to the economy of local communities, causing the permanent loss of skilled workers. The outcome of the upcoming presidential election is uncertain and damping enthusiasm for investment.
- The movement of the supply chain, specifically services that require some form of manufacturing before delivery, is impacting our business. These processes are clearly slower and have impacted the predictive value of our budget/business projects in 2020. Decision-making on smaller issues within the company, due to less-efficient communication from being outside the office environment, has been difficult.
- The weakened oil demand is affecting our outlook.
- Our production in Orange County, Texas, and Calcasieu Parish, Louisiana, was shut in two weeks or more as a result of the hurricane.
- COVID-19-related issues continue to foster a pessimistic outlook regarding a recovering economy.
- Oil and gas price differentials are still a problem. Operator solvency questions are starting to worry us. The increased post-production costs for natural gas sales are becoming more problematic.
- The improved natural gas price is a significant plus for onshore U.S. conventional oil and gas companies like us.
- A Biden administration would absolutely kill our industry.
- The outcome of the election is affecting our business. We feel strongly Trump will win. But who controls the House and Senate is a big factor. COVID-19 vaccine to end the shutdown is a factor. China is a factor. Printing our money to boost inflation will help commodities’ prices. There are many unknowns still to be realized.
- The presidential election will dictate oil and gas activity.
- COVID-19 reduced oil demand and created uncertainty in oil consumption forecasts. Political uncertainty is a huge driver of oil market uncertainty. Capital expenditure investments are scheduled to decline until market indicators show recovery from COVID-19 and overproduction. Storage capacities are being challenged due to less oil demand.
Oil and Gas Support Services Firms
- What more could possibly go wrong? We should stop asking, for something else seems to pop up when we do.
- I have no clue what to guess the future numbers will be.
- It looks like the bottom has been reached for oilfield service activity. However, activity for the balance of the year will be a slow improvement. All eyes are now on 2021.
- Activity is picking up, which is obviously great. The problem is that hiring field/labor-type employees is getting very tough. They do not want to go back to work because of concern over losing their unemployment benefits. I understand that everyone has to provide for their family and make the best possible decisions personally to do so. The CARES [Coronavirus Aid, Relief and Economic Security] Act, with regard to unemployment, is making it more beneficial for people to sit at home and do nothing versus going to work to earn. So, the people that stayed and worked are having to carry a heavier load, for even money, since those sitting at the house refuse to show up. This is a very slippery slope for blue-collar employers.
- Demand for services is increasing, but an oversupplied market is creating a low pricing environment with high competition for services. There is more work, but pricing is flat for the foreseeable future as input costs increase.
- Our business is being affected by political and regulatory uncertainty.
- Investor sentiment remains very negative for our industry. The debt and equity capital markets are quite negative. There are no merger and acquisition markets to speak of. The situation remains dire.
- With the uncertainty related to commodity prices and related activity levels, we are controlling what we can. This is primarily related to costs, and this is being done through head count reduction, facility closures and reducing working capital.
- Interest in onshore seismic is at a multidecade low.
- We are relying on the Middle East for new business. The second quarter saw good orders. Orders expected in early third quarter are still not here, as there is a 60–90-day delay. New sales leads have decreased compared with last year. Overall, we will do better than 2019 but less than our pre-COVID-19 budget.
- We are losing money hand over fist and desperately need the Federal Reserve Main Street Lending Program to survive.
- We have very little work going on. We are doing some small jobs in real estate but almost nothing in oil and gas land work.
Questions regarding the Dallas Fed Energy Survey can be addressed to Michael Plante at Michael.Plante@dal.frb.org or Kunal Patel at Kunal.Patel@dal.frb.org.
Sign up for our email alert to be automatically notified as soon as the latest Dallas Fed Energy Survey is released on the web.