Banking Conditions Survey

Loan Volumes Continue to Decline, Outlooks Worsen
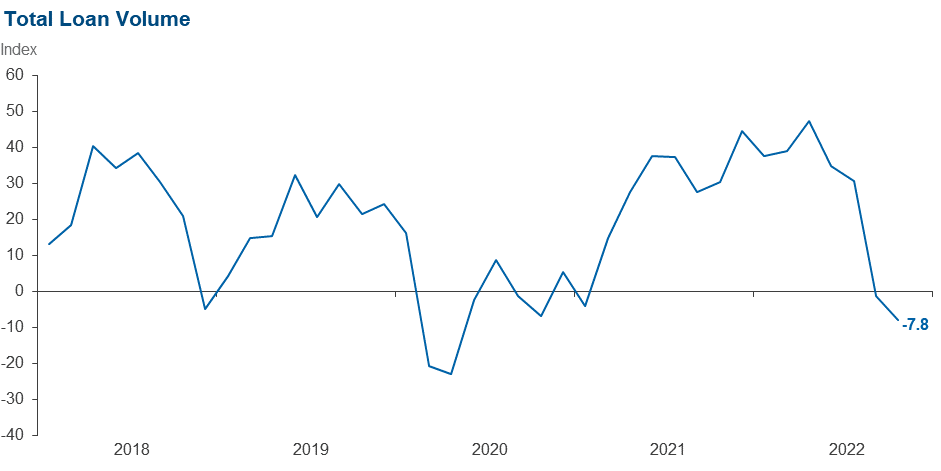
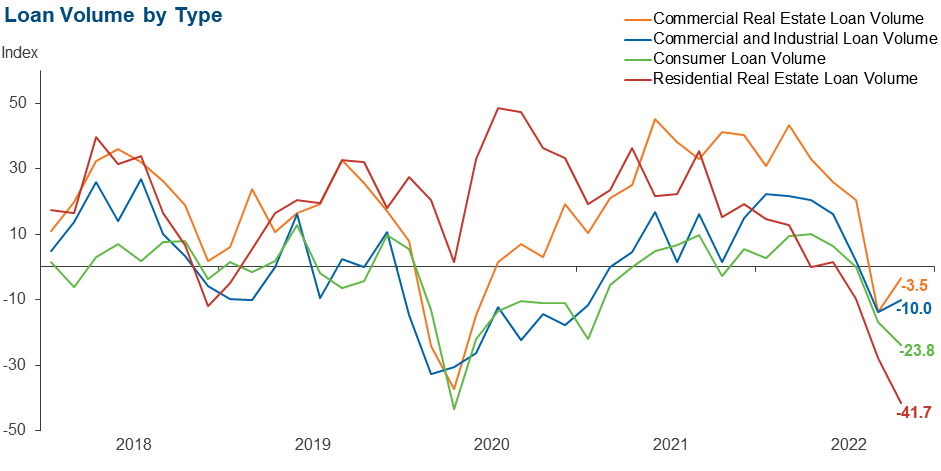
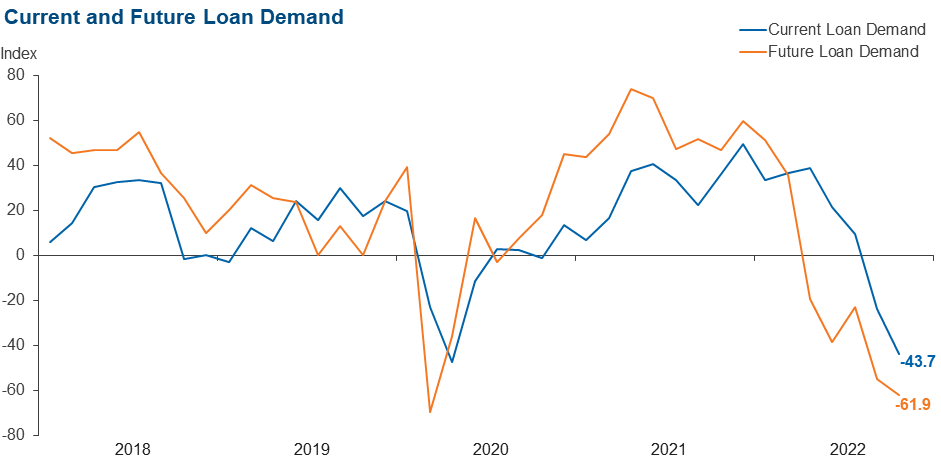
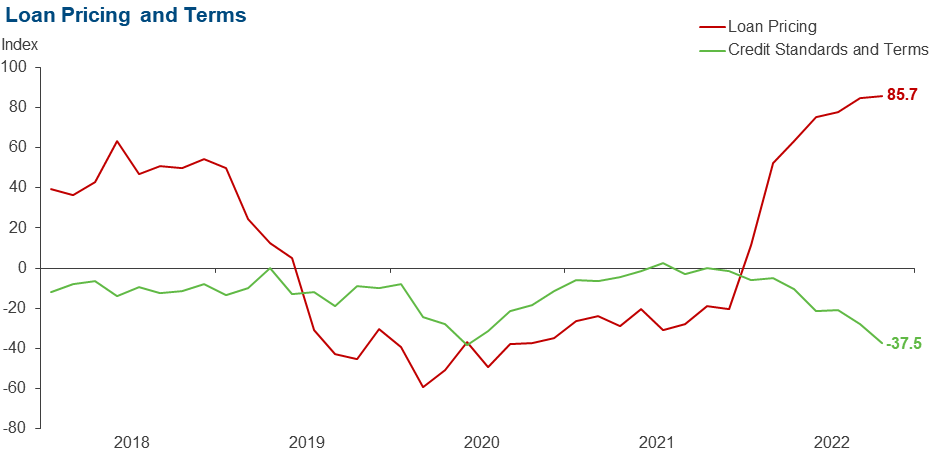
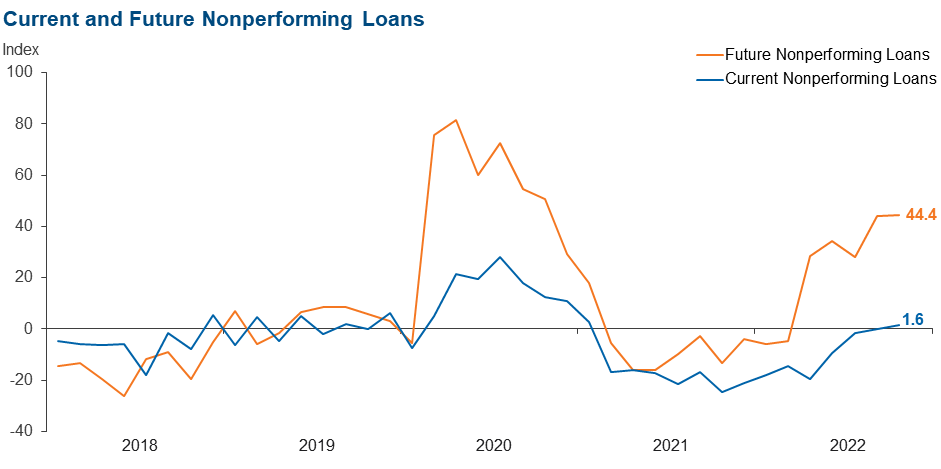
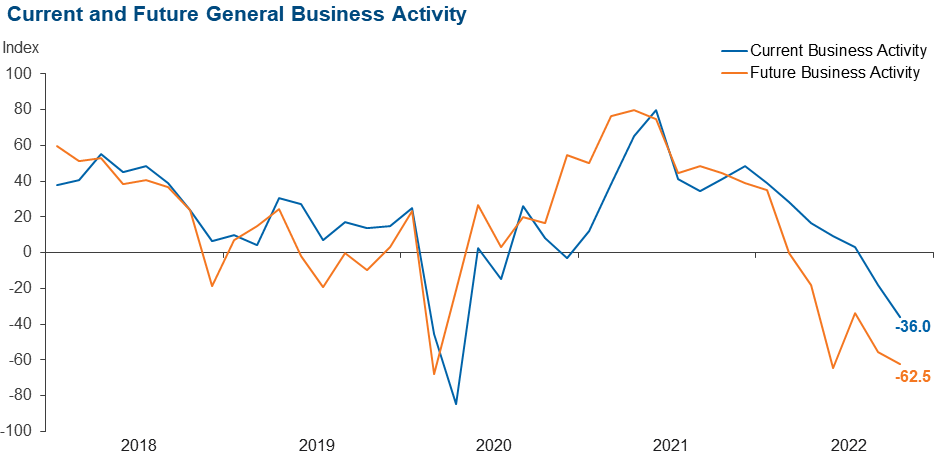
Loan volumes declined for a second period in a row, and loan demand fell sharply. Volume declines spanned all loan categories. Commercial real estate and commercial and industrial loan volume continued to decline but at slower rates than over the prior six weeks, while residential real estate and consumer loan volumes declined notably faster. Loan nonperformance remained largely unchanged. Contacts still overwhelmingly reported loan price increases, and credit standards and terms continued to tighten. Business activity experienced a greater decline over the past six weeks, and expectations for the next six months are for loan demand and business activity to decline further and loan nonperformance to increase.
Next release: January 3, 2023
Data were collected November 1–8, and 64 financial institutions responded to the survey. The Federal Reserve Bank of Dallas conducts the Banking Conditions Survey twice each quarter to obtain a timely assessment of activity at banks and credit unions headquartered in the Eleventh Federal Reserve District. CEOs or senior loan officers of financial institutions report on how conditions have changed for indicators such as loan volume, nonperforming loans and loan pricing. Respondents are also asked to report on their banking outlook and their evaluation of general business activity.
Survey responses are used to calculate an index for each indicator. Each index is calculated by subtracting the percentage of respondents reporting a decrease (or tightening) from the percentage reporting an increase (or easing). When the share of respondents reporting an increase exceeds the share reporting a decrease, the index will be greater than zero, suggesting the indicator has increased over the prior reporting period. If the share of respondents reporting a decrease exceeds the share reporting an increase, the index will be below zero, suggesting the indicator has decreased over the prior reporting period. An index will be zero when the number of respondents reporting an increase is equal to the number reporting a decrease.
Results Summary
Historical data are available from March 2017.
| Total Loans: Over the past six weeks, how have the following changed? | |||||
| Indicator | Current Index | Previous Index | % Reporting Increase | % Reporting No Change | % Reporting Decrease |
Loan volume | –7.8 | –1.4 | 39.1 | 14.1 | 46.9 |
Loan demand | –43.7 | –23.6 | 14.1 | 28.1 | 57.8 |
Nonperforming loans | 1.6 | 0.0 | 14.1 | 73.4 | 12.5 |
Loan pricing | 85.7 | 84.7 | 85.7 | 14.3 | 0.0 |
| Indicator | Current Index | Previous Index | % Reporting Eased | % Reporting No Change | % Reporting Tightened |
Credit standards and terms | –37.5 | –27.9 | 1.8 | 58.9 | 39.3 |
| Commercial and Industrial Loans: Over the past six weeks, how have the following changed? | |||||
| Indicator | Current Index | Previous Index | % Reporting Increase | % Reporting No Change | % Reporting Decrease |
Loan volume | –10.0 | –13.7 | 18.3 | 53.3 | 28.3 |
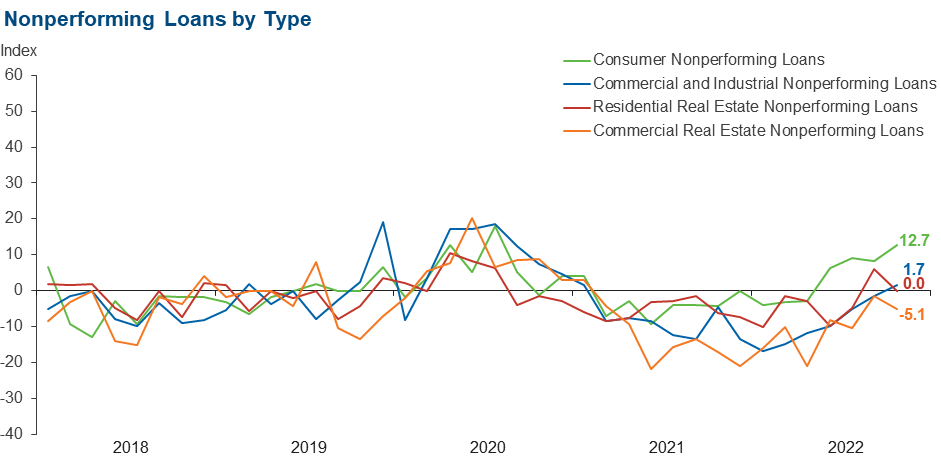
Nonperforming loans | 1.7 | –1.5 | 5.0 | 91.7 | 3.3 |
| Indicator | Current Index | Previous Index | % Reporting Eased | % Reporting No Change | % Reporting Tightened |
Credit standards and terms | –29.3 | –24.2 | 0.0 | 70.7 | 29.3 |
| Commercial Real Estate Loans: Over the past six weeks, how have the following changed? | |||||
| Indicator | Current Index | Previous Index | % Reporting Increase | % Reporting No Change | % Reporting Decrease |
Loan volume | –3.5 | –13.7 | 29.3 | 37.9 | 32.8 |
Nonperforming loans | –5.1 | –1.5 | 5.2 | 84.5 | 10.3 |
| Indicator | Current Index | Previous Index | % Reporting Eased | % Reporting No Change | % Reporting Tightened |
Credit standards and terms | –36.8 | –29.2 | 0.0 | 63.2 | 36.8 |
| Residential Real Estate Loans: Over the past six weeks, how have the following changed? | |||||
| Indicator | Current Index | Previous Index | % Reporting Increase | % Reporting No Change | % Reporting Decrease |
Loan volume | –41.7 | –27.9 | 18.3 | 21.7 | 60.0 |
Nonperforming loans | 0.0 | 6.1 | 5.0 | 90.0 | 5.0 |
| Indicator | Current Index | Previous Index | % Reporting Eased | % Reporting No Change | % Reporting Tightened |
Credit standards and terms | –20.0 | –11.7 | 0.0 | 80.0 | 20.0 |
| Consumer Loans: Over the past six weeks, how have the following changed? | |||||
| Indicator | Current Index | Previous Index | % Reporting Increase | % Reporting No Change | % Reporting Decrease |
Loan volume | –23.8 | –16.7 | 14.3 | 47.6 | 38.1 |
Nonperforming loans | 12.7 | 8.3 | 15.9 | 81.0 | 3.2 |
| Indicator | Current Index | Previous Index | % Reporting Eased | % Reporting No Change | % Reporting Tightened |
Credit standards and terms | –15.0 | –11.4 | 1.7 | 81.7 | 16.7 |
| Banking Outlook: What is your expectation for the following items six months from now? | |||||
| Indicator | Current Index | Previous Index | % Reporting Increase | % Reporting No Change | % Reporting Decrease |
Total loan demand | –61.9 | –54.9 | 9.5 | 19.0 | 71.4 |
Nonperforming loans | 44.4 | 44.2 | 49.2 | 46.0 | 4.8 |
| General Business Activity: What is your evaluation of the level of activity? | |||||
| Indicator | Current Index | Previous Index | % Reporting Better | % Reporting No Change | % Reporting Worse |
Over the past six weeks | –36.0 | –18.0 | 7.8 | 48.4 | 43.8 |
Six months from now | –62.5 | –55.6 | 9.4 | 18.8 | 71.9 |
Comments from Survey Respondents
Respondents were given an opportunity to comment on any issues that may be affecting their business.
These comments are from respondents’ completed surveys and have been edited for publication.
- The interest rate increases will have a moderately negative impact on general business conditions and, more specifically, on commercial real estate loans. Businesses have been able to raise prices, and commercial real estate owners have been able to raise rents to compensate, but it is unclear how long that can last. Supply concerns will continue to the extent they come from China, which appears to still be very vigilant about COVID.
- Rising rates [are an issue of concern].
- Many of our real estate loans are on a five-year fixed rate. The concern is whether the customers can afford the payment at increased rates.
- The last few months have seen a fairly dramatic impact of rising rates and inflation ... an impact on deposit flows (net inflows reversing to net outflows), a material decrease in real estate lending, and a modest increase in consumer credit risk. We are currently working on a 2023 business plan, with assumptions incredibly challenging to project with any degree of confidence because of the level of economic uncertainty.
- [We are concerned about] increasing regulation; for example, the CFPB [Consumer Financial Protection Bureau] rule related to nonsufficient funds and returned-deposit items.
- The economy appears to be slowing down, and the availability of excess liquidity seems to be tightening.
- As rates increase, we expect customers to have a harder time making payments as we adjust their payments on floating-rate loans to stay with their original amortization schedule. Loans we approved with a 1.35 debt-coverage ratio only six months ago may be at a 1.0 debt-coverage ratio today.
- Financial conditions have tightened materially, while economic conditions have worsened. Customers are planning for a downturn.
- [We are concerned] that regulators will overreact.
- One concern is that as the price of vehicles securing loans made over the last 12 months decreases, some people may walk away from their loans.
Historical Data
Historical data can be downloaded dating back to March 2017. For the definitions, see data definitions.
NOTE: The following series were discontinued in May 2020: volume of core deposits, cost of funds, non-interest income and net interest margin.
Questions regarding the Banking Conditions Survey can be addressed to Emily Kerr at emily.kerr@dal.frb.org.
Sign up for our email alert to be automatically notified as soon as the latest Banking Conditions Survey is released on the web.