Banking Conditions Survey

For this survey, Eleventh District banking executives were asked supplemental questions on outlook concerns, deposits and commercial real estate lending. Read the special questions results.
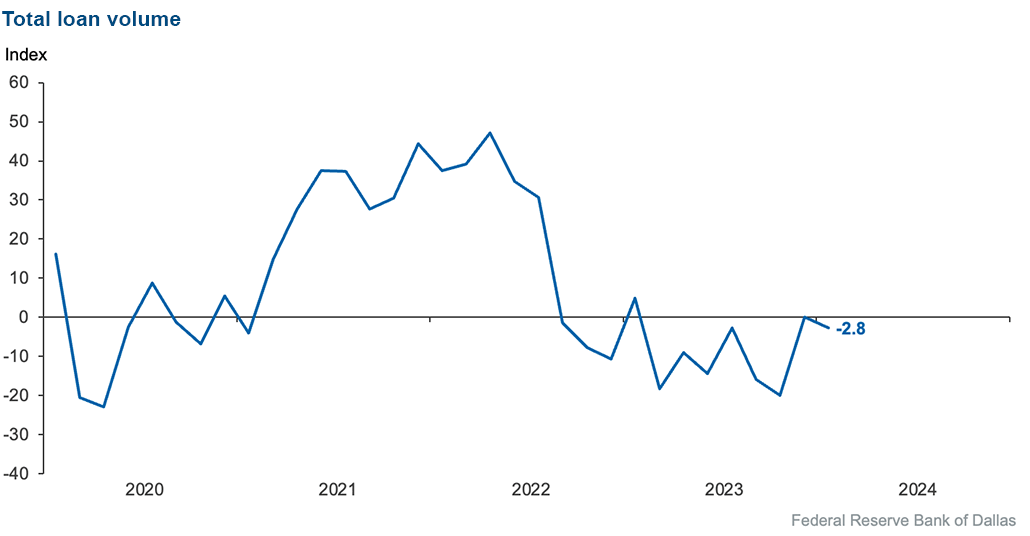
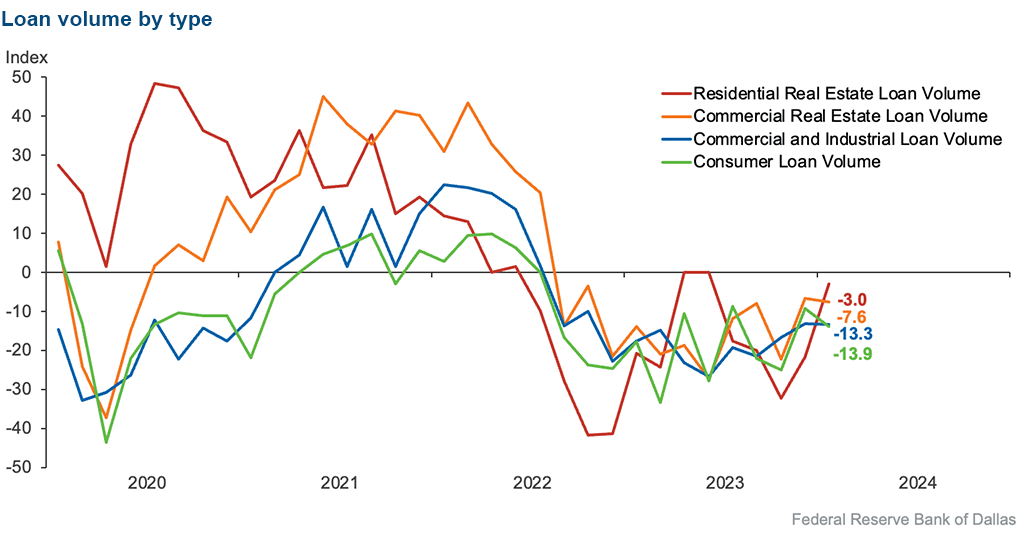
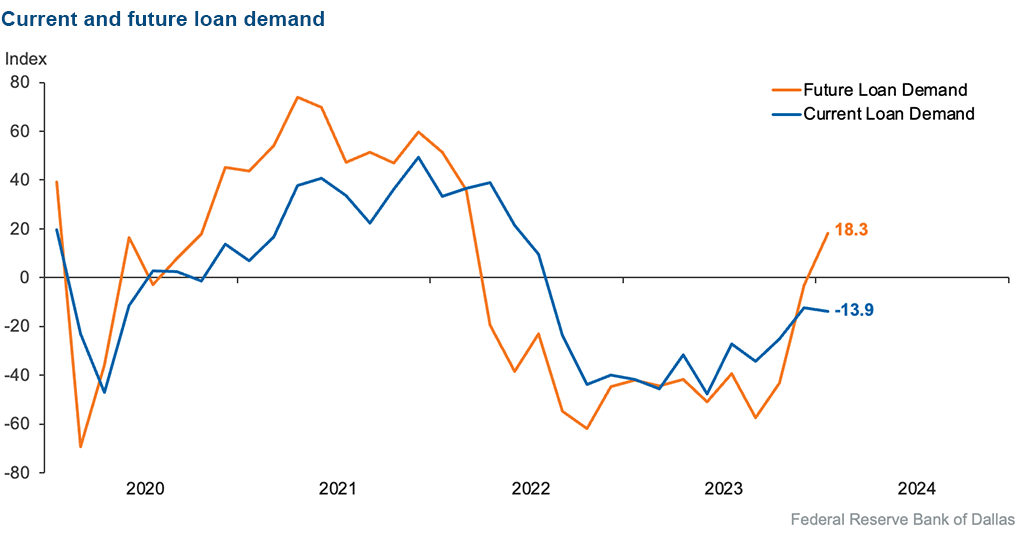
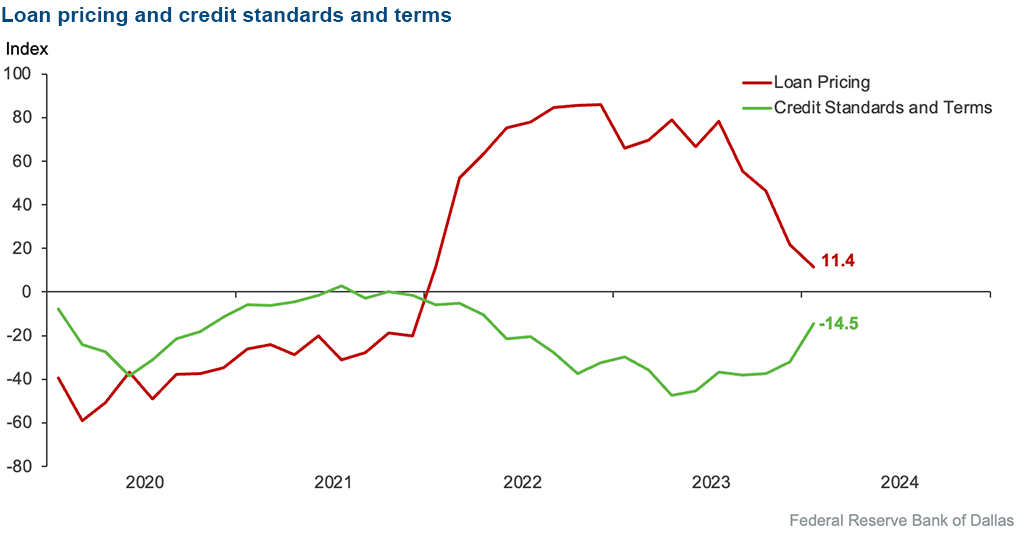
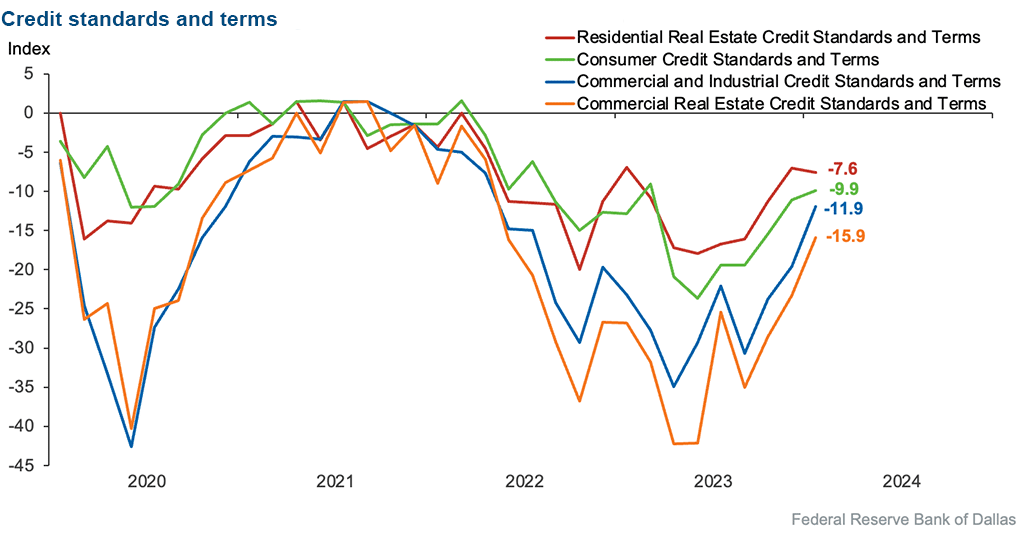
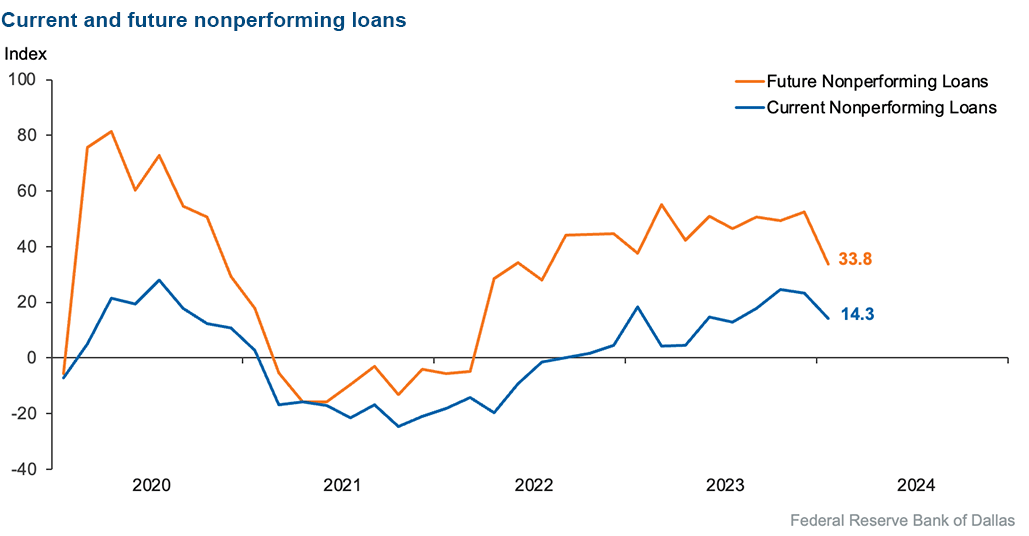
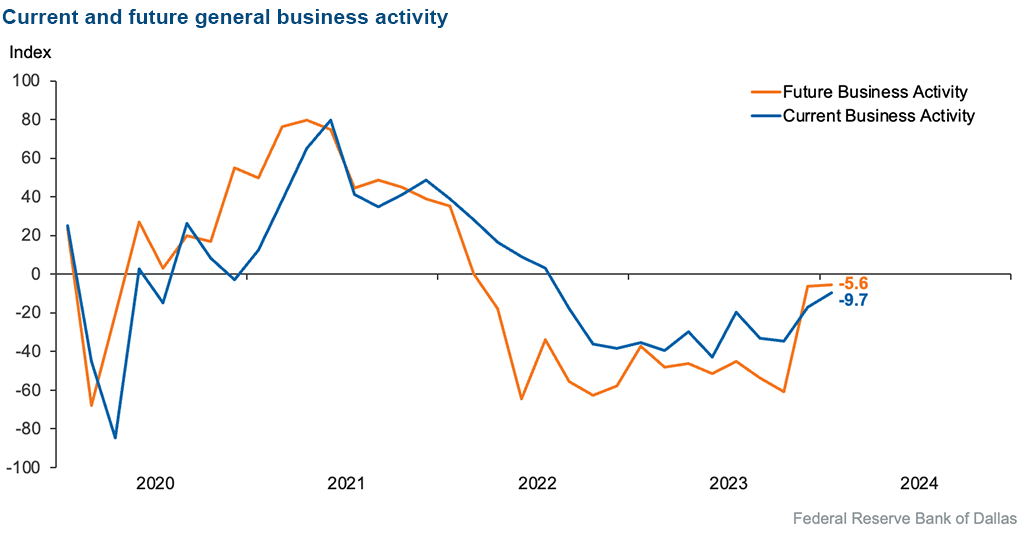
Loan volumes remained stable, with near-equal shares of bankers reporting an increase over the past six weeks as those reporting a decrease. While residential real estate loan volumes have been declining notably over the past six months, those declines abated in the latest survey. The pace of credit tightening continued to slow, particularly for commercial real estate and commercial and industrial loans. Loan demand continued to decline. Loan nonperformance and loan pricing rose but at a more moderate pace. Looking ahead, bankers’ outlooks are mixed: they expect stronger loan demand six months from now and more tempered declines in loan performance but further deterioration in overall business activity.
Next release: April 1, 2024
Data were collected February 6–14, and 72 financial institutions responded to the survey. The Federal Reserve Bank of Dallas conducts the Banking Conditions Survey twice each quarter to obtain a timely assessment of activity at banks and credit unions headquartered in the Eleventh Federal Reserve District. CEOs or senior loan officers of financial institutions report on how conditions have changed for indicators such as loan volume, nonperforming loans and loan pricing. Respondents are also asked to report on their banking outlook and their evaluation of general business activity.
Survey responses are used to calculate an index for each indicator. Each index is calculated by subtracting the percentage of respondents reporting a decrease (or tightening) from the percentage reporting an increase (or easing). When the share of respondents reporting an increase exceeds the share reporting a decrease, the index will be greater than zero, suggesting the indicator has increased over the prior reporting period. If the share of respondents reporting a decrease exceeds the share reporting an increase, the index will be below zero, suggesting the indicator has decreased over the prior reporting period. An index will be zero when the number of respondents reporting an increase is equal to the number reporting a decrease.
Results Summary
Historical data are available from March 2017.
| Total Loans: Over the past six weeks, how have the following changed? | |||||
| Indicator | Current Index | Previous Index | % Reporting Increase | % Reporting No Change | % Reporting Decrease |
Loan volume | –2.8 | 0.0 | 28.2 | 40.8 | 31.0 |
Loan demand | –13.9 | –12.5 | 23.6 | 38.9 | 37.5 |
Nonperforming loans | 14.3 | 23.4 | 28.6 | 57.1 | 14.3 |
Loan pricing | 11.4 | 21.9 | 20.0 | 71.4 | 8.6 |
| Indicator | Current Index | Previous Index | % Reporting Eased | % Reporting No Change | % Reporting Tightened |
Credit standards and terms | –14.5 | –32.2 | 0.0 | 85.5 | 14.5 |
| Commercial and Industrial Loans: Over the past six weeks, how have the following changed? | |||||
| Indicator | Current Index | Previous Index | % Reporting Increase | % Reporting No Change | % Reporting Decrease |
Loan volume | –13.3 | –13.1 | 8.8 | 69.1 | 22.1 |
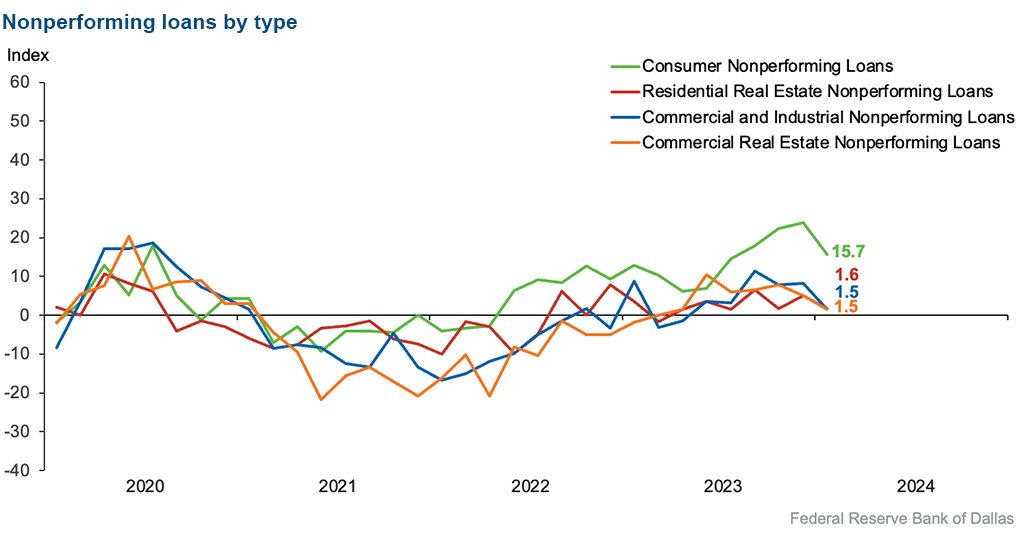
Nonperforming loans | 1.5 | 8.2 | 11.9 | 77.6 | 10.4 |
| Indicator | Current Index | Previous Index | % Reporting Eased | % Reporting No Change | % Reporting Tightened |
Credit standards and terms | –11.9 | –19.6 | 0.0 | 88.1 | 11.9 |
| Commercial Real Estate Loans: Over the past six weeks, how have the following changed? | |||||
| Indicator | Current Index | Previous Index | % Reporting Increase | % Reporting No Change | % Reporting Decrease |
Loan volume | –7.6 | –6.6 | 22.7 | 47.0 | 30.3 |
Nonperforming loans | 1.5 | 5.0 | 7.7 | 86.2 | 6.2 |
| Indicator | Current Index | Previous Index | % Reporting Eased | % Reporting No Change | % Reporting Tightened |
Credit standards and terms | –15.9 | –23.3 | 0.0 | 84.1 | 15.9 |
| Residential Real Estate Loans: Over the past six weeks, how have the following changed? | |||||
| Indicator | Current Index | Previous Index | % Reporting Increase | % Reporting No Change | % Reporting Decrease |
Loan volume | –3.0 | –21.7 | 19.4 | 58.2 | 22.4 |
Nonperforming loans | 1.6 | 5.1 | 6.1 | 89.4 | 4.5 |
| Indicator | Current Index | Previous Index | % Reporting Eased | % Reporting No Change | % Reporting Tightened |
Credit standards and terms | –7.6 | –7.0 | 0.0 | 92.4 | 7.6 |
| Consumer Loans: Over the past six weeks, how have the following changed? | |||||
| Indicator | Current Index | Previous Index | % Reporting Increase | % Reporting No Change | % Reporting Decrease |
Loan volume | –13.9 | –9.3 | 12.5 | 61.1 | 26.4 |
Nonperforming loans | 15.7 | 23.8 | 21.4 | 72.9 | 5.7 |
| Indicator | Current Index | Previous Index | % Reporting Eased | % Reporting No Change | % Reporting Tightened |
Credit standards and terms | –9.9 | –11.1 | 0.0 | 90.1 | 9.9 |
| Banking Outlook: What is your expectation for the following items six months from now? | |||||
| Indicator | Current Index | Previous Index | % Reporting Increase | % Reporting No Change | % Reporting Decrease |
Total loan demand | 18.3 | –3.1 | 40.8 | 36.6 | 22.5 |
Nonperforming loans | 33.8 | 52.4 | 45.1 | 43.7 | 11.3 |
| General Business Activity: What is your evaluation of the level of activity? | |||||
| Indicator | Current Index | Previous Index | % Reporting Better | % Reporting No Change | % Reporting Worse |
Over the past six weeks | –9.7 | –17.0 | 15.3 | 59.7 | 25.0 |
Six months from now | –5.6 | –6.1 | 31.0 | 32.4 | 36.6 |
Respondents were given an opportunity to comment on any issues that may be affecting their business.
These comments are from respondents’ completed surveys and have been edited for publication.
- The timing of the projected Federal Reserve pivot is majorly impacting business activity.
- Core deposits are beginning to stabilize. While we expect core deposits to remain flat for the year, we would not be surprised to see a modest decline in core deposit levels. We are beginning to see an increase in nonperforming consumer loans.
- Overnight borrowing is a big concern. Deposit rates need to drop.
- We are now seeing consumers losing jobs and not being able to find new ones.
- The discussion about a stabilization of interest rates with possible rate decreases down the line has improved the business community’s outlook for 2024.
- Competition for deposits is still present in the marketplace but at a more managed pace than in 2023. The increase in regulatory commentary outside of the traditional rulemaking process has added an additional layer of uncertainty to the planning process. Overall economic factors are reasonably good except for credit stress in some areas of the member base, with unsecured consumer loans experiencing the most meaningful impact.
- Concerns for the outlook that are not listed include the 2024 election and inflation.
- Mortgage rates coming down have increased the number of purchase-money applications that we are receiving.
- Certainty is needed around interest rates for the real estate market, depositors and small businesses [to make decisions concerning the future]. There is too much speculation on what the Federal Reserve will or should do.
- The decreasing values of vehicles securing auto loans [will be a problem, leading to] potential losses due to defaults and resulting deficit balances.
Historical data can be downloaded dating back to March 2017. For the definitions, see data definitions.
NOTE: The following series were discontinued in May 2020: volume of core deposits, cost of funds, non-interest income and net interest margin.
Questions regarding the Banking Conditions Survey can be addressed to Emily Kerr at emily.kerr@dal.frb.org.
Sign up for our email alert to be automatically notified as soon as the latest Banking Conditions Survey is released on the web.