Dallas Fed Energy Survey

Oil and gas expansion stalls amid surging costs and worsening outlooks
Special questions this quarter include an annual update on breakeven prices by basin, anticipated employee head count changes in 2023, the main factor influencing company profitability and the top cause of worker shortages in the oilfield.
Growth in the oil and gas sector stalled out in first quarter 2023, according to oil and gas executives responding to the Dallas Fed Energy Survey. The business activity index—the survey’s broadest measure of conditions facing Eleventh District energy firms—was 2.1 in the first quarter, down sharply from 30.3 in fourth quarter 2022. The near-zero reading indicates activity was largely unchanged from the prior quarter, a break from the more than two-year stretch of rising activity.
Oil and natural gas production increased at a slower pace compared with the prior quarter, according to executives at exploration and production (E&P) firms. The oil production index remained positive but declined to 10.5 in the first quarter from 25.8 in the fourth. Similarly, the natural gas production index fell to 7.4 from 29.4.
Firms reported rising costs for a ninth consecutive quarter as all series remained significantly above their averages. Among oilfield services firms, the input cost index was roughly unchanged at an elevated 61.6. Among E&P firms, the finding and development costs index slipped to 46.8 from 52.5. Additionally, the lease operating expenses index declined 11 points to 37.6.
The supplier delivery time index for all firms moved into negative territory, declining to -14.0 in the first quarter from 14.4 in the fourth. This is the first negative reading since fourth quarter 2020 and signals that it takes less time to receive materials and equipment relative to the prior quarter. Among oilfield services firms, the measure of lag time in delivery of services declined to zero from 20.0, suggesting delivery times for these firms are no longer increasing.
For oilfield services firms, the equipment utilization index slid 29 points to 3.9 in the first quarter. The operating margin index declined to 1.9 from 25.9. The index of prices received for services remained positive but declined to 25.0 from 43.6.
Indexes related to employment and hours worked eased in the first quarter. The aggregate employment index posted a ninth consecutive positive reading but dipped to 14.3 from 25.7. The aggregate employee hours index declined to 12.3 from 27.7 in the prior quarter. Meanwhile, the aggregate wages and benefits index edged higher, to 43.6 from 40.2.
The company outlook index turned negative in the first quarter, falling 27 points to -14.1. The overall outlook uncertainty index increased 23 points to 62.6, pointing to firms’ continued heightened uncertainty regarding their outlooks. Sixty-eight percent of firms reported greater uncertainty.
On average, respondents expect a West Texas Intermediate (WTI) oil price of $80 per barrel by year-end 2023; responses ranged from $50 to $160 per barrel. Survey participants expect Henry Hub natural gas prices of $3.43 per million British thermal units (MMBtu) at year-end. For reference, WTI spot prices averaged $68.51 per barrel during the survey collection period, and Henry Hub spot prices averaged $2.23 per MMBtu.
Next release: June 22, 2023
Data were collected March 15–23, and 147 energy firms responded. Of the respondents, 95 were exploration and production firms and 52 were oilfield services firms.
The Dallas Fed conducts the Dallas Fed Energy Survey quarterly to obtain a timely assessment of energy activity among oil and gas firms located or headquartered in the Eleventh District. Firms are asked whether business activity, employment, capital expenditures and other indicators increased, decreased or remained unchanged compared with the prior quarter and with the same quarter a year ago. Survey responses are used to calculate an index for each indicator. Each index is calculated by subtracting the percentage of respondents reporting a decrease from the percentage reporting an increase. When the share of firms reporting an increase exceeds the share reporting a decrease, the index will be greater than zero, suggesting the indicator has increased over the previous quarter. If the share of firms reporting a decrease exceeds the share reporting an increase, the index will be below zero, suggesting the indicator has decreased over the previous quarter.
Price Forecasts
West Texas Intermediate Crude

| West Texas Intermediate crude oil price (dollars per barrel), year-end 2023 | ||||
| Indicator | Survey Average | Low Forecast | High Forecast | Price During Survey |
Current quarter | $79.64 | $50.00 | $160.00 | $68.51 |
Prior quarter | $83.63 | $65.00 | $160.00 | $73.67 |
| NOTE: Price during survey is an average of daily spot prices during the survey collection period. SOURCES: Energy Information Administration; Federal Reserve Bank of Dallas. | ||||
Henry Hub Natural Gas

| Henry Hub natural gas price (dollars per MMBtu), year-end 2023 | ||||
| Indicator | Survey Average | Low Forecast | High Forecast | Price During Survey |
Current quarter | $3.43 | $1.75 | $12.50 | $2.23 |
Prior quarter | $5.64 | $2.50 | $9.00 | $5.93 |
| NOTE: Price during survey is an average of daily spot prices during the survey collection period. SOURCES: Federal Reserve Bank of Dallas; Energy Information Administration. | ||||
Special Questions
Data were collected March 15–23; 140 oil and gas firms responded to the special questions survey.
Exploration and Production (E&P) Firms
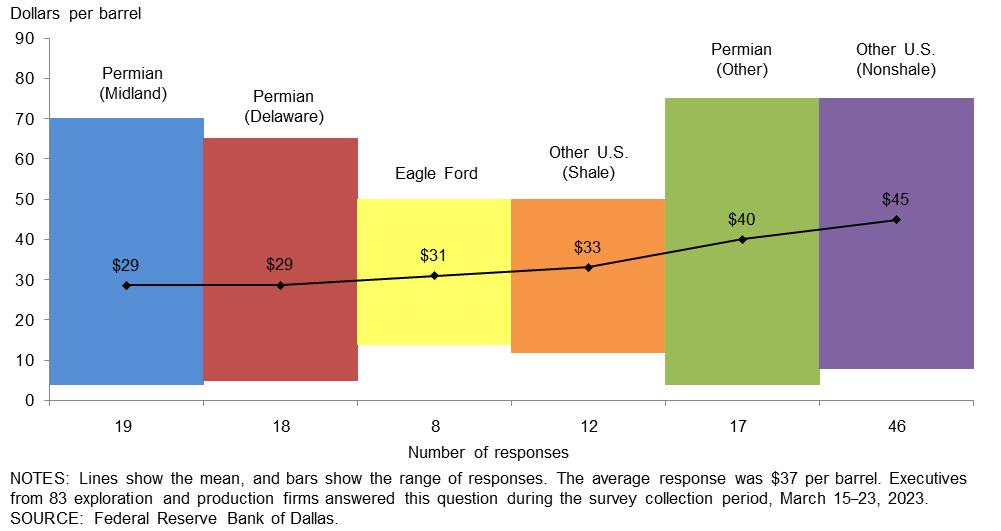
In the top two areas in which your firm is active: What West Texas Intermediate (WTI) oil price does your firm need to cover operating expenses for existing wells?
The average price across the entire sample is approximately $37 per barrel, up from $34 last year. Across regions, the average price necessary to cover operating expenses ranges from $29 to $45 per barrel. Almost all respondents can cover operating expenses for existing wells at current prices.
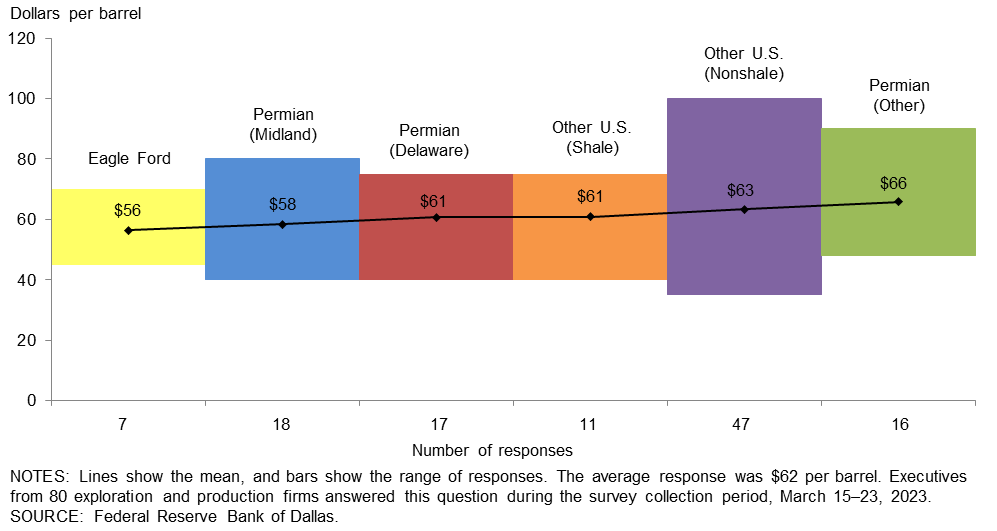
In the top two areas in which your firm is active: What WTI oil price does your firm need to profitably drill a new well?
For the entire sample, firms need $62 per barrel on average to profitably drill, higher than the $56-per-barrel price when this question was asked last year. Across regions, average breakeven prices to profitably drill range from $56 to $66 per barrel. Breakeven prices in the Permian Basin average $61 per barrel, $9 higher than last year. Despite recent oil price declines, most firms in the survey can profitably drill a new well at current prices.
Large firms (with crude oil production of 10,000 barrels per day or more as of fourth quarter 2022) require prices of $55 per barrel to profitably drill, based on the average of company responses. That compares with $64 for small firms (fewer than 10,000 barrels per day).
All Firms
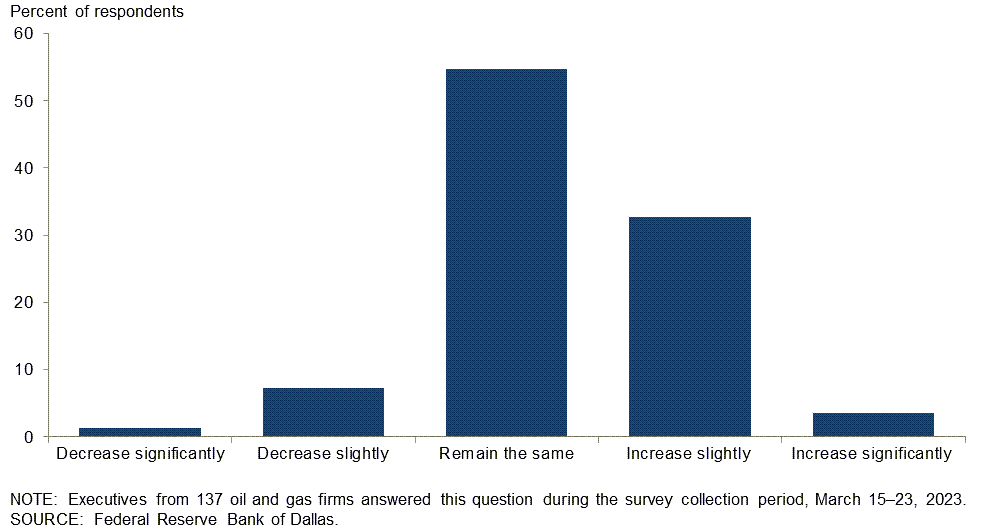
How do you expect the number of employees at your company to change from December 2022 to December 2023?
More than half of the executives—55 percent—expect their head count to remain unchanged from December 2022 to December 2023. Thirty-seven percent of executives expect the number of employees to increase, of which 4 percent expect a significant increase and 33 percent anticipate a slight increase. Only 8 percent foresee the number of employees decreasing over the period.
Whereas the most-selected response among E&P firms was for employment to “remain the same” in 2023, the most-selected response of support service firms was for employment to “increase slightly” in 2023. (See table for more detail.)
| Response | Percent of respondents (among each group) | ||
| All firms | E&P | Services | |
| Increase significantly | 4 | 2 | 6 |
| Increase slightly | 33 | 25 | 46 |
| Remain the same | 55 | 66 | 36 |
| Decrease slightly | 7 | 6 | 10 |
| Decrease significantly | 1 | 1 | 2 |
| NOTES: Executives from 87 exploration and production firms and 50 oil and gas support services firms answered this question during the survey collection period, March 15–23, 2023. The “All” column reports the percentage out of the total 137 responses. Percentages may not sum to 100 due to rounding. SOURCE: Federal Reserve Bank of Dallas. |
|||
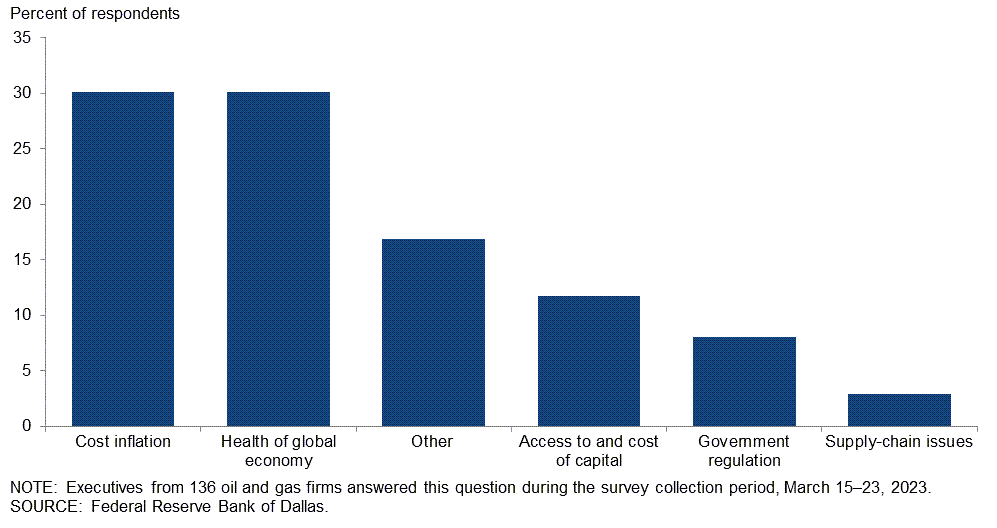
Which of the following do you believe will have the most influence on the profitability of your firm this year?
“Cost inflation” and “health of global economy” were each selected by 30 percent of executives as having the greatest influence on the profitability of their firm in 2023.
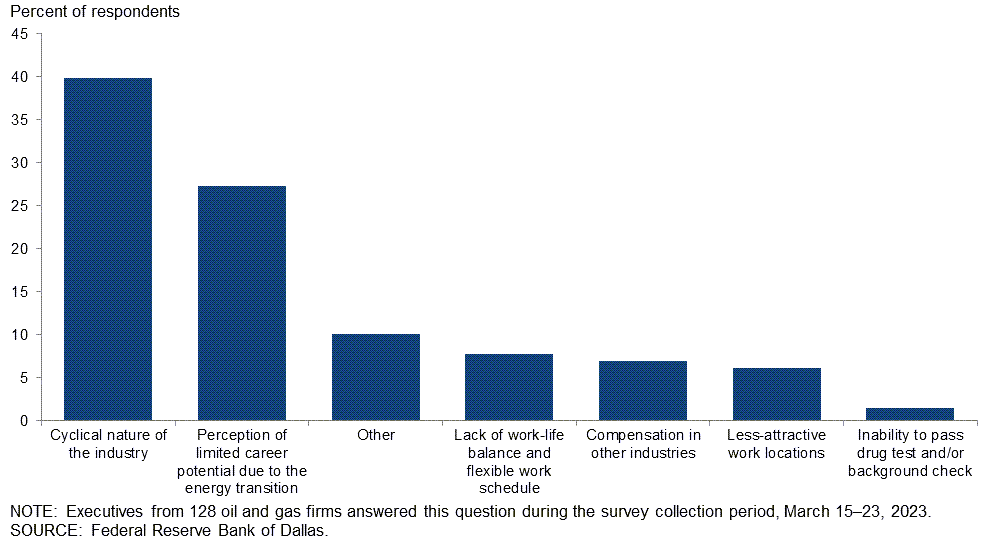
Which of the following is the primary factor causing worker shortages in the oilfield?
Forty percent of executives cited the cyclical nature of the industry as the primary factor causing oilfield worker shortages. A total of 27 percent selected “perception of limited career potential due to the energy transition,” and 10 percent indicated “other.”
Special Questions Comments
Exploration and Production (E&P) Firms
- Government roadblocks are a major issue for our firm. "Majors" have the world to play in. They are at an advantage compared with independents who are currently entangled in red tape and buffeted by public pronouncements in the U.S. about this perceived evil industry. Capital providers have been politicized by design by the current political operatives, hurting the entire industry, especially small businesses. The industry, and independents in particular, have an important role to play for the next 50 years at least. I believe a large part of service cost inflation is due to service companies restricting rig count and active frac crews in an effort to boost their margins, not due to labor shortages.
- Seems like oil prices have gone down to where the federal government said it would buy barrels to replace the Strategic Petroleum Reserve. With all these jobs in the South tied to energy, I'm sure the administration follows through with its promises, right? Or will it choose the easy path and continue harmful and confusing rhetoric against energy producers while cheering on lower gasoline prices? Also, the Energy Information Administration put out its Annual Energy Outlook this week, and it forecasts that oil production from the U.S. will be flat for the next 30 years. We should probably inform them of the collapse in shale production we are going to see in under five years.
- Service costs and authorization for expenditures keep climbing. The latest commodity price action feels like the sword of Damocles is back; where is oil going to bottom this time?
- The sudden drop in natural gas prices from year-end 2022 into 2023 significantly shifted the priorities for 2023 from growth to maintaining margins.
- The administration’s policies against domestic oil production will have catastrophic effects on our ability to protect our economic way of life. Our way of life is degrading.
- We hear some rigs’ and fracs’ availability is leading to lower quoted rates. Natural gas and fuel price reduction coupled with steel reduction is leading to cost relief on several oilfield items. Supply-chain pressures have now eased significantly and are back to prepandemic levels. Labor productivity is impaired as market tightness has led to a less-experienced pool.
Oil and Gas Support Services Firms
- Uncertainty rules the day. It is extremely difficult to plan for the future with so much of the base data we are used to using being all over the board. Seems like business patterns go against trends proven over the last 30–40 years in the oil and gas industry as a whole and the oil and gas service business specifically. However, overall the adage "go hard now, bank as much as you can, and hope it is enough to get you through the lean times we know are coming" is still true today.
- The factors that impact availability of labor seem different for every demographic. Many left the oilfield in 2020 and are not coming back, either due to age or the booms and busts. Wages are not high enough to bring them back compared with other sectors. Gen Z’s and work/life balance desires are the same with blue-collar and white-collar employees, with many entering the workforce willing to accept lower earnings for predictability and scheduling not available in the oilfield. Perceived energy transition concerns seem less impactful than the overall perception of oilfield work. Drug charges/tests and multiple driving under the influence charges also eliminate many otherwise willing applicants.
- Currently, finding skilled labor is our biggest challenge. Rates of pay have risen to the point that they’re diminishing our gross margins, and competitors are overpaying, sometimes to the point of offering raises based on being able to “steal” the work from our customers. In some cases, [this is] close to a 30 percent bump in wages. Bottom line is most will fail.
- Inflation, supply-chain issues, rising interest rates and governmental regulation are all major issues that will influence profitability. For the question regarding the primary factor causing worker shortages, all elements listed are major issues relating to personnel.
- The cyclical nature of the industry and the perception of it as a dying industry both make it hard for landmen to stay in this business and for new ones to enter. Pay has not risen in years for field landmen, while other industries have had significant hikes. I would not recommend the industry to any young people.
Additional Comments »
Historical data are available from first quarter 2016 to the most current release quarter.
Business Indicators: Quarter/Quarter
| Business Indicators: All Firms Current Quarter (versus previous quarter) | |||||
| Indicator | Current Index | Previous Index | % Reporting Increase | % Reporting No Change | % Reporting Decrease |
Level of Business Activity | 2.1 | 30.3 | 29.3 | 43.5 | 27.2 |
Capital Expenditures | 17.1 | 40.1 | 41.1 | 34.9 | 24.0 |
Supplier Delivery Time | –14.0 | 14.4 | 9.8 | 66.4 | 23.8 |
Employment | 14.3 | 25.7 | 23.1 | 68.0 | 8.8 |
Employee Hours | 12.3 | 27.7 | 21.1 | 70.1 | 8.8 |
Wages and Benefits | 43.6 | 40.2 | 45.6 | 52.4 | 2.0 |
| Indicator | Current Index | Previous Index | % Reporting Improved | % Reporting No Change | % Reporting Worsened |
Company Outlook | –14.1 | 13.1 | 19.7 | 46.5 | 33.8 |
| Indicator | Current Index | Previous Index | % Reporting Increase | % Reporting No Change | % Reporting Decrease |
Uncertainty | 62.6 | 40.1 | 68.0 | 26.5 | 5.4 |
| Business Indicators: E&P Firms Current Quarter (versus previous quarter) | |||||
| Indicator | Current Index | Previous Index | % Reporting Increase | % Reporting No Change | % Reporting Decrease |
Level of Business Activity | –2.1 | 29.9 | 25.3 | 47.4 | 27.4 |
Oil Production | 10.5 | 25.8 | 31.6 | 47.4 | 21.1 |
Natural Gas Wellhead Production | 7.4 | 29.4 | 28.7 | 50.0 | 21.3 |
Capital Expenditures | 11.7 | 38.2 | 38.3 | 35.1 | 26.6 |
Expected Level of Capital Expenditures Next Year | 6.4 | 35.0 | 31.9 | 42.6 | 25.5 |
Supplier Delivery Time | –16.5 | 18.6 | 7.7 | 68.1 | 24.2 |
Employment | 8.4 | 14.4 | 14.7 | 78.9 | 6.3 |
Employee Hours | 10.5 | 16.4 | 13.7 | 83.2 | 3.2 |
Wages and Benefits | 37.8 | 36.0 | 38.9 | 60.0 | 1.1 |
Finding and Development Costs | 46.8 | 52.5 | 47.9 | 51.1 | 1.1 |
Lease Operating Expenses | 37.6 | 48.4 | 44.1 | 49.5 | 6.5 |
| Indicator | Current Index | Previous Index | % Reporting Improved | % Reporting No Change | % Reporting Worsened |
Company Outlook | –18.9 | 6.5 | 16.7 | 47.8 | 35.6 |
| Indicator | Current Index | Previous Index | % Reporting Increase | % Reporting No Change | % Reporting Decrease |
Uncertainty | 64.2 | 45.4 | 69.5 | 25.3 | 5.3 |
| Business Indicators: O&G Support Services Firms Current Quarter (versus previous quarter) | |||||
| Indicator | Current Index | Previous Index | % Reporting Increase | % Reporting No Change | % Reporting Decrease |
Level of Business Activity | 9.6 | 30.9 | 36.5 | 36.5 | 26.9 |
Utilization of Equipment | 3.9 | 32.8 | 30.8 | 42.3 | 26.9 |
Capital Expenditures | 27.0 | 43.6 | 46.2 | 34.6 | 19.2 |
Supplier Delivery Time | –9.6 | 7.3 | 13.5 | 63.5 | 23.1 |
Lag Time in Delivery of Firm's Services | 0.0 | 20.0 | 7.7 | 84.6 | 7.7 |
Employment | 25.0 | 45.5 | 38.5 | 48.1 | 13.5 |
Employment Hours | 15.4 | 47.2 | 34.6 | 46.2 | 19.2 |
Wages and Benefits | 53.9 | 47.3 | 57.7 | 38.5 | 3.8 |
Input Costs | 61.6 | 61.8 | 63.5 | 34.6 | 1.9 |
Prices Received for Services | 25.0 | 43.6 | 34.6 | 55.8 | 9.6 |
Operating Margin | 1.9 | 25.9 | 28.8 | 44.2 | 26.9 |
| Indicator | Current Index | Previous Index | % Reporting Improved | % Reporting No Change | % Reporting Worsened |
Company Outlook | –5.8 | 24.5 | 25.0 | 44.2 | 30.8 |
| Indicator | Current Index | Previous Index | % Reporting Increase | % Reporting No Change | % Reporting Decrease |
Uncertainty | 59.6 | 30.9 | 65.4 | 28.8 | 5.8 |
Business Indicators: Year/Year
| Business Indicators: All Firms Current Quarter (versus same quarter a year ago) | |||||
| Indicator | Current Index | Previous Index | % Reporting Increase | % Reporting No Change | % Reporting Decrease |
Level of Business Activity | 27.7 | 59.3 | 53.9 | 19.9 | 26.2 |
Capital Expenditures | 37.6 | 58.4 | 58.2 | 21.3 | 20.6 |
Supplier Delivery Time | 11.5 | 41.7 | 38.1 | 35.3 | 26.6 |
Employment | 35.2 | 41.6 | 43.7 | 47.9 | 8.5 |
Employee Hours | 29.6 | 43.1 | 34.5 | 60.6 | 4.9 |
Wages and Benefits | 63.5 | 68.3 | 66.4 | 30.7 | 2.9 |
| Indicator | Current Index | Previous Index | % Reporting Improved | % Reporting No Change | % Reporting Worsened |
Company Outlook | 16.8 | 57.6 | 41.2 | 34.4 | 24.4 |
| Business Indicators: E&P Firms Current Quarter (versus same quarter a year ago) | |||||
| Indicator | Current Index | Previous Index | % Reporting Increase | % Reporting No Change | % Reporting Decrease |
Level of Business Activity | 12.2 | 52.7 | 43.3 | 25.6 | 31.1 |
Oil Production | 11.0 | 44.0 | 41.8 | 27.5 | 30.8 |
Natural Gas Wellhead Production | 15.5 | 36.7 | 41.1 | 33.3 | 25.6 |
Capital Expenditures | 26.7 | 53.2 | 51.1 | 24.4 | 24.4 |
Expected Level of Capital Expenditures Next Year | 14.8 | 58.5 | 39.8 | 35.2 | 25.0 |
Supplier Delivery Time | 5.7 | 47.8 | 33.0 | 39.8 | 27.3 |
Employment | 23.9 | 31.1 | 31.5 | 60.9 | 7.6 |
Employee Hours | 15.4 | 30.5 | 19.8 | 75.8 | 4.4 |
Wages and Benefits | 57.8 | 64.5 | 60.0 | 37.8 | 2.2 |
Finding and Development Costs | 69.7 | 75.0 | 71.9 | 25.8 | 2.2 |
Lease Operating Expenses | 64.1 | 75.8 | 69.7 | 24.7 | 5.6 |
| Indicator | Current Index | Previous Index | % Reporting Improved | % Reporting No Change | % Reporting Worsened |
Company Outlook | 4.7 | 54.6 | 34.5 | 35.7 | 29.8 |
| Business Indicators: O&G Support Services Firms Current Quarter (versus same quarter a year ago) | |||||
| Indicator | Current Index | Previous Index | % Reporting Increase | % Reporting No Change | % Reporting Decrease |
Level of Business Activity | 54.9 | 71.1 | 72.5 | 9.8 | 17.6 |
Utilization of Equipment | 54.9 | 69.2 | 68.6 | 17.6 | 13.7 |
Capital Expenditures | 56.9 | 67.3 | 70.6 | 15.7 | 13.7 |
Supplier Delivery Time | 21.6 | 30.7 | 47.1 | 27.5 | 25.5 |
Lag Time in Delivery of Firm's Services | 21.6 | 42.4 | 27.5 | 66.7 | 5.9 |
Employment | 56.0 | 59.6 | 66.0 | 24.0 | 10.0 |
Employment Hours | 54.9 | 65.4 | 60.8 | 33.3 | 5.9 |
Wages and Benefits | 74.0 | 75.0 | 78.0 | 18.0 | 4.0 |
Input Costs | 76.5 | 78.9 | 80.4 | 15.7 | 3.9 |
Prices Received for Services | 58.8 | 69.2 | 68.6 | 21.6 | 9.8 |
Operating Margin | 27.4 | 47.1 | 52.9 | 21.6 | 25.5 |
| Indicator | Current Index | Previous Index | % Reporting Improved | % Reporting No Change | % Reporting Worsened |
Company Outlook | 38.3 | 63.0 | 53.2 | 31.9 | 14.9 |
Activity Chart

Comments from Survey Respondents
These comments are from respondents’ completed surveys and have been edited for publication. Comments from the Special Questions survey can be found below the special questions.
Exploration and Production (E&P) Firms
- Oil price correction is adding pressure on the continuation of drilling and frac activities. [We] expect the activity level to be flat to down in 2023 versus 2022’s exit.
- The dramatic increase in 2022 inflation has severely negatively impacted project economics.
- Uncertainty of the depth and duration of a bank crisis is causing us to be nervous about capital spending plans in 2023.
- Oil in recession trades like a financial product—supply/demand fundamentals matter less. Chickens seem to be coming home to roost; it turns out loaning out trillions of dollars with zero interest rates (or in the case of Europe, paying folks to borrow money) was not our finest hour.
- Regulatory uncertainty continues to be a headwind. Inflation pressures appear to be moderating slightly, but we still have a long way to go.
- Permitting delays by the administration’s policies have caused us not to drill two wells we had hoped to drill this year. The BLM [Bureau of Land Management] is holding them hostage.
- The current low oil prices, coupled with the banking scare, will be hard on smaller, undercapitalized companies to conduct business as usual. There will be tougher credit and lower reserve values because of new price decks.
- A growing concern in West Texas is that the reliable generated supply of electricity is not growing, while consumption of power has grown roughly 50 percent over the past 24 months. This could lead to a future moderation of basinwide activity if power supply cannot meet future demand.
- Crude oil is about to join natural gas in contango, which is highlighting a nervous macroeconomic picture. There are plenty of buyers at this calender strip price and not a lot of sellers. Not seeing financial distress with all of the cash accrued since last year. The only way people are in trouble is if hedges are under water or if they blew out authorization for expenditures.
- An estimated 30–40 percent cost increase in field operations, increased interest charges on borrowed money, a drastic collapse in natural gas prices combined with lower crude oil prices produced a noticeable lower cash flow. Service company capacity is quite limited in select basins. Outside investors seem to be losing interest in hydrocarbons. The worldwide macroeconomic and political outlook is cloudy. The road ahead looks difficult but passable. We expect another "muddle through" period in a cyclical business where more players will be winnowed out.
- The uncertainty in oil and gas prices is making it difficult to plan for the future. Between government regulations and oil and gas prices, it is becoming more and more difficult to remain in the oil and gas business.
- We expect oil and gas production to decline in 2023 due to higher drilling and completion costs. The significant factor is the lack of qualified employees. The second [factor] is the negative impact of environmental, social and governance initiatives.
- Government roadblocks are our biggest and most insidious obstacles to overcome. Both the current administration and the governor of California are dreaming up new ways to add costs, delay permits and prevent drilling and leasing.
- Financing unexpected capital calls has gotten more challenging with the Federal Reserve's interest rate increases and the government’s war on oil and gas. We're finding more creative ways to get financing. Current banking is starting to prove "difficult" due to "attitudes" from constantly shifting young bank officers, despite 27 years of business with the same bank. Silicon Valley Bank and associated banking meltdowns are impacting commodity prices. Our operators are reporting that they are having trouble getting materials, parts, pumps, pipe and tubing into West Texas projects. We are also noticing that most of our operators have reduced staffs and have replaced knowledgeable and experienced personnel with apparently cheaper "newbies." Oilfield inflation has to be the No. 1 problem. Capital expenditure increases are soaring well past consumer price index data. I'm noticing apparent quality problems beginning to plague new projects; specifically, I've never seen so many cases of parted tubing with new tubing, particularly with poor quality collars, as I'm seeing in recent months. Is the U.S. importing more inferior-grade oil country tubular goods now?
- Mixed messages sent by the current administration respecting the necessity for fossil fuel production, scarcity of labor, increased cost of materials and supplies, domestic and foreign political risk, demand volatility and economic uncertainty domestically have each contributed to an environment that is difficult to work and make plans in going forward. In addition to those factors, the increased cost of capital has negatively impacted the ability to participate in projects that could enable the organization to grow.
- The rig count has fallen for the past two months. Shale producers have drilled most of their tier 1 quality. The Bakken is seeing itself reach a bubble point, and natural gas is increasing in new completions with less crude oil. Natural economics occurs in the patch. Values drop and so do activity and production levels. Supply and demand are priced accordingly. Global issues also can play a part. Climate change activists are causing disruption.
- The biggest threat to our business is the federal government. The public narrative, directed by Washington, that the world is moving away from oil and gas is a very big problem. It directly affects our ability to raise capital. This must stop. It's easier to finance a vape shop or a tattoo shop than it is to finance oil and gas. There is something seriously wrong here.
- Market risks, both directly and indirectly related and unrelated to oil and gas, have increased significantly and are likely to not be reduced by any action undertaken, suggested or omitted by the administration.
- Frivolous environmental litigation from Bureau of Land Management leases and permits is obstructing our ability to properly develop our properties. Service cost inflation combined with weaker commodity prices will negatively impact future drilling plans, resulting in less activity.
- The low oil and gas prices are impacting investment. Talk by government officials regarding the oil and gas industry makes one wonder why the industry should risk dollars.
- Our industry has been affected negatively by the Russia–Ukraine war, and now there are concerns over the banking system. The continued mixed messages put out by the administration are also contributing to the uncertainty and unwillingness to put additional funds toward development and growth.
- The administration’s policies will continue to affect domestic natural gas and oil production negatively. Oil and gas prices will soar in the next few years, and we'll be at the mercy of nations that hate us.
- [There have been] no direct impacts to our company yet that we know of, but we are monitoring tremors in the banking system that surfaced over the past couple of weeks.
- Volatility in commodity markets and recent banking turmoil continue to play into business dynamics and are leading to a reduction in spending plans. The dramatic pullback in natural gas prices has also led to a decrease in appetite to target gas prospects and has also led to some optional gas-rate curtailments.
- Overall, prices have impacted the revenue but not yet costs. We are still waiting for costs to catch up with the new pricing levels. We do not expect prices to increase significantly.
- It appears as if the war in Ukraine will continue.
Oil and Gas Support Services Firms
- The persistent labor shortage in the Permian Basin shows no signs of easing. It is very difficult to fill mechanical and electrical positions with local residents. Our company is relying on shift workers from out of state to fill these spots due to the shortage of local qualified workers. The growth of the electrical grid is not keeping up with demand. It will be increasingly difficult for the energy industry to meet stricter environmental regulations without significant investment in power generation and transmission. The infrastructure of the Permian Basin continues to be maxed out. Roads are at capacity, and there are not enough local, state and federal dollars flowing into the area to properly construct and maintain safe roads.
- We're at a crossroads as activity levels are not matching service pricing. There seems to be a disparity at the operator level where their reluctance to allow pricing increases doesn't match with their own internal financial success. What has long been a healthy operator-to-service-provider relationship is beginning to show signs of deterioration.
- [We’re] still seeing inflationary pressures (wages and consumables) on a smaller scale. However, E&P companies are not as open to help absorb the increases.
- Labor remains the most significant challenge. Activity and revenues would be higher with additional employees. The lack of labor is also impacting vendors and turnaround times. The lack of labor issue includes both qualified mechanics/welders and general labor for oilfield services who are able to meet employment criteria.
- Regulatory uncertainty is a major overhang. Labor remains tight, with continued wage pressures. Supply-chain issues remain.
- Finding workers is getting harder and harder. The potential pool of workers is probably not so different, but it is more a case of workers being able to collect more governmental assistance, so why work?
- The likelihood of a recession has increased. Government at all levels is out of control. Regulation is killing the nation. Environmental issues are overblown to the point of the absurd.
- We are seeing the vertical natural gas drillers drop rigs and defer projects due to low natural gas prices and high costs, especially casing and tubing. Unlike the horizontal operators, these companies can stop and start very quickly.
- Recent government actions related to backstopping uninsured losses in the wake of the Silcon Valley Bank collapse sets a terrible precedent that greatly increases future policy uncertainty and, therefore, also increases future market volatility as the market will always try to correct course, but with less and less time to respond.
- Bank failures in March 2023 and concerns over the overall financial system have added to concerns over possible recession timing and severity and the possible short-term impact on WTI [West Texas Intermediate]. Gas-directed activity, especially in the Haynesville, is being negatively impacted by takeaway limitations and significant declines in Henry Hub natural gas prices since third quarter 2022. Credit was already tight for oilfield services companies; I expect availability of credit will tighten even more, making business conditions tougher for companies without the necessary operating scale.
Questions regarding the Dallas Fed Energy Survey can be addressed to Michael Plante at Michael.Plante@dal.frb.org or Kunal Patel at Kunal.Patel@dal.frb.org.
Sign up for our email alert to be automatically notified as soon as the latest Dallas Fed Energy Survey is released on the web.