Dallas Fed Energy Survey

Oil and gas activity essentially unchanged; optimism wanes as uncertainty jumps
Special questions focus on capital spending in 2024, the oil price firms use for budgeting, expectations regarding large acquisitions for exploration and production (E&P) firms, plans for reducing greenhouse emissions, and E&P firms’ primary goals for the coming year.
Activity in the oil and gas sector was essentially unchanged in fourth quarter 2023, according to oil and gas executives responding to the Dallas Fed Energy Survey. The business activity index, the survey’s broadest measure of conditions energy firms in the Eleventh District face, remained positive but slipped from 10.9 in the third quarter to 3.6 in the fourth quarter. The business activity index was 7.5 for E&P firms versus -4.2 for services firms, suggesting activity slightly grew for E&P firms, but declined slightly for service firms.
Oil production increased but at a significantly slower pace compared with the prior quarter, according to executives at E&P firms. The oil production index remained positive but fell from 26.5 in the third quarter to 5.3 in the fourth. Meanwhile, the natural gas production index edged up from 15.4 to 17.9.
Among oilfield services firms the input cost index remained positive, but slipped from 33.4 to 21.3. Among E&P firms, the finding and development costs index rose from 18.3 to 24.4. Meanwhile, the lease operating expenses index moved down from 25.6 to 22.6.
Oilfield services firms reported modest deterioration in nearly all indicators. The equipment utilization index moved down from -4.2 in the third quarter to -8.4 in the fourth quarter. The operating margin index was relatively unchanged at -32.0. The index of prices received for services turned negative and fell from 2.1 to -6.2.
The aggregate employment index was relatively unchanged at 4.2 in the fourth quarter. The aggregate employee hours index remained positive but fell from 9.6 in the third quarter to 2.8 in the fourth quarter. Meanwhile, the aggregate wages and benefits index edged down from 24.5 to 21.2.
The company outlook index turned negative in the fourth quarter and plunged 48 points to -12.4, suggesting some pessimism among firms. The company outlook for E&P firms changed more drastically, as the company outlook index for these firms fell sharply from 46.8 to -9.0. The overall outlook uncertainty index jumped 39 points to 46.1, suggesting mounting uncertainty.
On average, respondents expect a West Texas Intermediate (WTI) oil price of $78 per barrel at year-end 2024; responses ranged from $51 to $110 per barrel. Survey participants expect a Henry Hub natural gas price of $3.09 per million British thermal units (MMBtu) at year-end. For reference, WTI spot prices averaged $69.77 per barrel during the survey collection period, and Henry Hub spot prices averaged $2.48 per MMBtu.
Next release: March 27, 2024
Data were collected Dec. 6–14, and 144 energy firms responded. Of the respondents, 96 were exploration and production firms and 48 were oilfield services firms.
The Dallas Fed conducts the Dallas Fed Energy Survey quarterly to obtain a timely assessment of energy activity among oil and gas firms located or headquartered in the Eleventh District. Firms are asked whether business activity, employment, capital expenditures and other indicators increased, decreased or remained unchanged compared with the prior quarter and with the same quarter a year ago. Survey responses are used to calculate an index for each indicator. Each index is calculated by subtracting the percentage of respondents reporting a decrease from the percentage reporting an increase. When the share of firms reporting an increase exceeds the share reporting a decrease, the index will be greater than zero, suggesting the indicator has increased over the previous quarter. If the share of firms reporting a decrease exceeds the share reporting an increase, the index will be below zero, suggesting the indicator has decreased over the previous quarter.
Price Forecasts
West Texas Intermediate Crude

| West Texas Intermediate crude oil price (dollars per barrel), year-end 2024 | ||||
| Indicator | Survey Average | Low Forecast | High Forecast | Price During Survey |
Current quarter | $77.68 | $51.00 | $110.00 | $69.77 |
Prior quarter | N/A | N/A | N/A | N/A |
| NOTE: Price during survey is an average of daily spot prices during the survey collection period. SOURCES: Federal Reserve Bank of Dallas; Energy Information Administration. | ||||
Henry Hub Natural Gas

| Henry Hub natural gas price (dollars per MMBtu), year-end 2024 | ||||
| Indicator | Survey Average | Low Forecast | High Forecast | Price During Survey |
Current quarter | $3.09 | $1.50 | $5.30 | $2.48 |
Prior quarter | N/A | N/A | N/A | N/A |
| NOTE: Price during survey is an average of daily spot prices during the survey collection period. SOURCES: Federal Reserve Bank of Dallas; Energy Information Administration. | ||||
Special Questions
Data were collected Dec. 6–14; 141 oil and gas firms responded to the special questions survey.
All Firms
What are your expectations for your firm’s capital spending in 2024 versus 2023?
Reponses varied widely among executives. The most selected response was “increase slightly,” selected by 33 percent of executives. The second most selected response was “remain close to 2023 levels,” selected by 26 percent, followed by “decrease slightly,” selected by 18 percent. Another 13 percent selected “decrease significantly,” while 10 percent selected “increase significantly.”
Responses differed depending on the firm’s size and type. A breakdown of the data for large and small exploration and production (E&P) companies and oil and gas support services can be found in the table below. E&P firms were classified as small if they produced fewer than 10,000 barrels per day (b/d) or large if they produced 10,000 b/d or more. The most selected response from executives of both small E&P firms and service firms was “increase slightly” at 32 percent and 34 percent, respectively, whereas the most selected response from executives at large E&P firms was “remain close to 2023 levels” at 35 percent.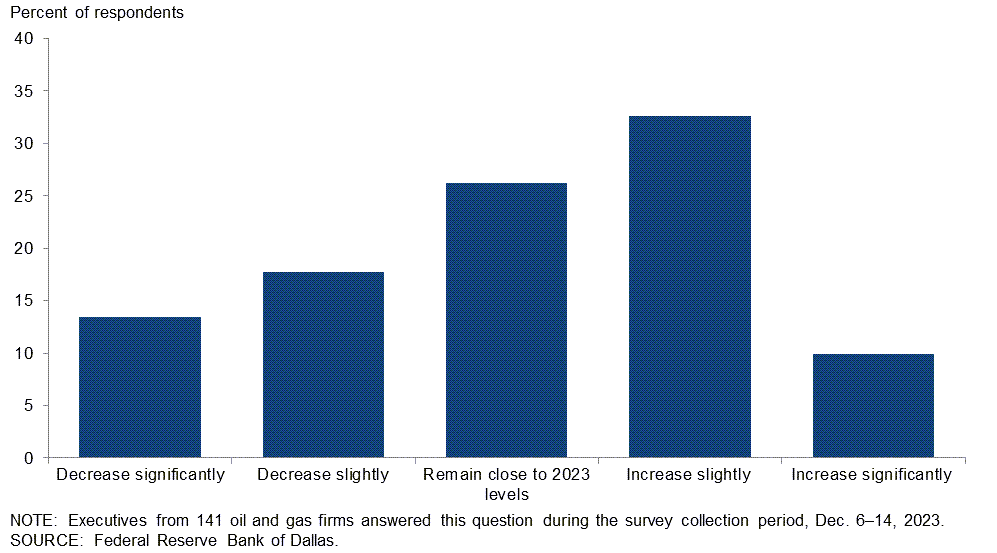
| Response | Percent of respondents (among each group) | |||
| All firms | Large E&P | Small E&P | Services | |
| Increase significantly | 10 | 5 | 15 | 4 |
| Increase slightly | 33 | 30 | 32 | 34 |
| Remain close to 2023 levels | 26 | 35 | 22 | 30 |
| Decrease slightly | 18 | 20 | 20 | 13 |
| Decrease significantly | 13 | 10 | 11 | 19 |
| NOTES: Executives from 94 exploration and production firms and 47 oil and gas support services firms answered this question during the survey collection period, Dec. 6–14, 2023. Responses came from 74 small firms and 20 large firms. Percentages may not sum to 100 due to rounding. SOURCE: Federal Reserve Bank of Dallas. |
||||
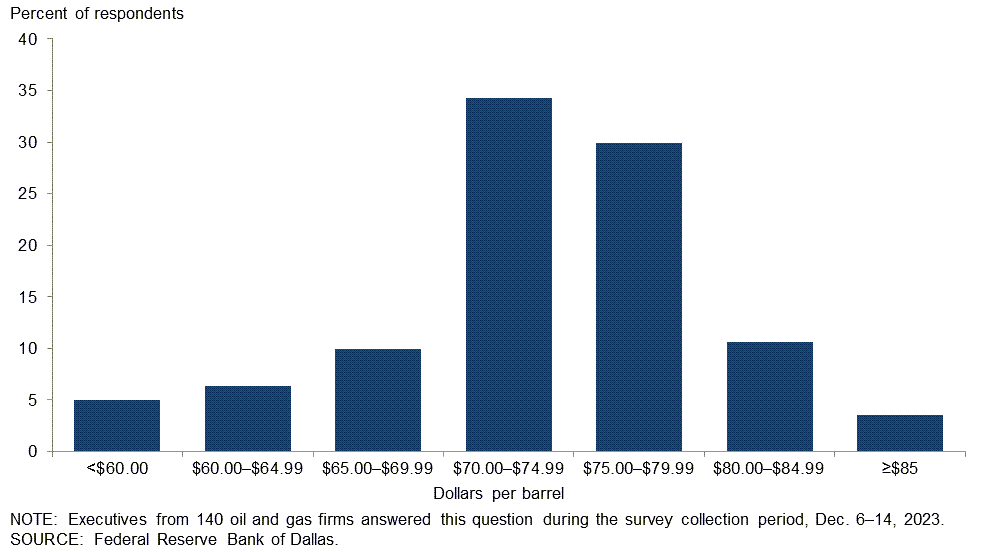
What West Texas Intermediate crude oil price is your firm using for capital planning in 2024?
For this special question, executives were asked to provide the WTI price they used for planning capital expenditures in 2024. The average response was $71 per barrel, with the median and the mode at $70 per barrel. The average price used is relatively close to the price used in the budget in 2023 at $73, but higher than prior years (2019, $54; 2020, $54; 2021, $44; 2022, $64).
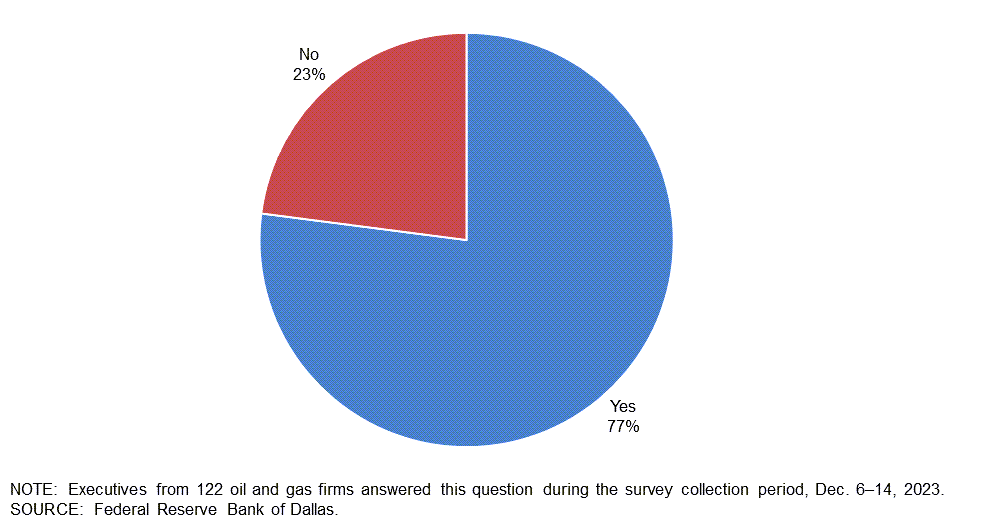
In October 2023, acquisitions of two E&P companies valued at $50 billion or more were announced. Do you expect more deals of this size to occur in the next two years?
Of the executives responding, 77 percent said they expect more acquisitions of $50 billion or more to occur in the next two years. The remaining 23 percent don’t anticipate such transactions.
Exploration and Production (E&P) Firms
Which of the following plans does your firm have? (Check all that apply.)
E&P firms were first asked to define their size based on fourth quarter 2023 crude oil production. They were then asked if they had any of the following plans: reduce carbon emissions; reduce methane emissions; reduce flaring; recycle/reuse water; invest in renewables. Respondents could choose more than one answer for this special question.
In the U.S., small E&P firms are greater in number, but large E&P firms make up the majority of production (more than 80 percent). For the large firms, 53 percent of executives said their firms plans to reduce CO2 emissions, 68 percent indicated plans to reduce methane emissions, 79 percent to reduce flaring, 42 percent to recycle/reuse water and 11 percent to invest in renewables.
For the small firms, 22 percent of executives said their firms plan to reduce CO2 emissions, 34 percent anticipate reducing methane emissions, 18 percent plan to reduce flaring, 27 percent plan to recycle/reuse water and 4 percent to invest in renewables. Among the smaller firms, 51 percent said they have no mitigation plans, compared with 11 percent of large E&P firms.
| Response | Percent of respondents (among each group) | ||
| Small firms | Large firms | All firms | |
| Plan to reduce CO2 emissions | 18 | 53 | 26 |
| Plan to reduce methane emissions | 34 | 68 | 42 |
| Plan to reduce flaring | 27 | 79 | 38 |
| Plan to recycle/reuse water | 22 | 42 | 27 |
| Plan to invest in renewables | 4 | 11 | 6 |
| None of the above | 51 | 11 | 42 |
| NOTES: Executives from 86 exploration and production firms answered this question during the survey collection period, Dec. 6–14, 2023. Responses came from 67 small firms and 19 large firms. SOURCE: Federal Reserve Bank of Dallas. |
|||
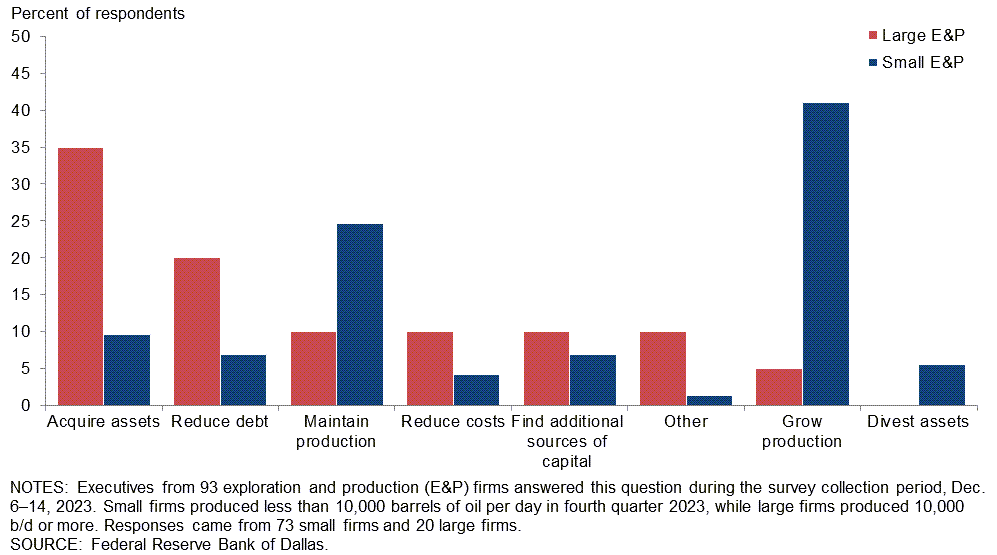
Which of the following is your firm’s primary goal in 2024?
Executives from E&P firms were presented with eight potential goals for 2024 and asked to select their firm’s primary one. The most-selected response among large firms was "acquire assets" (35 percent of respondents) followed by “reduce debt” (20 percent of respondents.) At the same time, the most-selected response among small firms was “grow production” (41 percent of respondents) followed by “maintain production” (25 percent of respondents.)
Special Questions Comments
Exploration and Production (E&P) Firms
- OPEC's failure to secure binding oil production cuts by certain members is a concern. The price postings of crude have gone down since the OPEC announcement of additional voluntary cuts. Also, the oil price seems to be immune to the Israel/Hamas hostility and the possibility of a wider conflict, which should lead to higher prices. In general, the price level of all commodities is trending lower reflecting a market-perceived worldwide economic slowdown which would reduce the demand for hydrocarbons as supply exceeds demand. My fear is that Saudi Arabia will flood the market with crude to punish non-conforming OPEC members and U.S. producers, similar to the events of 2014.
- With $175 billion of merger and acquisition activity this year, we have eclipsed the three prior years combined. Majors are explicitly investing on the thesis that the back end of the forward curve for oil is just plain wrong. Whatever Excel model they are using to justify these prices isn't going to align with their consolidate-and-cut operations. Inventory for U.S. onshore will be extremely valuable in five years as shale inches toward death and moves to terminal decline. Prices are likely closer to $150 than $50 at the end of the decade. The young folks in energy need to learn offshore and international exploration quickly.
- Proposed federal rules and regulations are deterring capital investments in the industry. The new proposed Environmental Protection Agency rules and regulations are not based on historically documented factual information. The entire EPA green process is simply an attack on an industry because it is the popular thing to do. Never mind the facts and true science.
- World events will continue to put upward pressure on hydrocarbon commodity prices.
Oil and Gas Support Services Firms
- The further consolidation of E&P companies looms large for service and/or equipment providers. I see it as a negative for the industry and the communities in the Permian Basin.
- Industry consolidation is inevitable when buying reserves and production and is cheaper than organically growing them. With the significant number of privately held operators looking for exits and value expectations balancing between buyer and seller, we should expect more public companies buying the privates to continue.
- Major oil companies’ passion for consolidating purchasing and procurement of major services to one or two vendors (drilling contractors) will eventually cost them dearly.
- The acquisitions occurring in the oilfield are not helpful.
Additional Comments »
Historical data are available from first quarter 2016 to the most current release quarter.
Business Indicators: Quarter/Quarter
| Business Indicators: All Firms Current Quarter (versus previous quarter) | |||||
| Indicator | Current Index | Previous Index | % Reporting Increase | % Reporting No Change | % Reporting Decrease |
Level of Business Activity | 3.6 | 10.9 | 28.2 | 47.2 | 24.6 |
Capital Expenditures | 3.6 | 25.8 | 28.4 | 46.8 | 24.8 |
Supplier Delivery Time | –2.2 | 0.7 | 6.3 | 85.2 | 8.5 |
Employment | 4.2 | 5.5 | 18.2 | 67.8 | 14.0 |
Employee Hours | 2.8 | 9.6 | 18.9 | 65.0 | 16.1 |
Wages and Benefits | 21.2 | 24.5 | 26.8 | 67.6 | 5.6 |
| Indicator | Current Index | Previous Index | % Reporting Improved | % Reporting No Change | % Reporting Worsened |
Company Outlook | –12.4 | 36.0 | 21.2 | 45.3 | 33.6 |
| Indicator | Current Index | Previous Index | % Reporting Increase | % Reporting No Change | % Reporting Decrease |
Uncertainty | 46.1 | 6.8 | 56.0 | 34.0 | 9.9 |
| Business Indicators: E&P Firms Current Quarter (versus previous quarter) | |||||
| Indicator | Current Index | Previous Index | % Reporting Increase | % Reporting No Change | % Reporting Decrease |
Level of Business Activity | 7.5 | 22.5 | 24.5 | 58.5 | 17.0 |
Oil Production | 5.3 | 26.5 | 24.2 | 56.8 | 18.9 |
Natural Gas Wellhead Production | 17.9 | 15.4 | 31.6 | 54.7 | 13.7 |
Capital Expenditures | 0.0 | 30.7 | 24.5 | 51.1 | 24.5 |
Expected Level of Capital Expenditures Next Year | 1.0 | 35.7 | 30.5 | 40.0 | 29.5 |
Supplier Delivery Time | –5.3 | 0.0 | 4.3 | 86.2 | 9.6 |
Employment | 1.1 | 4.0 | 11.6 | 77.9 | 10.5 |
Employee Hours | 0.0 | 9.3 | 9.5 | 81.1 | 9.5 |
Wages and Benefits | 14.8 | 20.4 | 21.1 | 72.6 | 6.3 |
Finding and Development Costs | 24.4 | 18.3 | 28.7 | 67.0 | 4.3 |
Lease Operating Expenses | 22.6 | 25.6 | 34.4 | 53.8 | 11.8 |
| Indicator | Current Index | Previous Index | % Reporting Improved | % Reporting No Change | % Reporting Worsened |
Company Outlook | –9.0 | 46.8 | 21.3 | 48.3 | 30.3 |
| Indicator | Current Index | Previous Index | % Reporting Increase | % Reporting No Change | % Reporting Decrease |
Uncertainty | 44.0 | –1.0 | 54.8 | 34.4 | 10.8 |
| Business Indicators: O&G Support Services Firms Current Quarter (versus previous quarter) | |||||
| Indicator | Current Index | Previous Index | % Reporting Increase | % Reporting No Change | % Reporting Decrease |
Level of Business Activity | –4.2 | –12.2 | 35.4 | 25.0 | 39.6 |
Utilization of Equipment | –8.4 | –4.2 | 33.3 | 25.0 | 41.7 |
Capital Expenditures | 10.7 | 16.3 | 36.2 | 38.3 | 25.5 |
Supplier Delivery Time | 4.1 | 2.1 | 10.4 | 83.3 | 6.3 |
Lag Time in Delivery of Firm's Services | 0.0 | 2.0 | 8.3 | 83.3 | 8.3 |
Employment | 10.5 | 8.2 | 31.3 | 47.9 | 20.8 |
Employment Hours | 8.3 | 10.2 | 37.5 | 33.3 | 29.2 |
Wages and Benefits | 34.0 | 32.7 | 38.3 | 57.4 | 4.3 |
Input Costs | 21.3 | 33.4 | 29.8 | 61.7 | 8.5 |
Prices Received for Services | –6.2 | 2.1 | 14.6 | 64.6 | 20.8 |
Operating Margin | –32.0 | –30.7 | 10.6 | 46.8 | 42.6 |
| Indicator | Current Index | Previous Index | % Reporting Improved | % Reporting No Change | % Reporting Worsened |
Company Outlook | –18.8 | 14.9 | 20.8 | 39.6 | 39.6 |
| Indicator | Current Index | Previous Index | % Reporting Increase | % Reporting No Change | % Reporting Decrease |
Uncertainty | 50.0 | 22.5 | 58.3 | 33.3 | 8.3 |
Business Indicators: Year/Year
| Business Indicators: All Firms Current Quarter (versus same quarter a year ago) | |||||
| Indicator | Current Index | Previous Index | % Reporting Increase | % Reporting No Change | % Reporting Decrease |
Level of Business Activity | 0.7 | 15.8 | 35.5 | 29.7 | 34.8 |
Capital Expenditures | 8.1 | 25.3 | 39.7 | 28.7 | 31.6 |
Supplier Delivery Time | –11.7 | –3.7 | 11.8 | 64.7 | 23.5 |
Employment | 7.2 | 16.6 | 24.6 | 58.0 | 17.4 |
Employee Hours | 0.0 | 15.7 | 21.3 | 57.4 | 21.3 |
Wages and Benefits | 51.1 | 55.7 | 57.7 | 35.8 | 6.6 |
| Indicator | Current Index | Previous Index | % Reporting Improved | % Reporting No Change | % Reporting Worsened |
Company Outlook | –7.7 | 28.5 | 30.0 | 32.3 | 37.7 |
| Business Indicators: E&P Firms Current Quarter (versus same quarter a year ago) | |||||
| Indicator | Current Index | Previous Index | % Reporting Increase | % Reporting No Change | % Reporting Decrease |
Level of Business Activity | 4.4 | 20.6 | 31.9 | 40.7 | 27.5 |
Oil Production | 3.3 | 29.3 | 34.4 | 34.4 | 31.1 |
Natural Gas Wellhead Production | 9.0 | 13.5 | 38.2 | 32.6 | 29.2 |
Capital Expenditures | 6.7 | 25.0 | 38.9 | 28.9 | 32.2 |
Expected Level of Capital Expenditures Next Year | 16.6 | 36.6 | 43.3 | 30.0 | 26.7 |
Supplier Delivery Time | –15.7 | –9.9 | 7.9 | 68.5 | 23.6 |
Employment | 4.4 | 16.3 | 18.7 | 67.0 | 14.3 |
Employee Hours | 2.3 | 11.9 | 15.6 | 71.1 | 13.3 |
Wages and Benefits | 41.7 | 48.4 | 50.5 | 40.7 | 8.8 |
Finding and Development Costs | 25.3 | 37.3 | 42.9 | 39.6 | 17.6 |
Lease Operating Expenses | 37.1 | 43.9 | 50.6 | 36.0 | 13.5 |
| Indicator | Current Index | Previous Index | % Reporting Improved | % Reporting No Change | % Reporting Worsened |
Company Outlook | –7.1 | 32.6 | 26.2 | 40.5 | 33.3 |
| Business Indicators: O&G Support Services Firms Current Quarter (versus same quarter a year ago) | |||||
| Indicator | Current Index | Previous Index | % Reporting Increase | % Reporting No Change | % Reporting Decrease |
Level of Business Activity | –6.3 | 6.4 | 42.6 | 8.5 | 48.9 |
Utilization of Equipment | –17.1 | 6.5 | 34.0 | 14.9 | 51.1 |
Capital Expenditures | 10.9 | 26.1 | 41.3 | 28.3 | 30.4 |
Supplier Delivery Time | –4.3 | 8.7 | 19.1 | 57.4 | 23.4 |
Lag Time in Delivery of Firm's Services | 0.0 | –2.2 | 12.8 | 74.5 | 12.8 |
Employment | 12.8 | 17.0 | 36.2 | 40.4 | 23.4 |
Employment Hours | –4.4 | 23.5 | 32.6 | 30.4 | 37.0 |
Wages and Benefits | 69.5 | 70.2 | 71.7 | 26.1 | 2.2 |
Input Costs | 65.2 | 63.1 | 71.7 | 21.7 | 6.5 |
Prices Received for Services | 10.8 | 27.7 | 39.1 | 32.6 | 28.3 |
Operating Margin | –22.2 | 0.0 | 22.2 | 33.3 | 44.4 |
| Indicator | Current Index | Previous Index | % Reporting Improved | % Reporting No Change | % Reporting Worsened |
Company Outlook | –8.7 | 20.5 | 37.0 | 17.4 | 45.7 |
Activity Chart

Comments from Survey Respondents
These comments are from respondents’ completed surveys and have been edited for publication. Comments from the Special Questions survey can be found below the special questions.
Exploration and Production (E&P) Firms
- The big question is will OPEC+ be able to keep the price of crude oil up?
- The rumored thawing of investor appetite has yet to be seen by our firm. Many, or most, large scale institutional investors have abandoned energy on moral grounds, which is difficult, if not impossible, to reverse. Less capital is available to E&P firms, which will restrict supply materially relative to global demand (recent supply notwithstanding). Simply put, no one wants to invest. It's hard to blame them.
- Weakening oil prices below $70 per barrel and near-zero residue gas prices in the Permian, along with weak natural gas liquids prices, will limit capital investment in 2024, as it is determined by operating cash flow.
- We are still worried about the current political climate and turmoil in the Middle East.
- Significant downward pressure and volatility in commodity prices since February 2022 without commensurate decreases in service costs is driving margin erosion and difficulty in budgeting and/or planning.
- Access to goods and services has improved, albeit at a higher cost. The hidden costs of doing business are going through the roof. Regulations, insurance, etc. The real hidden cost is the political football we have become. This is nothing new, except now it's a full-time political sport. Further, it's not like the old days when people simply griped about the price of gasoline. They are now calling for the complete elimination of one of the most critical components of our economy. While I know it isn't possible, and will not happen, it provides a stiff headwind for small operators today like myself in raising new capital for new projects. Those are the most serious costs we currently face. I've done this for 47 years and have seen many price and/or cost cycles, and I can predict the future: No capital deployed to replace production leads to shortages and price hikes, which appear overnight. It's a classic commodity cycle, but now with the artificial injection of taxpayer and/or ratepayer money, which confuses capital markets, you don't have to be an economist to know that this has absolutely no potential to end well.
- The administration’s continued war on the petroleum industry has an effect for sure, but we're seeing that the real word needs our industry, and the public is trumping the downward pressure the administration is trying to maintain.
- Increases in interest rates are starting to affect activity. We see demand as normal, but oversupply is more of an issue that has downward pressure on the price of oil around the world.
- Natural gas prices are very soft. Natural gas demand and the pipeline network need to significantly increase.
- The policies of the administration continue to present significant headwinds especially for smaller independents. Access to capital is constrained for small projects less than $50 million in size. Natural gas prices are a big wet blanket on cash flow, and cash flow is what fuels small independent producers.
- World economic outlook, OPEC+ behavior and weather are all significant overprints on our business. Public policy is also a growing concern, particularly as it relates to U.S. Environmental Protection Agency mandates and U.S. Securities and Exchange Commission climate disclosure. These are regulatory detours rather than critical business roadblocks. Overall, poorly crafted energy policies will be good for our business in the long term and bad for the consumer.
- The cost to operate has increased. Field activity costs are up. The labor market is thin, and that puts pressure on wages. Due to lower rig counts, our workers are of a higher quality and experience level.
- The significant fluctuations in oil and gas pricing cause smaller operators a bit of hesitation in planning for the future. There is no significant change in costs yet. Future plans are based on oil recovery.
Oil and Gas Support Services Firms
- The consolidation of operators will impede the growth and sustainability of the oilfield service sector. This will lead to the demise of small independent oil and gas operators, as they will be unable to obtain reasonable pricing from the few remaining service providers. Valuable hydrocarbon assets will be stranded, thus denying local communities a stable tax base. Large recent acquisitions should only allow for the top 80 percent of core properties of the company’s assets and/or leases to be purchased, leaving the bottom 20 percent in the selling company for a more efficient management of those assets. The Federal Trade Commission should adopt a policy that would stop the wholesale purchases of these large companies as it is detrimental to the energy health of the nation and economic stability to our communities.
- Consolidation by the producers and/or oil companies has had a direct impact on the rig count and need for our services.
- Inflationary pressures continue for capital cost and labor. Supplier lead times are not improving ─ in fact, supply chain issues continue to be problematic. Increased interest rates and/or cost of equity capital, when coupled with increased new asset costs, require substantial increases in what we charge for our services. We are slowing growth to de-lever the balance sheet, which is further straining access to available equipment. This will lead to further increases in the cost of what we charge for our services in the future. Inflationary pressures and serious supply chain bottlenecks remain.
- Fourth quarter 2023 has been slower than expected. Merger and acquisition activity by the big players has made smaller operators, which are our target customers, more cautious in their decisions. This has slowed new business growth. We also saw existing customer work slow when customers were acquired. We are optimistic for second quarter 2024 and cautiously optimistic for first quarter 2024.
- As usual, pricing for our products is in someone else's hands. Political uncertainty is the biggest variable, but the honeymoon with electric vehicles is over, and the recognition of reliance on fossil fuels will be in our favor.
- The outlook is good, and work is continuing in leasing.
- The recent decline in the oil price and a more negative economic outlook are possible headwinds for clients’ budgets in 2024.
- Uncertainty remains the largest obstacle to mid-term and longer-term industry investment. It is difficult to see past six months, and the U.S. presidential race is likely to keep the issues obscured in the media clouds. Though production remains resilient, with seemingly lower investment per barrel of oil equivalent produced, the reality might be obscured by the lower cost of working through drilled but uncompleted well inventory and new production from large projects sanctioned pre-COVID. Eventually, both pools will run dry without new investments.
- Onshore seismic continues to provide value throughout the energy complex, be it exploration, production or now CCUS. Exploration seems to be returning to the oil patch. Data and information are still key to minimize risk and optimize return.
- Regulatory policies in the U.S. continue to have negative effects on demand for our services and rising operating costs.
Questions regarding the Dallas Fed Energy Survey can be addressed to Michael Plante at Michael.Plante@dal.frb.org or Kunal Patel at Kunal.Patel@dal.frb.org.
Sign up for our email alert to be automatically notified as soon as the latest Dallas Fed Energy Survey is released on the web.