
State and local governments rake in surpluses after pandemic
State and local governments accumulated $1.3 trillion in excess savings during the pandemic recession and subsequent recovery, from first quarter 2020 to second quarter 2023. Much of this excess is due to large federal transfers and high tax receipts relative to prepandemic trends.
While excess household savings have been credited with helping support U.S. economic resiliency throughout 2023, households were not alone in amassing excess savings after the pandemic. The existence of large sums in state and local government coffers runs counter to historic post-recession trends. State and local governments usually grapple with budget shortfalls due to rising social program demands and weak revenue streams following recessions.
Spending deadlines, along with requirements about how the funds should be used, accompanied most federal pandemic relief funds distributed to state and local governments. Additionally, many state and local governments face political pressure to pass accumulated non-pandemic relief funds along to households via transfers or tax cuts, for example. These factors may lead to sizeable drawdowns in state and local government excess savings over the next few years.
Diving into the source of excess savings
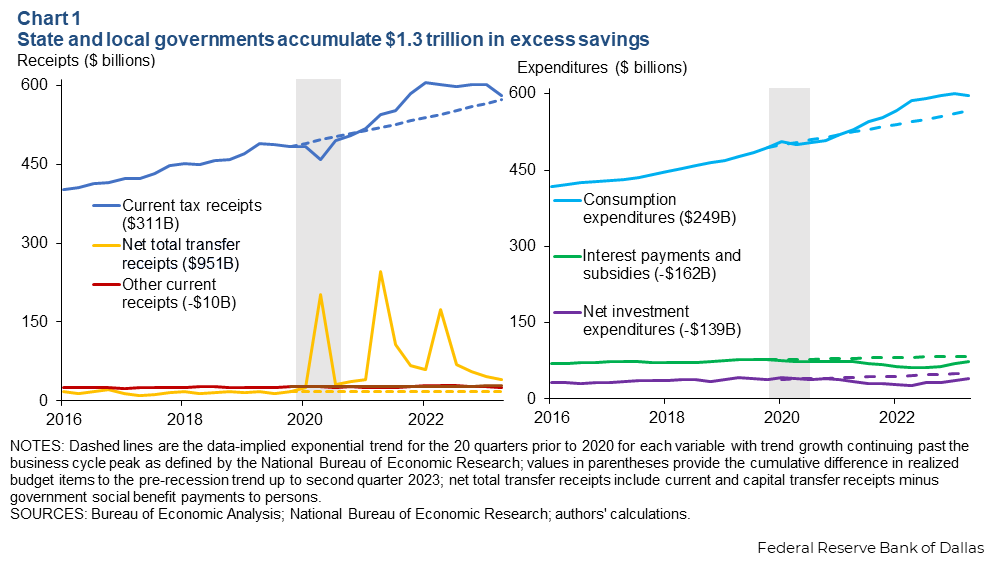
Chart 1 summarizes the contributing factors to the excess savings accumulation. The left panel shows state and local government receipts; the right panel shows expenditures. Dashed lines provide reference trend lines based on the average growth rate during the 20 quarters before the 2020 recession. These lines provide context for how funding and expenditures grew beginning in the first quarter of 2020.
We compute state and local government excess savings by comparing realized outcomes to these prepandemic trends. Excess savings equals excess revenue minus excess expenditure. Excess revenue is the sum of realized state and local government receipts differences relative to prerecession trends from the first quarter of 2020 to the second quarter of 2023. Excess expenditure is defined similarly.
During normal times, state and local governments receive large federal transfers in the form of grants in aid that are passed on as social benefit payments to targeted households, such as for Medicaid or the Supplemental Nutrition Assistance Program.
During the pandemic, the federal government benefit payments rose because of expanded social safety net programs included in the Coronavirus, Aid, Relief and Economic Security Act (CARES) and the American Rescue Plan. Each of these laws also included allocations to state and local governments to be used for spending outside of social welfare benefit payments.
To isolate state and local government receipts and expenditures since 2020 from federal social safety net expansion, we subtract social benefit payments to individuals from total transfer receipts. We refer to this series as “net total transfer receipts.” Excess net total transfer receipts totaled $951 billion as of the second quarter of 2023.
How did the pandemic relief bills contribute to the excess state and local government net total transfer? A total of 60 percent of excess state and local government net total transfer receipts came over three years: $185 billion in the second quarter of 2020, $228 billion in the second quarter of 2021 and $157 billion in the second quarter of 2022. The first two periods are the quarters following the approval of CARES and the American Rescue Plan. The rise in the third period reflects the allocation of Coronavirus State and Local Recovery Funds—a part of the American Rescue Plan for public programs to overcome pandemic impacts.
Other excess revenue for local governments came from higher tax receipts, $311 billion as of the second quarter of 2023, due to a rebound in sales and excise tax receipts after 2020 and large increases in personal and corporate income tax receipts in 2021 and 2022.
State and local government expenditures have declined relative to prepandemic trends despite $249 billion in excess consumption expenditures. The sum of net investment expenditures, such as repairs to bridges and roads or the construction of new education facilities, and interest and subsidy payments is $301 billion below prepandemic trends in total from the first quarter of 2020 to the second quarter of 2023. On net, state and local government expenditures are $52 billion below the prepandemic trend as of the second quarter of 2023.
In total, when compared to prepandemic trends, state and local government current tax receipts have more than outpaced expenditures by $353 billion (net of miscellaneous current receipts such as interest income on financial assets), and that amount is independent of excess net total transfer receipts. Together with the $951 billion in excess net total transfer receipts, state and local governments have approximately $1.3 trillion in estimated excess savings.
Note that these calculations do not consider the distribution of excess savings to state and local governments and how they managed them. For example, municipalities that finance their budgets with local sales tax revenue may not benefit from excess savings attributable to higher-than-expected state income tax receipts. (Texas, for example, has no state income tax.) States with sizeable income tax revenue may be swimming in surpluses.
Regardless, the $353 billion in excess savings above the excess net total transfer receipts comes with very few strings attached. State and local governments may be subject to local constraints such as balanced budget amendments, but apart from some pandemic relief dollars, these entities largely get to decide what to do with these funds.
Excess savings accumulation after the 2020 recession differs from precedent
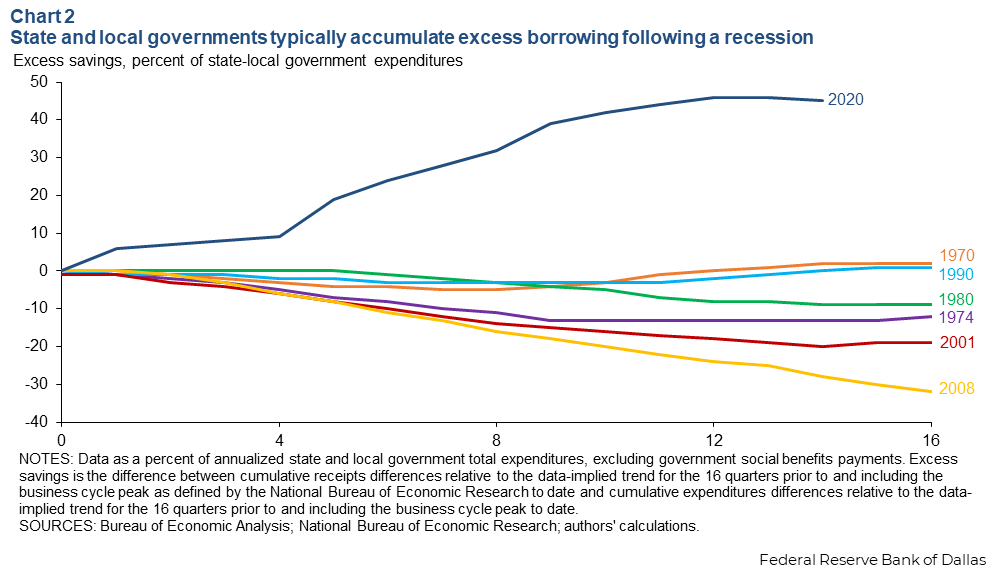
State and local governments do not typically accumulate excess savings following a recession (Chart 2). Currently, these funds total 45 percent of annualized net total expenditures, excluding government social benefit payments to individuals. In every other recession from the 1970 downturn to before 2020, state and local governments became excess borrowers, as they tried to navigate mostly larger than expected short-term deficits.
State and local governments are in an unprecedented financial position as they continue to spend pandemic relief funds, and some entities are considering developing avenues to transfer government funds to households via direct transfers and tax cuts. The ultimate use of excess savings may depend on the locality. For example, many entities ran persistent deficits before the pandemic and face large employee pension liabilities in the coming years and could use the funds to close these gaps.
About the authors

Ron Mau is a senior business economist in the Research Department at the Federal Reserve Bank of Dallas.

Fang Yang is an economic policy advisor and senior economist in the Research Department at the Federal Reserve Bank of Dallas.
The views expressed are those of the authors and should not be attributed to the Federal Reserve Bank of Dallas or the Federal Reserve System.


