
Lower interest rates don’t necessarily improve housing affordability
The benchmark 30-year fixed-rate mortgage increased from around 3 percent in December 2021 to nearly 7 percent two years later, a result of the Fed’s rapid monetary tightening.
As homebuyers faced sharply rising mortgage payments, questions followed about housing affordability. According to the National Association of Realtors, housing affordability declined almost 30 percent since December 2021, close to levels last seen in the late 1980s (Chart 1).
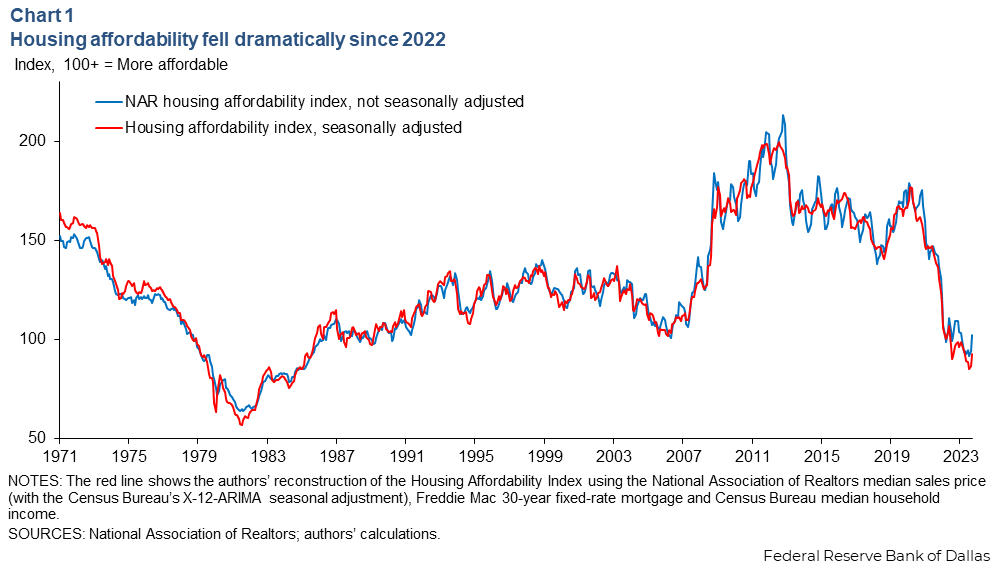
The direct impact of higher mortgage rates on housing affordability has received much attention. We emphasize that housing affordability not only depends on mortgage rates but also on house prices, which have competing effects. For example, when interest rates increase, house prices tend to decline. We present decompositions of housing affordability, showing the relative importance of the two competing effects matters, and lower interest rates do not necessarily improve housing affordability.
Most homeowners largely unaffected
Before considering the changes in housing affordability, it is important to note that the fraction of homebuyers is small relative to the population of homeowners. In Black Knight McDash mortgage-servicing data, for example, the annual home-purchasing rate is between 3 percent and 10 percent.
Also, most homeowners locked in ultra-low mortgage rates before rates increased. As of September 2023, the rate paid by the average homeowner was only 3.9 percent, compared with 7 precent on new mortgages. This means most homeowners have been generally unaffected by higher mortgage rates.
How to measure affordability
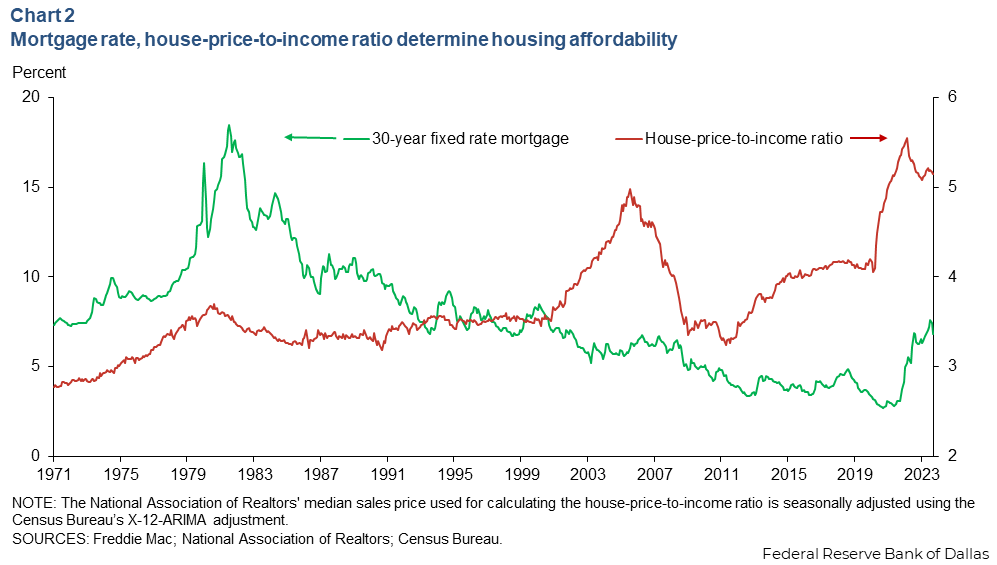
A common measure of homebuyer affordability is the Realtors’ Housing Affordability Index (HAI). The index measures whether a typical (median income) family would qualify for a mortgage on a typical (median price) home. Qualifying income is defined as the amount equivalent to 48 monthly payments on a 30-year fixed-rate mortgage with a 20 percent downpayment. More formally, the index can be written as

where f(r) depends only on the mortgage rate, r. When the mortgage rate increases, f(r) falls. Thus, the index is determined by two variables: the house-price-to-income ratio and the mortgage rate. A higher value of either variable reduces housing affordability. Chart 2 shows recent low affordability is driven by both variables.
Quantifying the drivers of affordability
As a first attempt to quantify the drivers of housing affordability, Chart 3 plots two counterfactual HAI paths. One fixes the house-price-to-income ratio at its average to isolate the interest rate channel, and one fixes the 30-year fixed-rate mortgage at its average to isolate the house price channel.
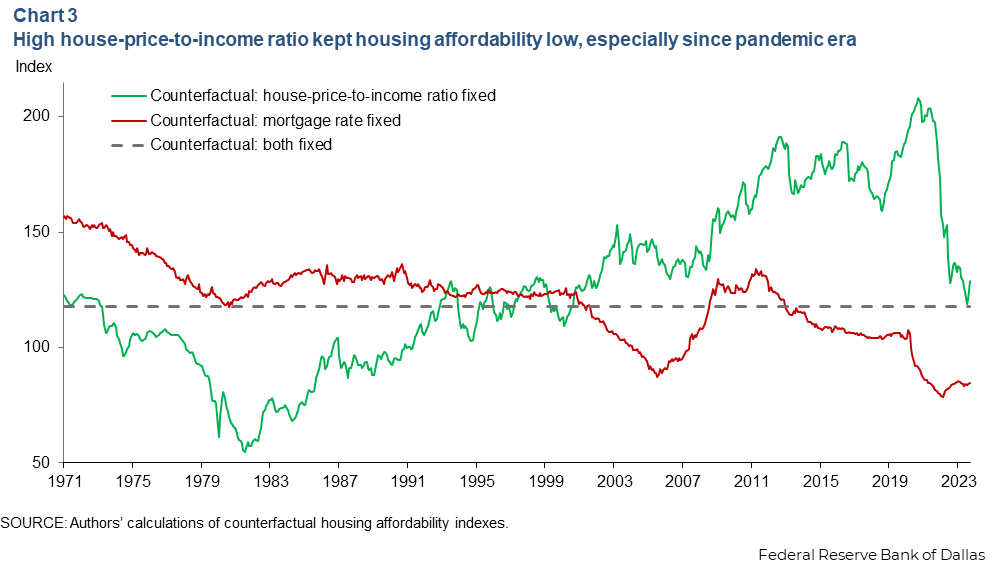
Before 2000, the house-price-to-income ratio was relatively low, supporting housing affordability. After 2000—except for the brief period of the housing bust from 2008 to 2012—the high price-to-income ratio lowered housing affordability. In the postpandemic period, there was such a large increase in house prices that housing affordability would have declined even if mortgage rates stayed at their average.
The drawback with these counterfactuals is that they assume house prices and interest rates move independently. For example, one could conclude that, had the Fed not raised the federal funds rate in early 2022, housing affordability would not have declined further, as house prices largely stabilized after mid-2022. This view ignores the effect of rate changes on house prices.
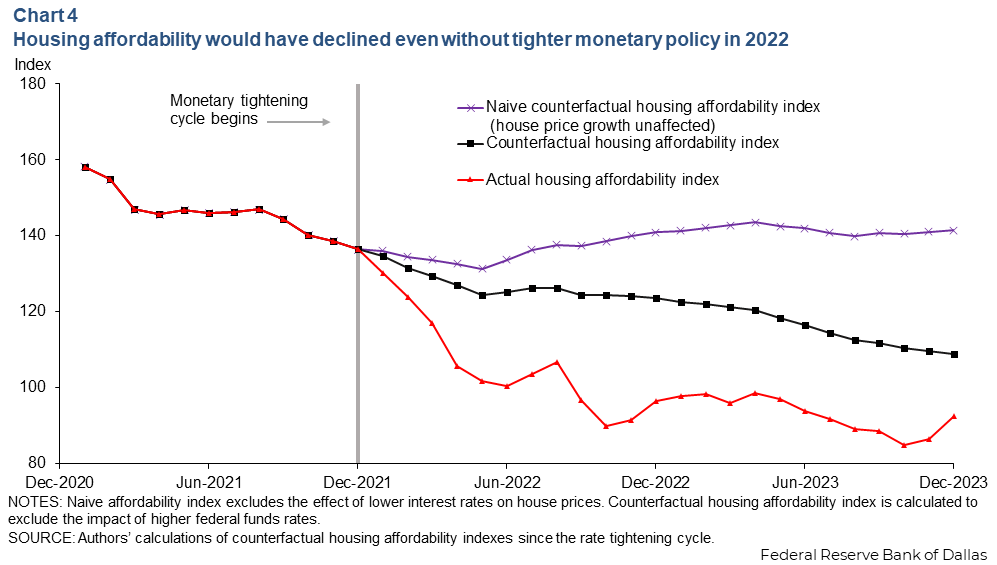
Recent estimates suggest a 1-percentage-point increase in the short-term interest rate lowers house prices by 7.5 percent over two years. We use this estimate to construct proper counterfactuals, focusing on HAI in the recent monetary tightening cycle. Specifically, we ask how HAI would have evolved if monetary policy did not tighten and the 30-year fixed-rate mortgage stayed at its December 2021 level.
In this counterfactual, house prices would have risen faster, lowering housing affordability. To determine the magnitude of this effect, we estimate the size of the monetary tightening shocks and calculate a counterfactual path of house prices without these shocks.
The size of the shock is defined as the difference between the actual federal funds rate and the median projection in the Fed’s Summary of Economic Projections the year before. For example, in December 2021, the federal funds rate was projected to be 0.9 percent a year later, whereas the actual rate was 4.1 percent. This difference implies a 3.2 percentage point shock in 2022. In 2023, the shock was 0.23 percentage points. Given a cumulative 3.43 percentage point shock over two years, the monthly growth rate of house prices would have been 1.1 percentage points higher (=3.43x7.5/24) than in the actual data.
Chart 4 shows the actual HAI, the counterfactual HAI using this estimate and the naive counterfactual HAI without considering the effect of the lower rate on house prices. The rate increase worsens housing affordability. However, in the absence of rate hikes, affordability would have still declined after 2022.
Larger-than-expected rate cuts don’t always improve housing affordability
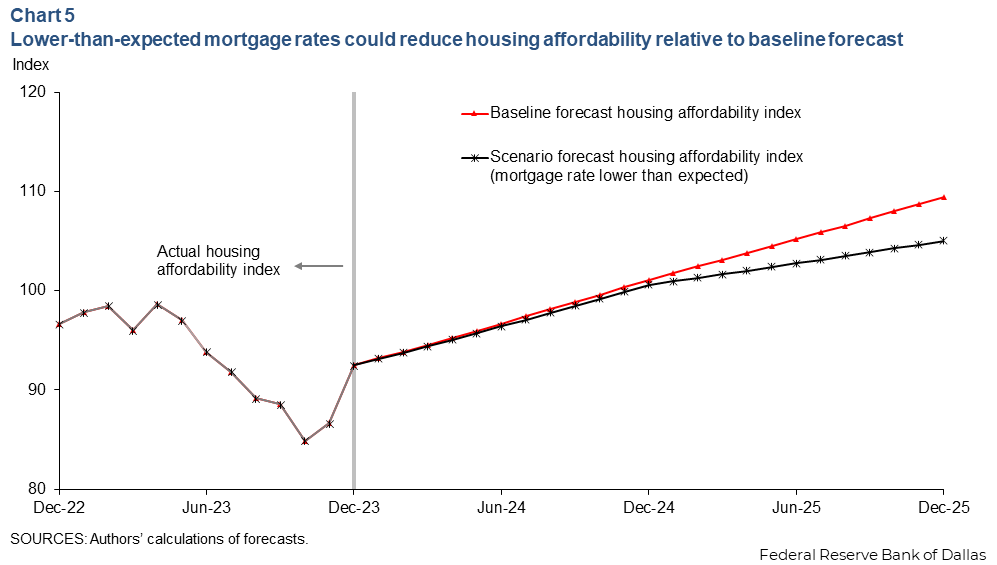
Given the current low affordability of housing, it makes sense to ask how the situation might change if interest rates fell and were lower than expected. To answer this question, we first need to develop a baseline HAI forecast.
We assume household income continues to grow at the 2023 rate of 4.2 percent and home prices rise 2.8 percent based on the 2024 forecast from CoreLogic, a real estate analytics firm. The 30-year fixed-rate mortgage will end 2024 at 6.1 percent and 2025 at 5.5 percent, based on Mortgage Bankers Association forecasts. Under these assumptions, there is a gradual increase in housing affordability.
For the counterfactual experiment, we assume income grows at the same rate as the baseline, but the federal funds rate path is 1 percentage point lower than expected. This implies the monthly growth rate of house prices would be 0.3 percentage points higher than the baseline (=7.5/24).
Finally, we assume the lower policy rate path translates to a 30-basis-point decline in the path of the 30-year fixed-rate mortgage, consistent with estimates in the academic literature. This implies a 5.8 percent mortgage rate in December 2024 and 5.2 percent in December 2025. Chart 5 shows the gains in housing affordability from the lower-than-expected policy rate path are offset by the reduction in affordability from higher home prices. In fact, the price effect is strong enough that housing affordability is lower than the baseline forecast.
Mortgage rates influence house prices
Changes in monetary policy directly affect mortgage rates, but there is also an indirect effect on house prices. When monetary policy is easier, mortgage rates tend to fall, while house prices tend to rise due to higher demand. These opposing channels imply that the net effect on affordability is ambiguous and potentially the opposite of what intuition based solely on mortgage rates would suggest.
About the authors


