Austin Economic Indicators

January 10, 2022
The Austin economy continued to expand in November. The Austin Business-Cycle Index increased, led by solid employment gains and a lower unemployment rate. The labor force also posted strong growth. Since mid-December, however, COVID-19 hospitalizations have surged. Housing affordability improved in the third quarter, and existing-home sales were positive in November.
Business-cycle index
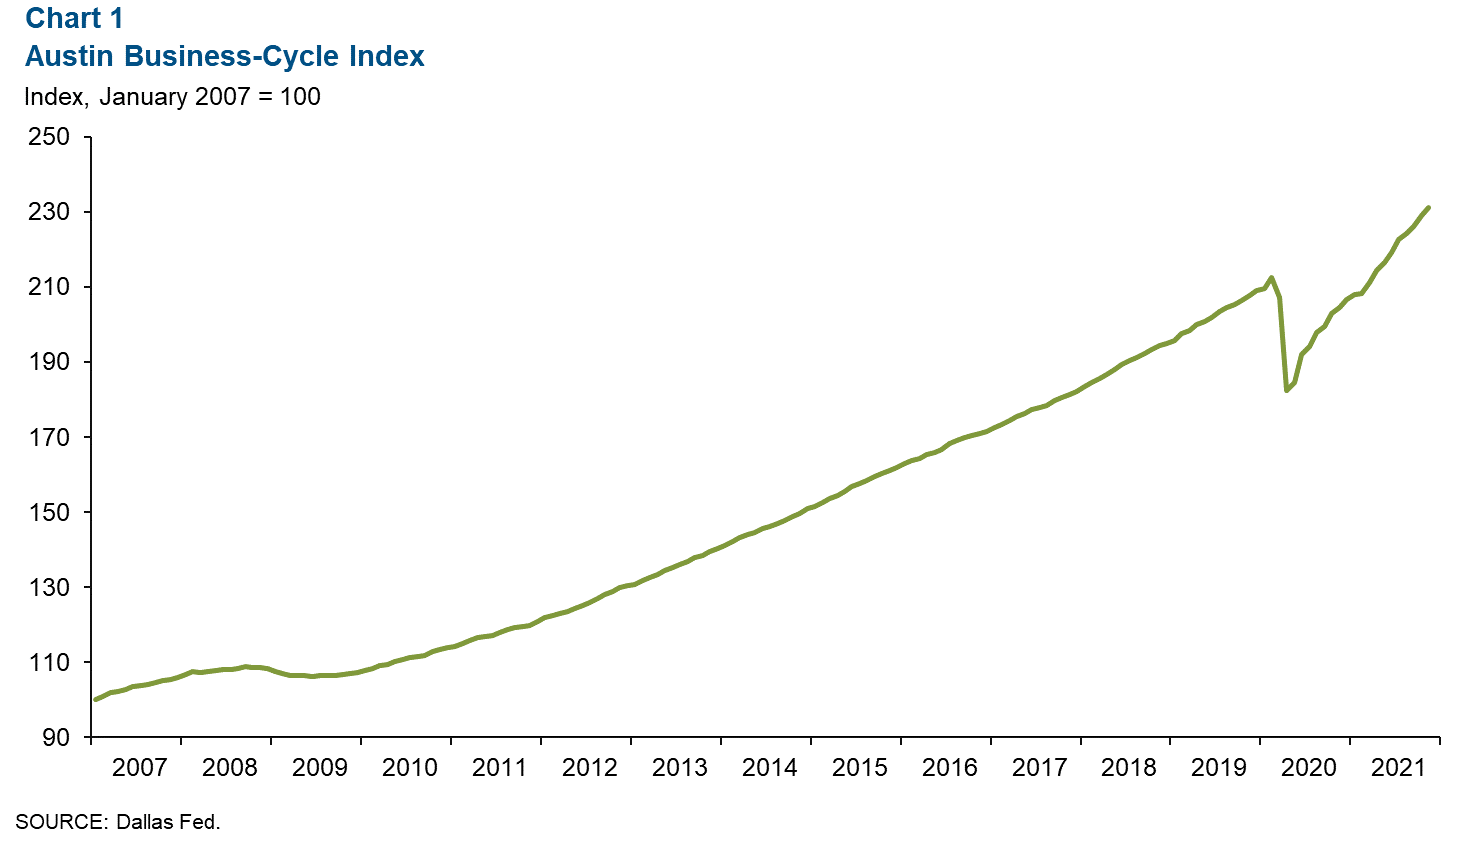
The Austin Business-Cycle Index—a broad measure of economic activity—rose an annualized 12.0 percent in November after growing a robust 16.8 percent in October (Chart 1).
Labor market
Unemployment rate ticks down
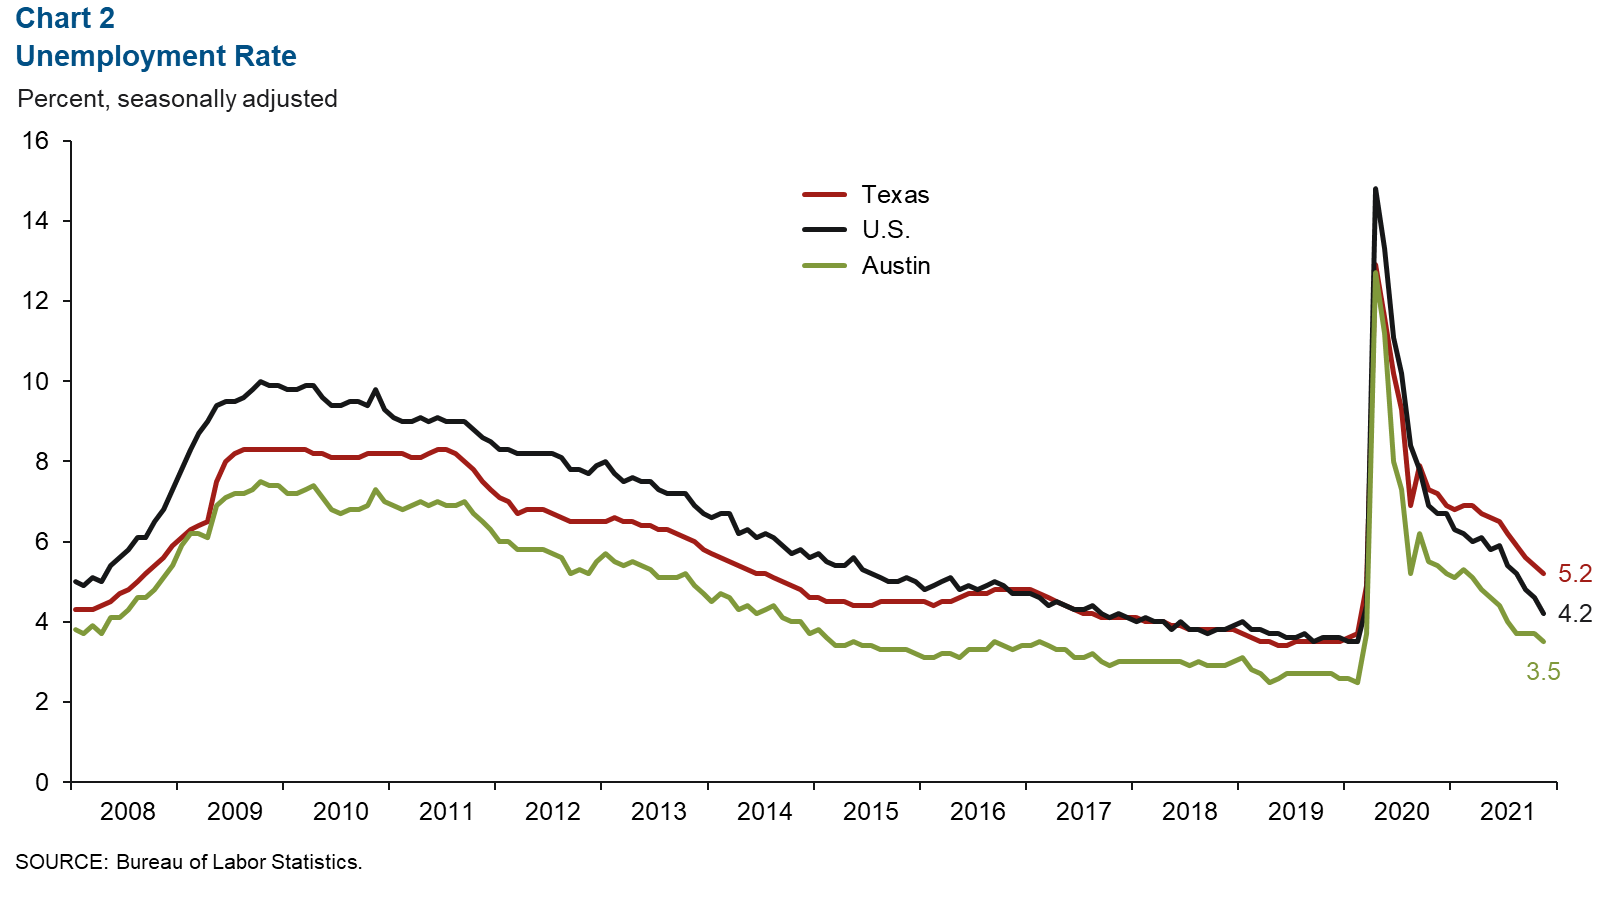
Austin’s unemployment rate dropped to 3.5 percent in November, the lowest since February 2020 (Chart 2). This is well below the state’s jobless rate of 5.2 percent and the nation’s rate of 4.2 percent. The metro labor force grew strongly at 7.6 percent in the three months ending in November—well above the state’s 3.6 percent increase and the nation’s 1.5 percent uptick.
Payroll gains positive across most sectors
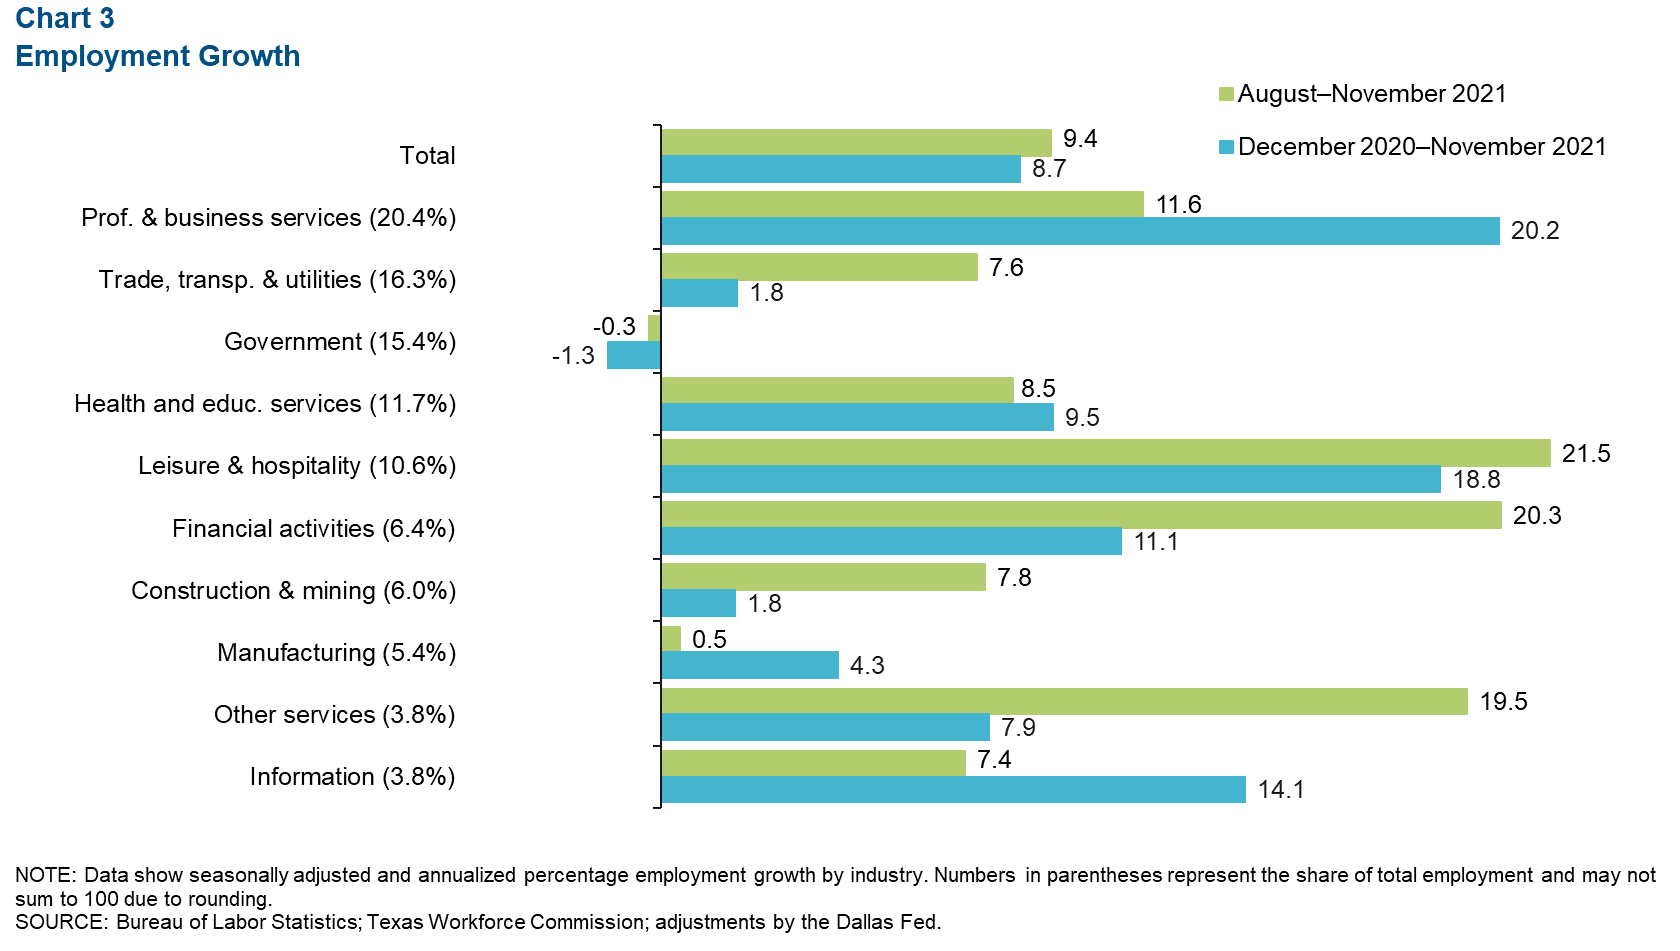
Austin employment strengthened an annualized 9.4 percent, or by 26,671 net jobs, in the three months ending in November (Chart 3). Leisure and hospitality led the growth (up 21.5 percent, or 6,062 jobs) and was followed by financial activities (up 20.3 percent, or 3,485 jobs) and other services (up 19.5 percent, or 1,976 jobs). The only sector with a net contraction was government (down 0.3 percent, or 128 jobs). As of November 2021, Austin payrolls were 4.7 percent above February 2020 levels; by May 2021, the region had recovered all 140,707 jobs lost at the onset of the pandemic.
COVID-19 statistics
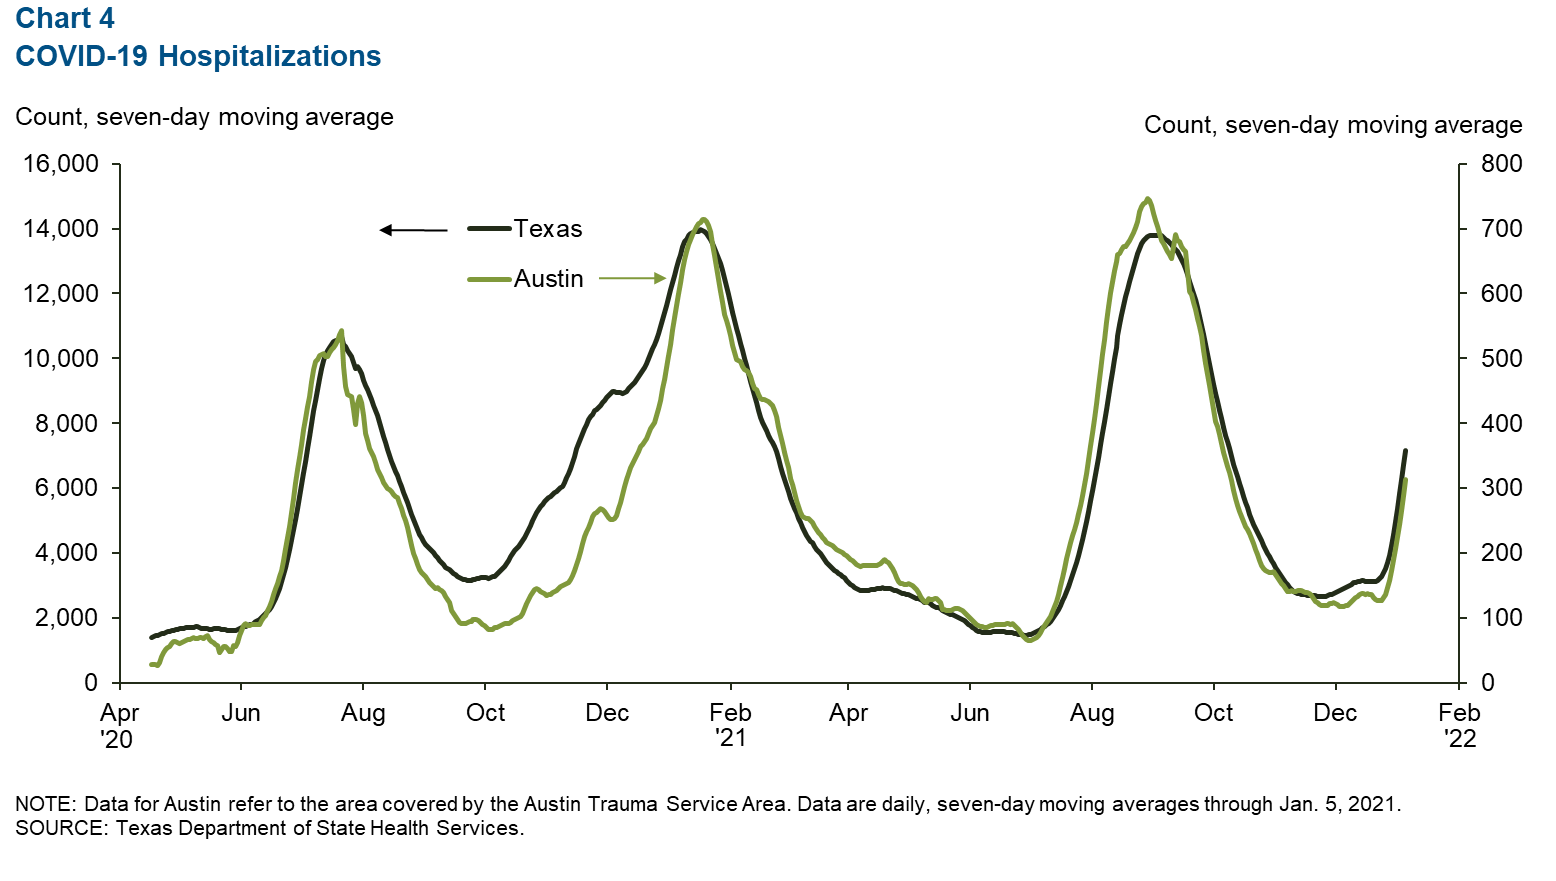
The number of people hospitalized with COVID-19 in Austin started to flatten out in mid-November but has increased sharply since mid-December (Chart 4). At the state level, hospitalizations increased steadily in mid-November and surged in mid-December. As of Jan. 5, 314 people in Austin and 7,173 in the state were hospitalized with COVID-19.
Real estate
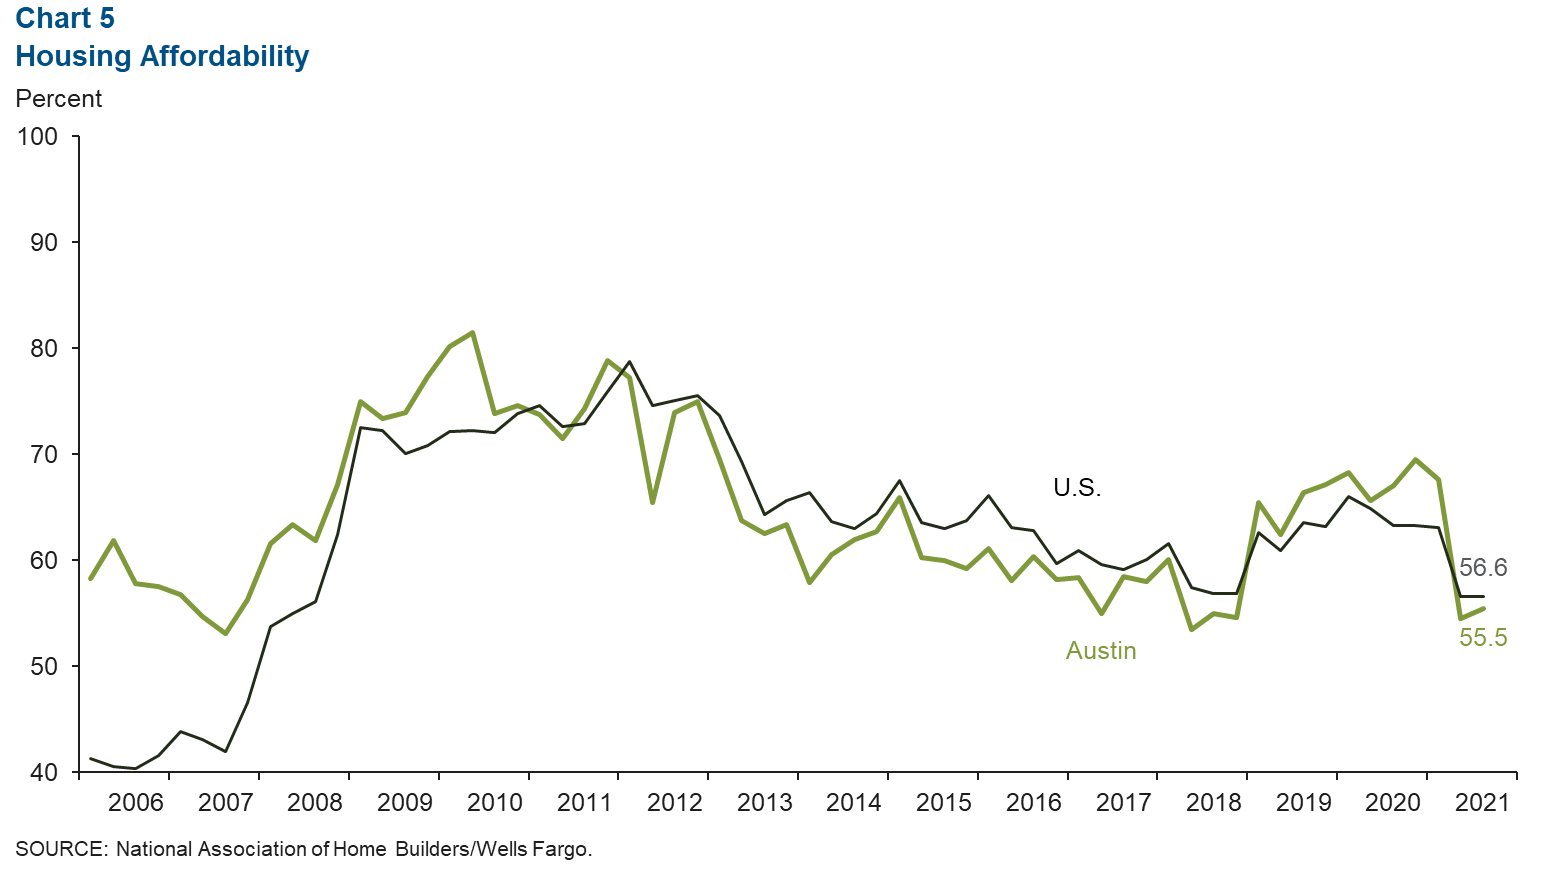
Housing affordability improves
Housing affordability in Austin, defined as the percentage of homes sold that the median-income household can afford, improved slightly to 55.5 percent in the third quarter after falling 13.1 percentage points in the second quarter (Chart 5). Affordability was unchanged at the national level at 56.6 percent. Since the pandemic hit (first quarter 2020), housing affordability has retracted 12.8 percentage points in Austin and 9.4 percentage points in the nation.
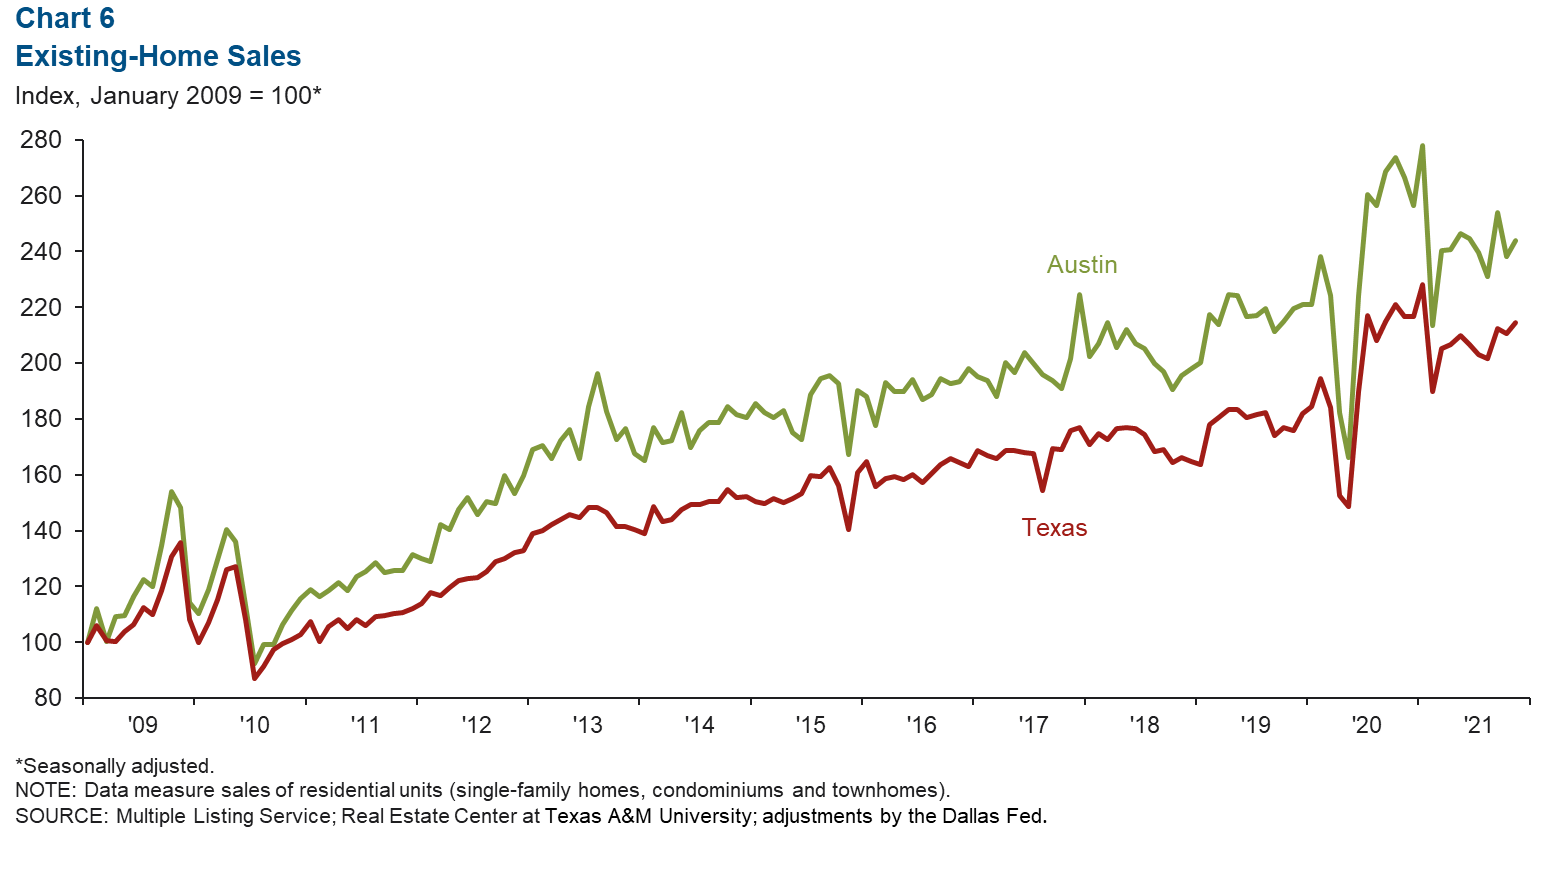
Recent home sales improve
November existing-home sales in Austin expanded 2.3 percent after posting a 6.2 percent contraction in October (Chart 6). This compares with the state’s 1.9 percent gain in November and 0.8 percent decline in October. In the first 11 months of 2021, home sales were up 3.4 percent in the metro and 7.3 percent in the state relative to the same period in 2020. In November, the median price of homes sold was a record high of $480,873 in the metro, a 21.6 percent rise year over year. At the state level, the median price of homes sold was $318,922, a 9.8 percent jump.
NOTE: Data may not match previously published numbers due to revisions.
About Austin Economic Indicators
Questions can be addressed to Judy Teng at judy.teng@dal.frb.org. Austin Economic Indicators is released on the first Thursday of every month.