Austin Economic Indicators

February 4, 2022
The Austin economy continued to expand in December. The Austin Business-Cycle Index increased, led by healthy growth in payrolls and a lower unemployment rate. COVID-19 hospitalizations in Austin peaked in late January and have since started to decline. Permits for new-home construction increased in December, and private sector average hourly earnings continued to trend upward.
Business-cycle index
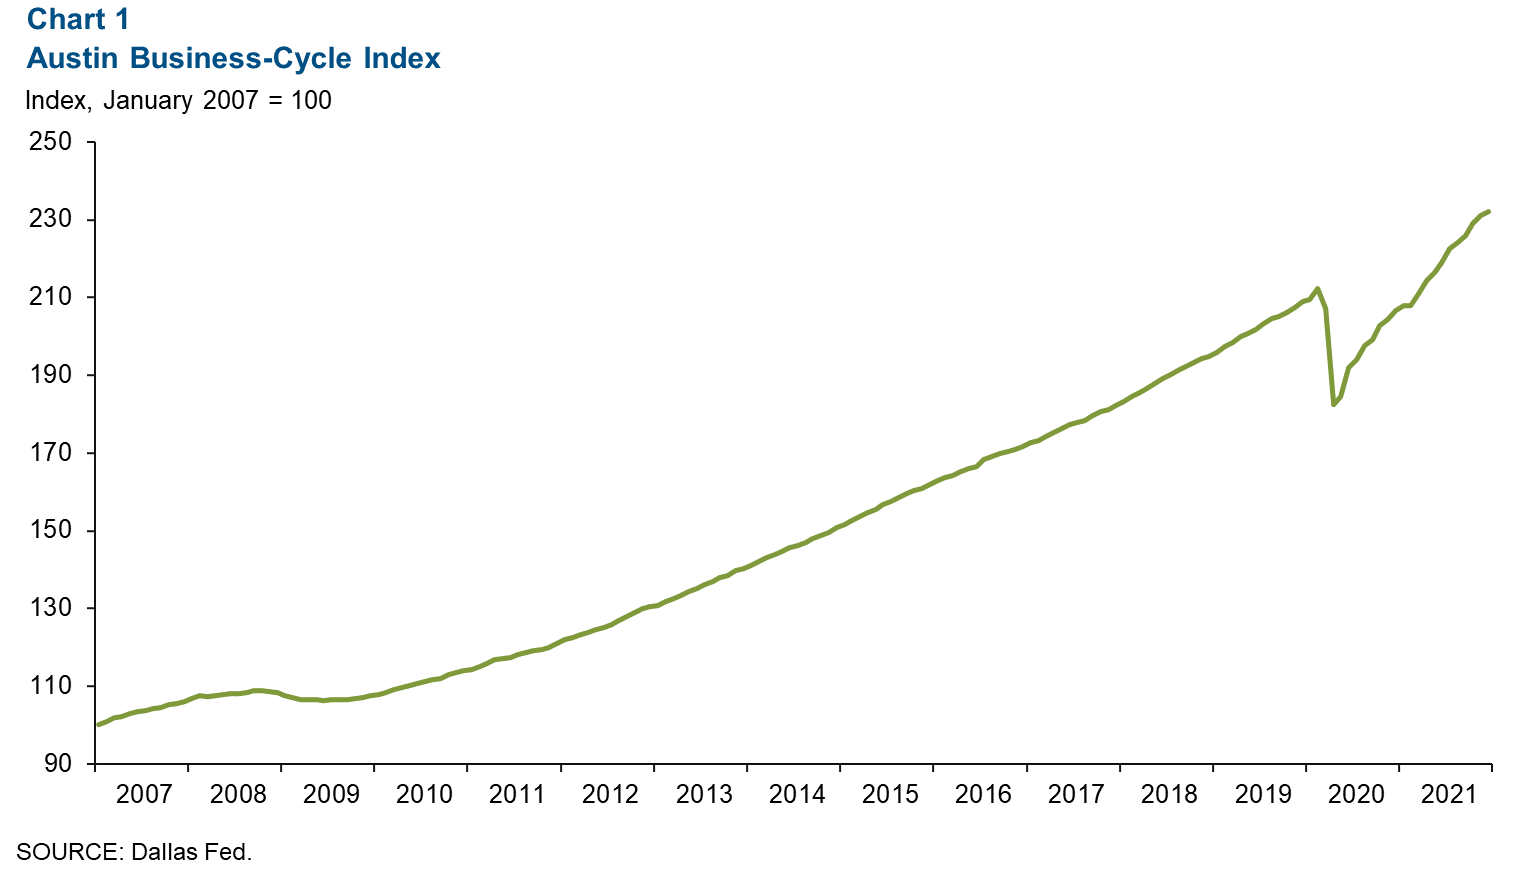
The Austin Business-Cycle Index—a broad measure of economic activity—rose an annualized 5.4 percent in December after growing a robust 12.3 percent in November (Chart 1).
Labor market
Unemployment rate ticks down
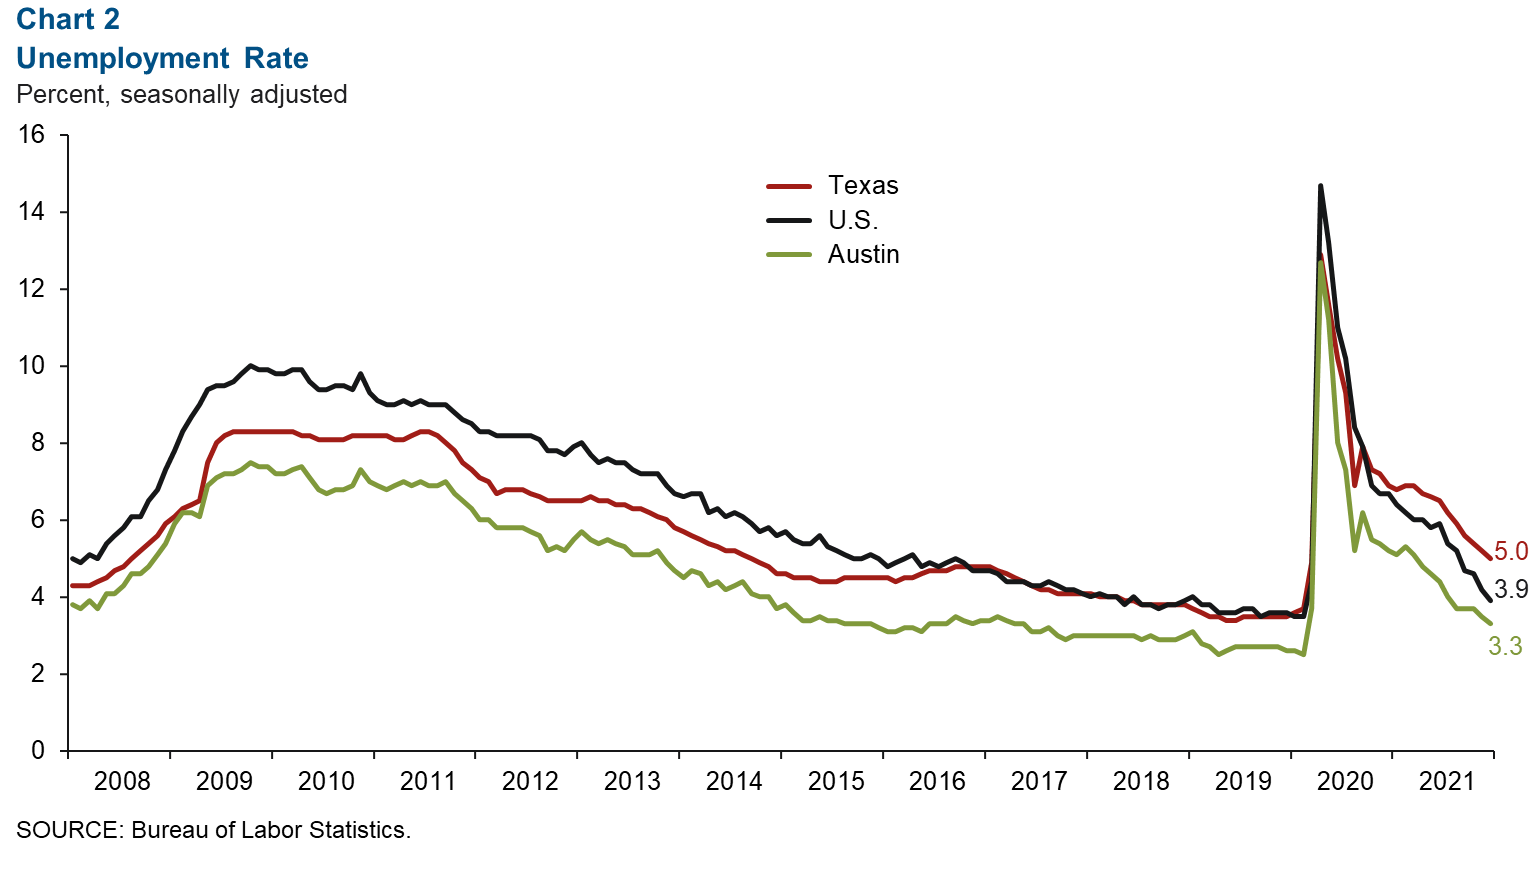
Austin’s unemployment rate dropped to 3.3 percent in December, the lowest since February 2020 (Chart 2). This is well below the state’s jobless rate of 5.0 percent and the nation’s rate of 3.9 percent. Growth in the metro labor force slowed from an annualized 8.3 percent in November to 3.0 percent in December. This compares with the state’s 3.9 percent and the nation’s 1.3 percent labor force growth.
Payroll gains positive across most sectors
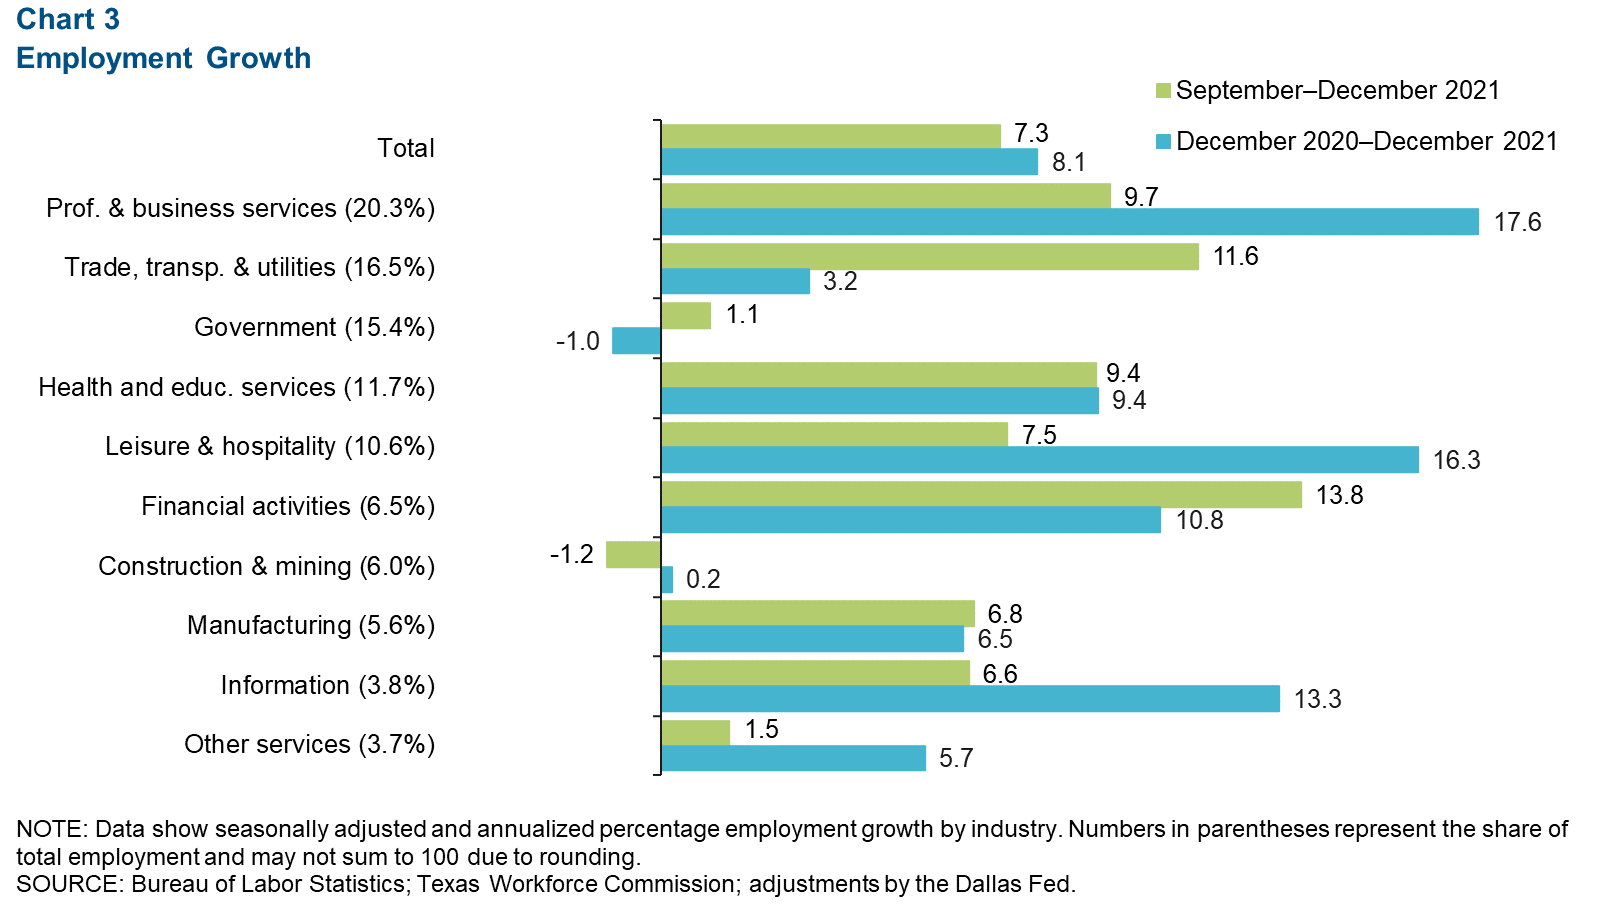
Austin employment increased at a 7.3 percent annualized pace, or by 21,000 net jobs, in the three months ending in December (Chart 3). Financial activities led overall growth (up 13.8 percent, or 2,470 jobs) and was followed by trade, transportation and utilities (up 11.6 percent, or 5,346 jobs), and professional and business services (up 9.7 percent, or 5,555 jobs). The only sector with a net contraction was construction and mining (down 1.2 percent, or 210 jobs). As of December 2021, Austin payrolls are 5.0 percent above February 2020 levels, and year-over-year payrolls increased 8.1 percent. By May 2021, the region had recovered all 140,707 jobs lost at the onset of the pandemic.
COVID-19 statistics
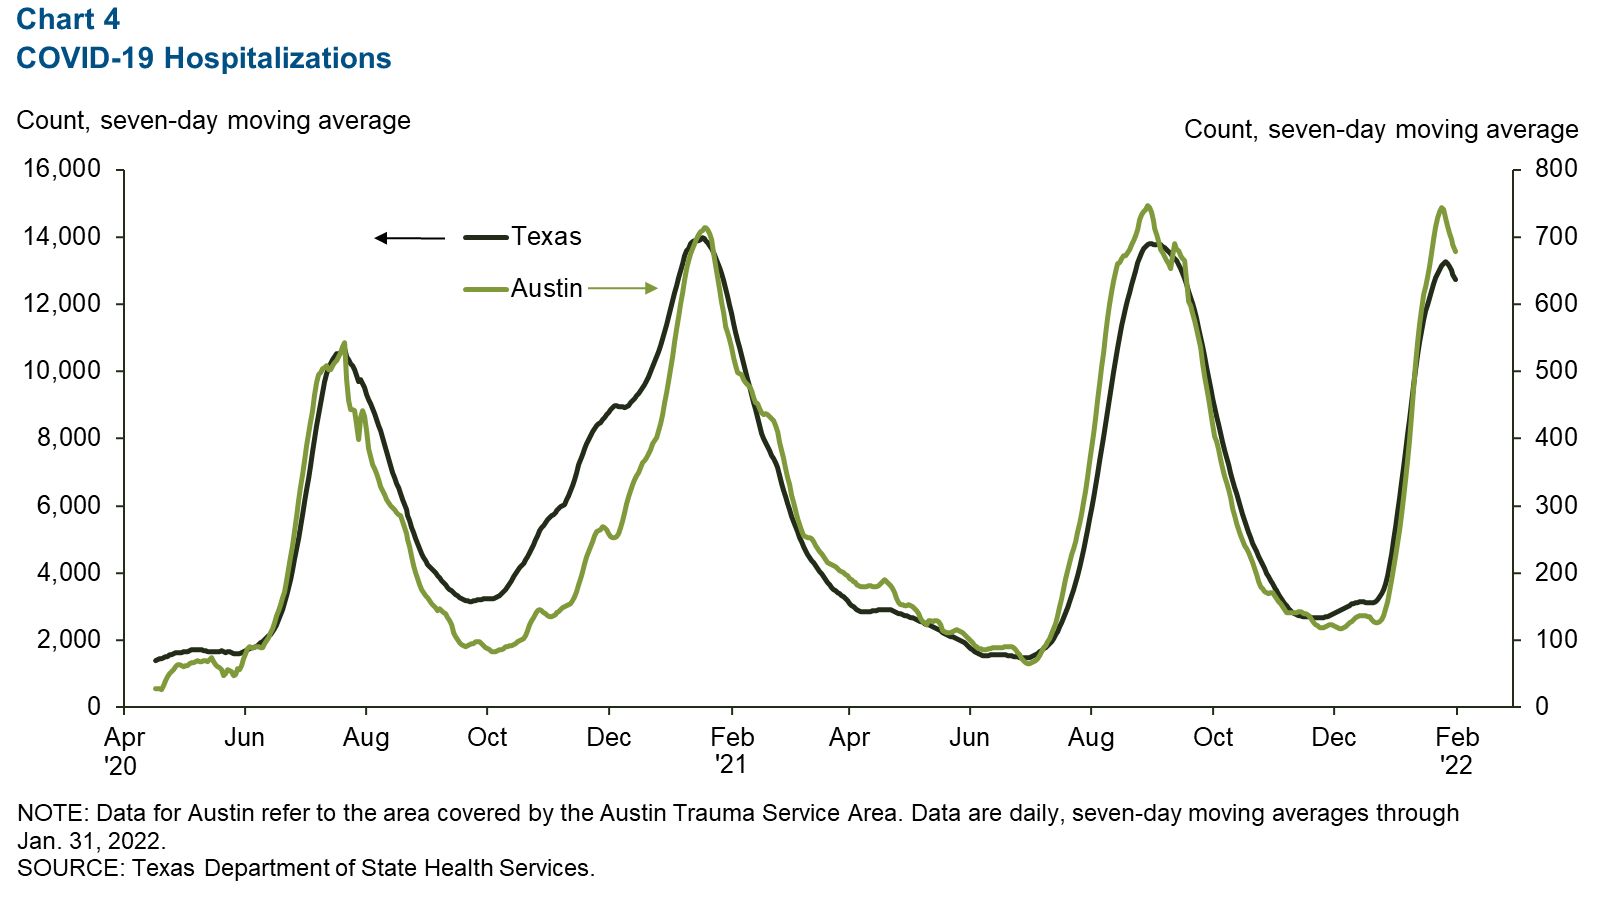
The number of people hospitalized with COVID-19 in Austin and Texas overall dipped at the end of January but remained at high levels following a significant surge due to the omicron variant (Chart 4). As of Jan. 31, 677 people in Austin and 12,719 in the state were hospitalized with COVID-19.
Real estate
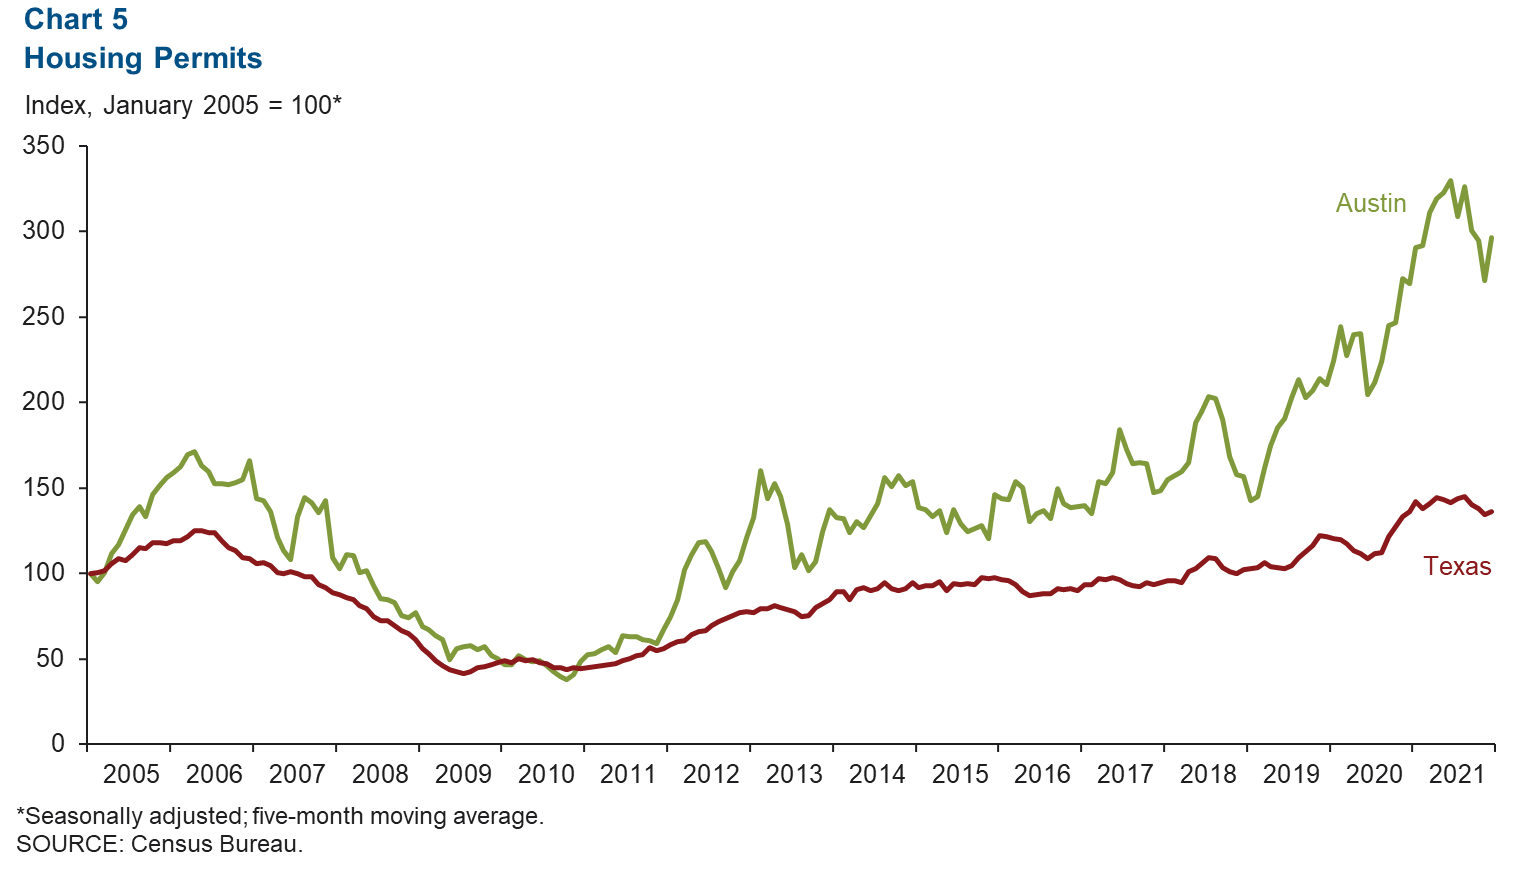
Austin housing permits expanded in December, with the five-month moving average posting a 9.1 percent increase after a 7.9 percent contraction in November (Chart 5). This compares with the state’s 1.2 percent gain in December and 2.4 percent decline in November. Compared with 2020, housing permits were up 23.8 percent in the metro and 14.1 percent statewide. In December, the median price of homes sold was $481,265 in the metro—a 22.1 percent rise year over year. At the state level, the median price of homes sold was $318,404—a 10.7 percent jump.
Wages
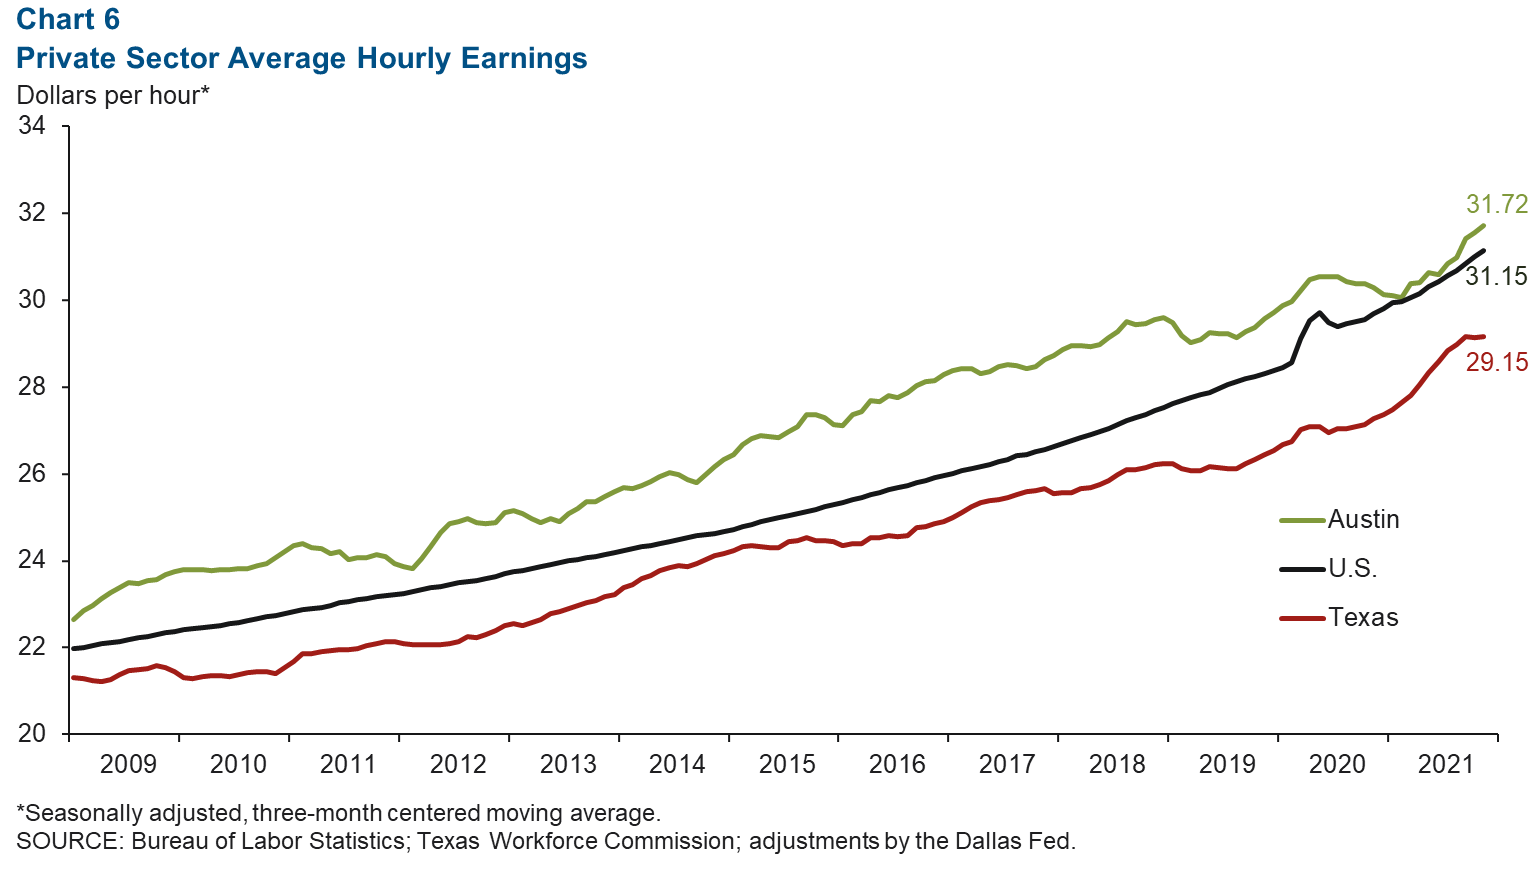
Private sector average hourly wages in Austin continued to show healthy growth in December (Chart 6). Year-over-year wages increased 5.0 percent, and based on a three-month centered moving average, private sector average hourly wages in Austin climbed to $31.72. This compares with a 6.5 percent increase in average hourly wages in Texas.
NOTE: Data may not match previously published numbers due to revisions.
About Austin Economic Indicators
Questions can be addressed to Mytiah Caldwell at Mytiah.Caldwell@dal.frb.org. Austin Economic Indicators is released on the first Thursday of every month.