Austin Economic Indicators

October 5, 2023
| Austin economy dashboard (August 2023) | |||
| Job growth (annualized) May –Aug. '23 |
Unemployment rate |
Avg. hourly earnings |
Avg. hourly earnings growth y/y |
| 1.9% | 3.6% | $33.62 | 3.4% |
In August, Austin’s employment declined and unemployment rose. In addition, layoff notices covered by the Worker Adjustment and Retraining Notification Act (WARN) increased, concentrated in the professional and business services sector. In contrast, wages continued to record strong growth.
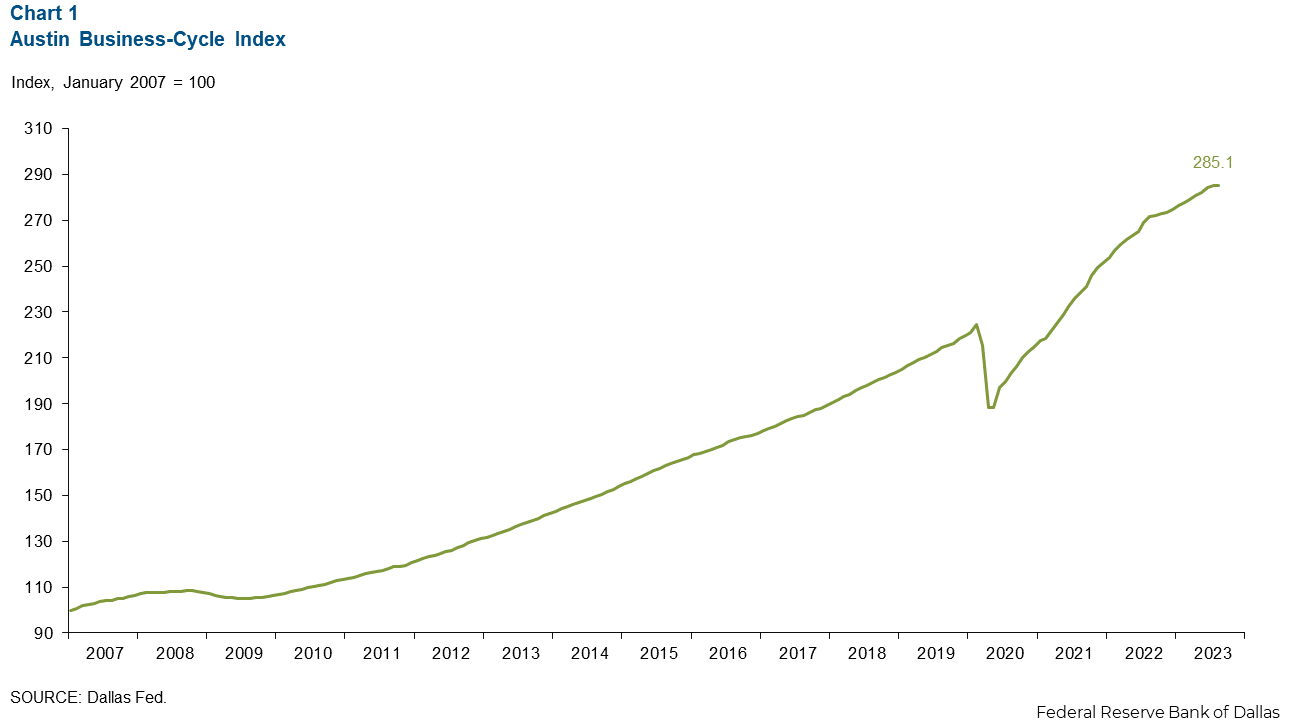
Business-cycle index
The Austin Business-Cycle Index, a broad measure of economic activity, grew an annualized 0.2 percent in August, much slower than the 3.4 percent gain in July (Chart 1).
Labor market
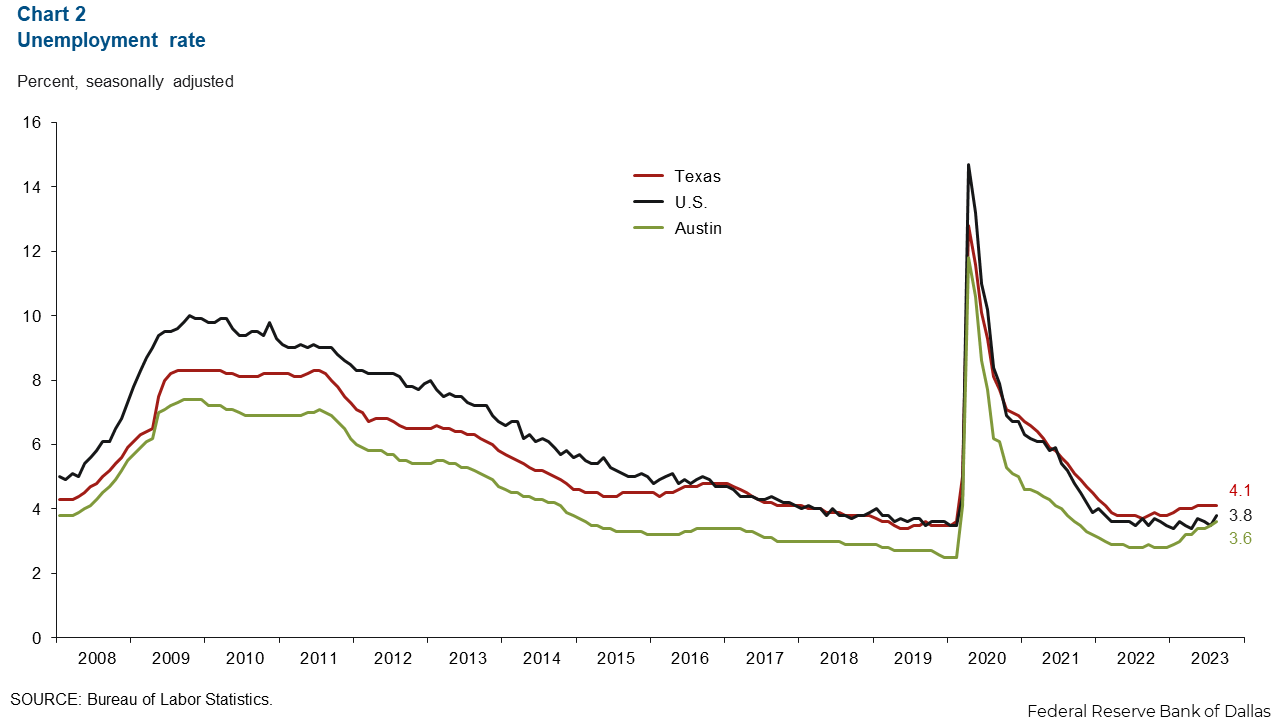
Unemployment continues to rise
Austin’s unemployment rate increased to 3.6 percent in Austin and remained below the state rate of 4.1 percent. Though the rate rose, Austin’s unemployment rate remains lower than the national rate of 3.8 percent (Chart 2). In August, the local labor force increased an annualized 4.2 percent.
Employment sees overall decline
Austin employment fell an annualized 1.9 percent in August, the first month the rate declined since February 2021. In July, employment increased 1.6 percent. Sectors with the greatest decreases were health and educational services (32.4 percent, or 5,033 jobs), leisure and hospitality (11.7 percent, or 1,503 jobs), and financial activities (6.6 percent, or 480 jobs). At the same time, employment increased significantly in construction and mining (23.2 percent, or 1,475 jobs) and government (12.8 percent, or 1,871 jobs) (Chart 3). Year to date, Austin’s payroll employment has grown 3.8 percent, greater than the state at 3.3 percent and the nation at 1.9 percent.
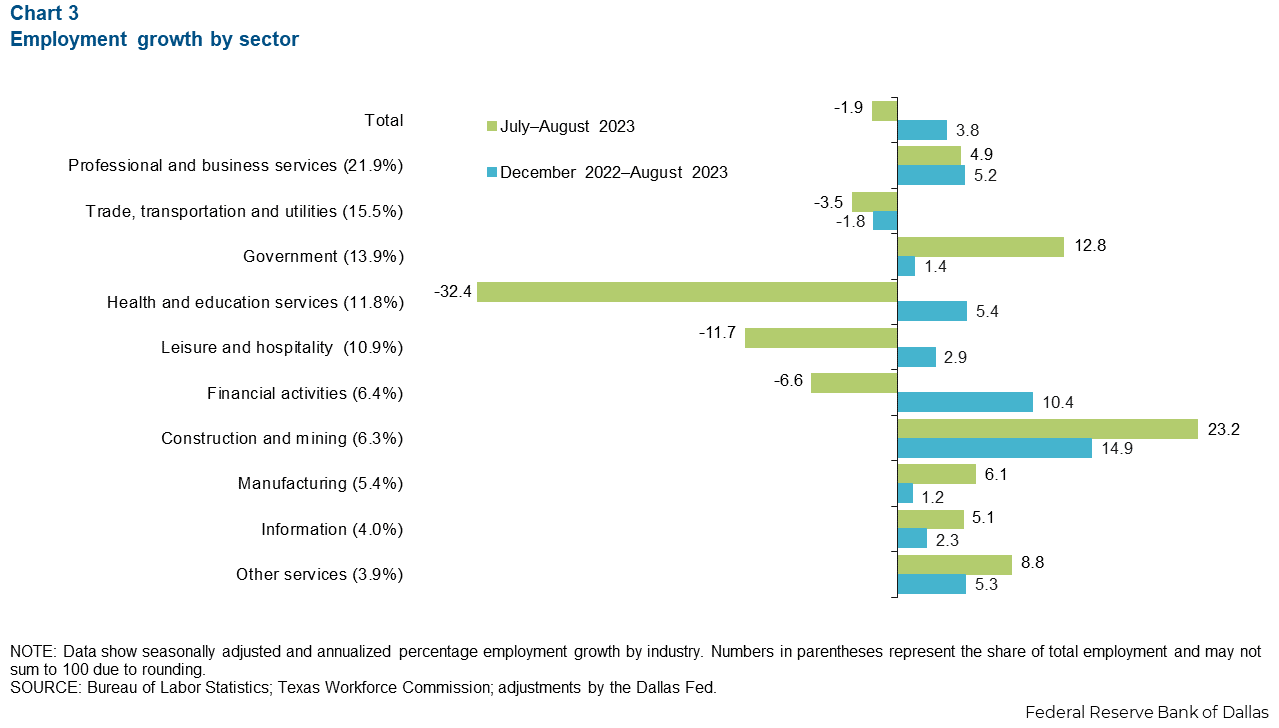
Construction employment growth may be driven by new projects, such as Brookfield Properties breaking ground on $90 million in industrial projects.
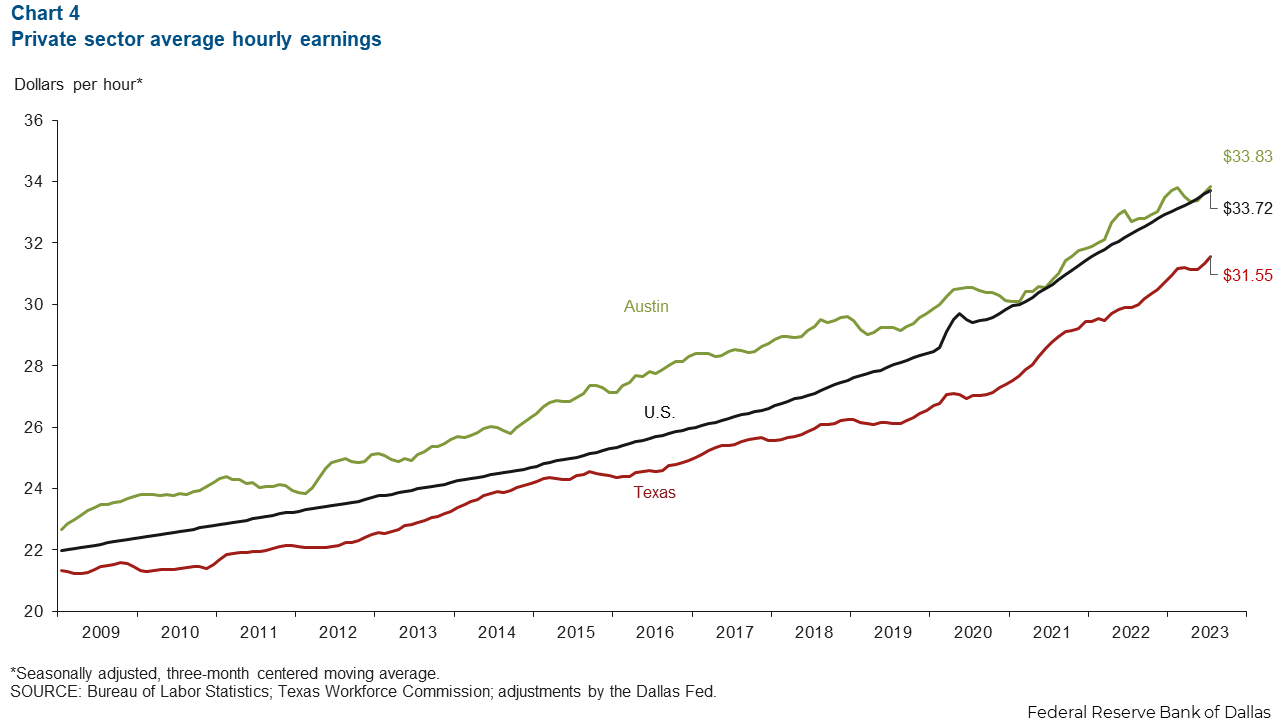
Austin wages continue to grow
The three-month moving average of Austin wages increased 6.2 percent in August (Chart 4). The average hourly wage of $33.83 remains above the nation’s average ($33.72) and the state’s ($31.55). Year over year, Austin wage growth of 3.4 percent is slower than U.S. gains of 4.3 percent and Texas growth of 5.2 percent.
Mass layoffs (WARN)
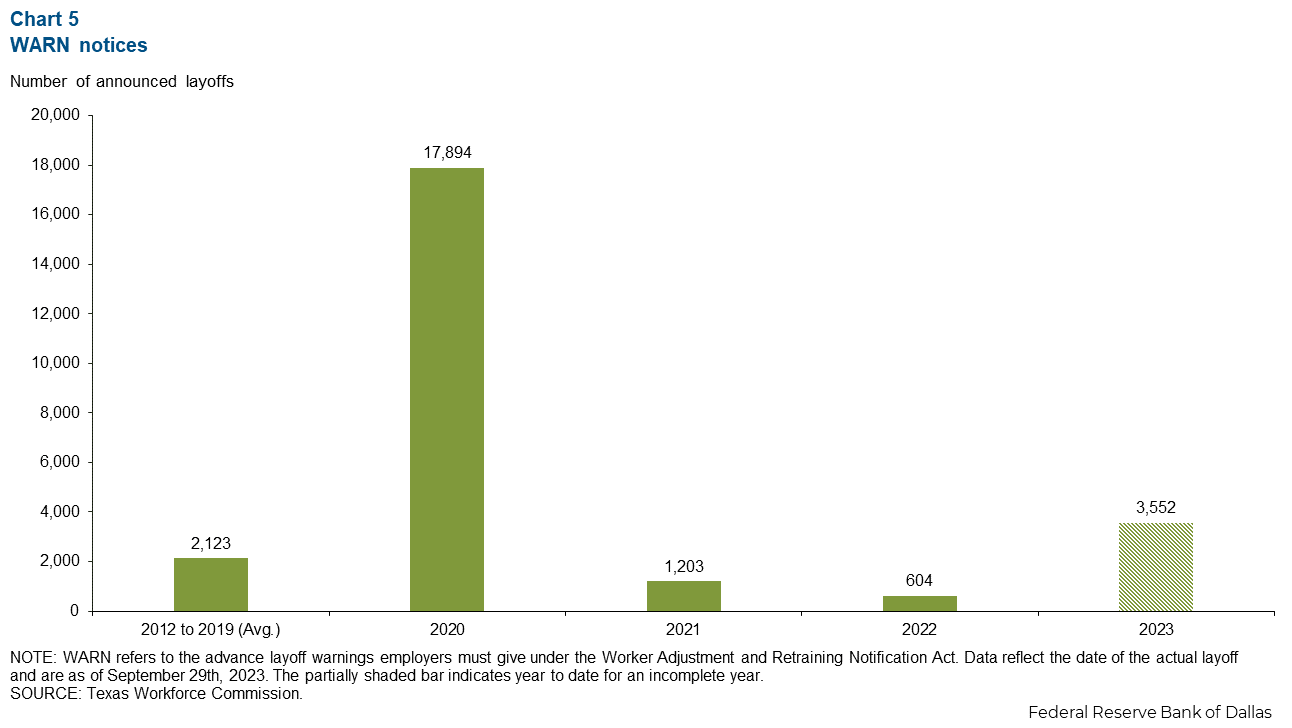
Layoffs continue to rise
As of Sept. 29, 3,552 employees in the Austin metropolitan statistical area had received mass layoff notices (WARN notices) this year (Chart 5). This is higher than the 2012 to 2019 annual average and more than the number of layoffs in both 2021 and 2022, reflecting the cooling labor market. Assuming the pace continues for the rest of the year, by the end of 2023, the number of layoffs would be around 4,700, the second-highest annual amount for the past decade.
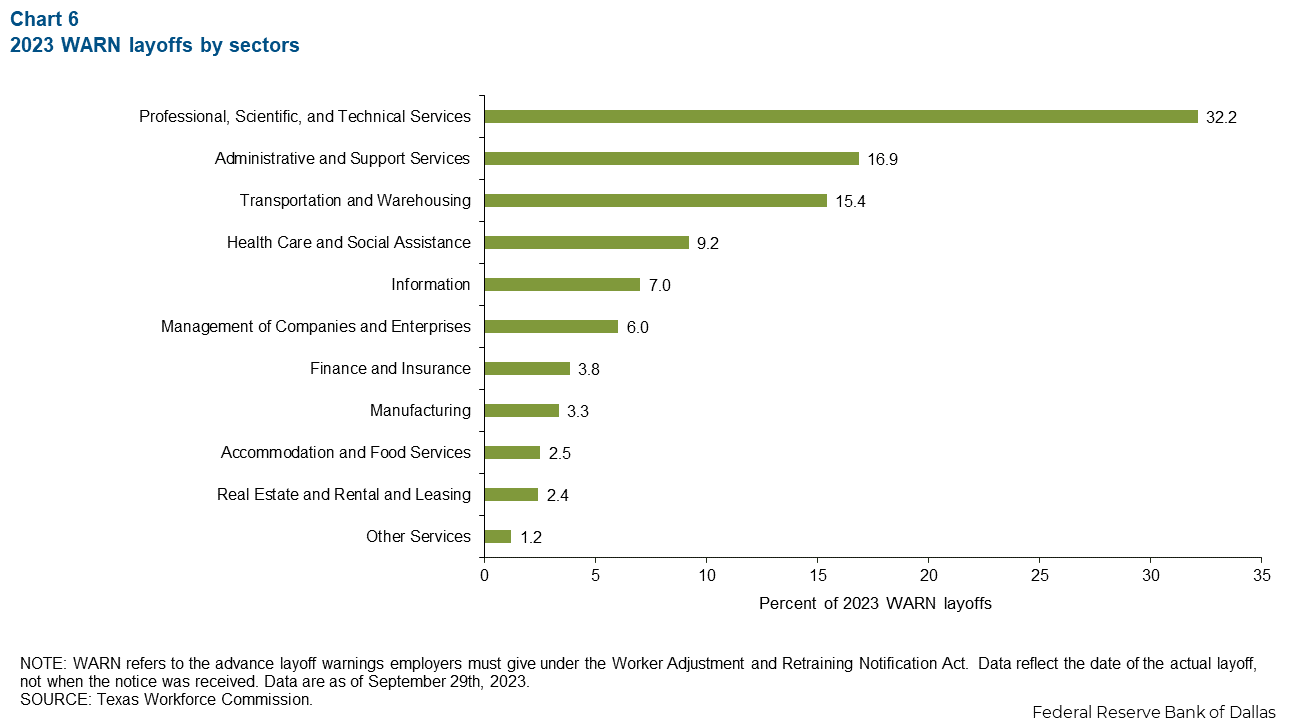
Layoffs concentrated in professional and business services
So far in 2023, layoffs have been concentrated in professional, scientific and technical services, followed by administrative and support services and the transportation sectors (Chart 6). Given the compositions of these industries, mass layoffs appear to emphasize white-collar office workers rather than blue-collar labor. Information services, which comprises 4 percent of the Austin labor force, took a disproportionate hit this year, with 7 percent of the mass layoffs.
NOTE: Data may not match previously published numbers due to revisions.
About Austin Economic Indicators
Questions or suggestions can be addressed to Vee Kalkunte at Prithvi.Kalkunte@dal.frb.org.
Austin Economic Indicators is released on the first Thursday of every month.