Austin Economic Indicators

| Austin economy dashboard (October 2023) | |||
| Job growth (annualized) July–Oct. '23 |
Unemployment rate |
Avg. hourly earnings |
Avg. hourly earnings growth y/y |
| 2.5% | 3.6% | $33.69 | 2.7% |
In October, Austin experienced flat employment growth, wages increased slightly, and unemployment remained steady. In contrast, housing permits increased, and home prices declined.
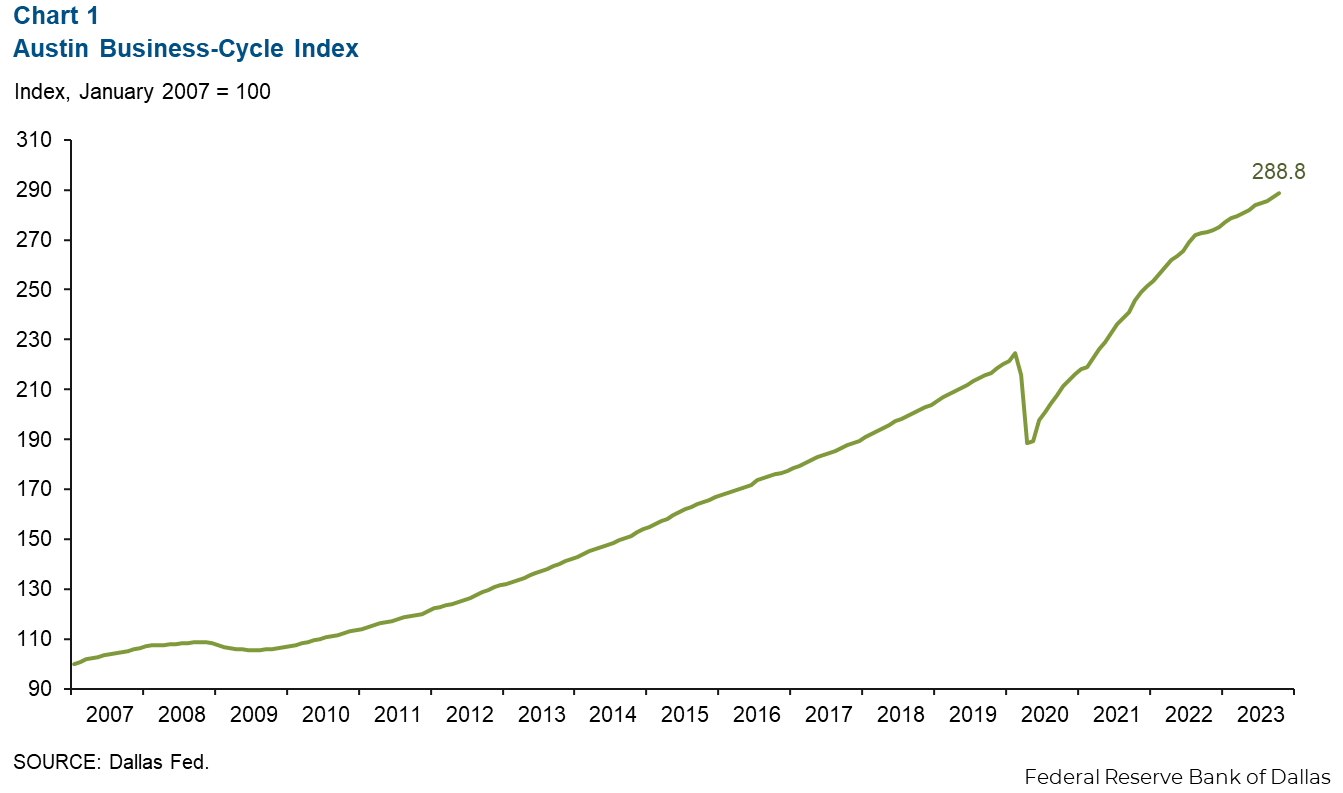
Business-cycle index
The Austin Business-Cycle Index, a broad measure of economic activity, grew an annualized 6.6 percent in October, slower than the 7.1 percent gain in September (Chart 1).
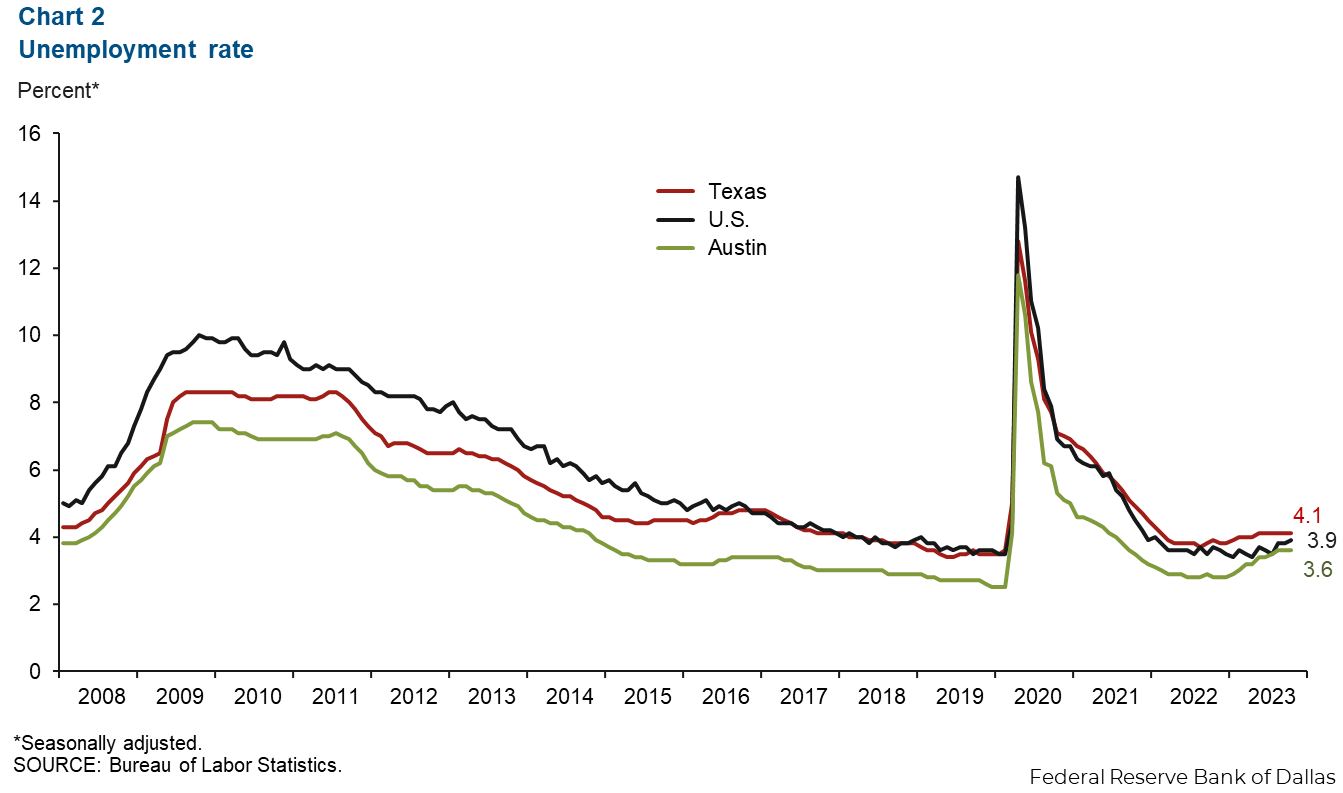
Labor market
Unemployment rate stabilizes
Austin’s unemployment rate stayed steady at 3.6 percent, remaining below the state rate of 4.1 percent and the national rate of 3.9 percent (Chart 2). In October, the local labor force increased an annualized 2.8 percent.
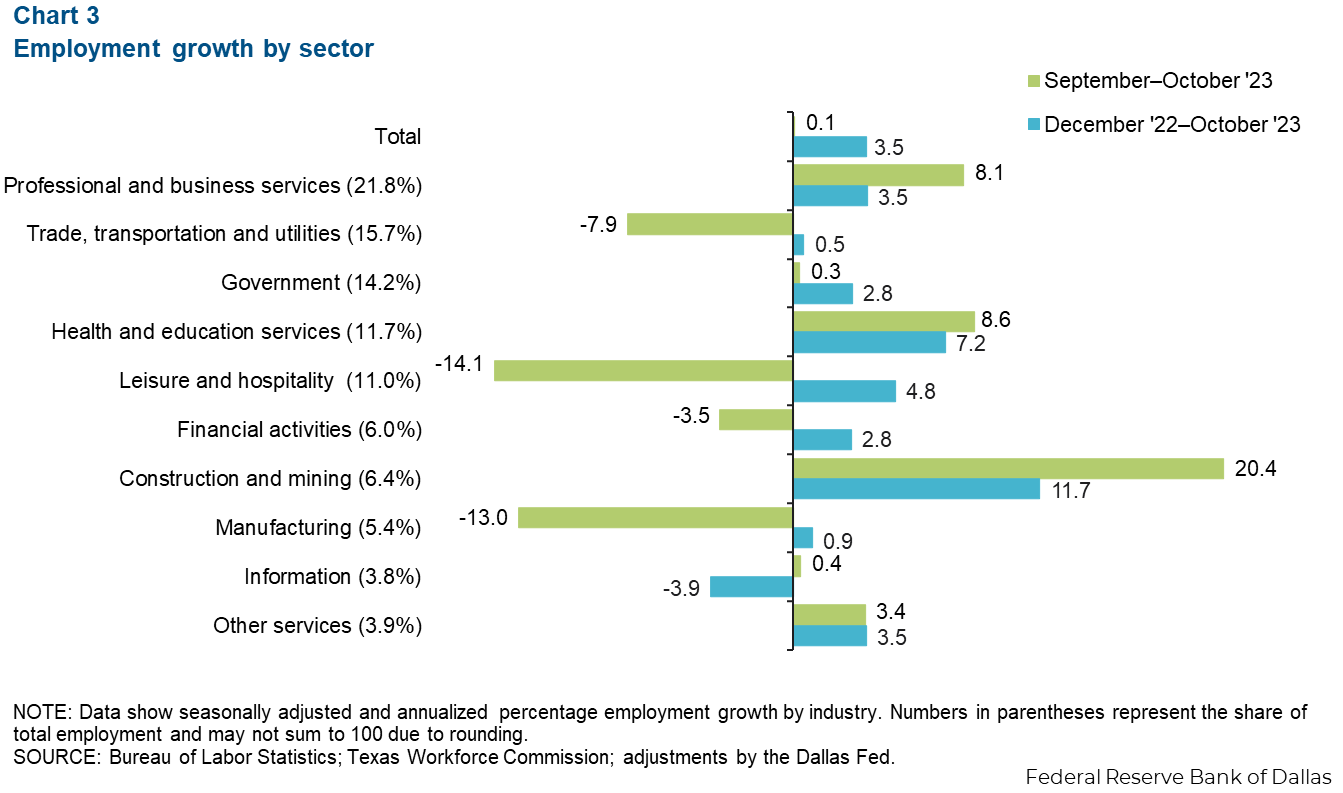
Employment flattens
Austin employment increased 0.1 percent in October, much less than September’s 5.7 percent gains (Chart 3). Sectors with the most growth include construction and mining (20.4 percent, or 1,316 jobs), health and education (8.6 percent, or 1,062 jobs), and professional and business services (8.1 percent, or 1,880 jobs). Sectors that saw a decline included leisure and hospitality (14.1 percent, or 1,877 jobs) and manufacturing (13.0 percent, or 845 jobs). Year to date, Austin’s payrolls expanded 3.5 percent, outpacing the state’s 3.2 percent growth.
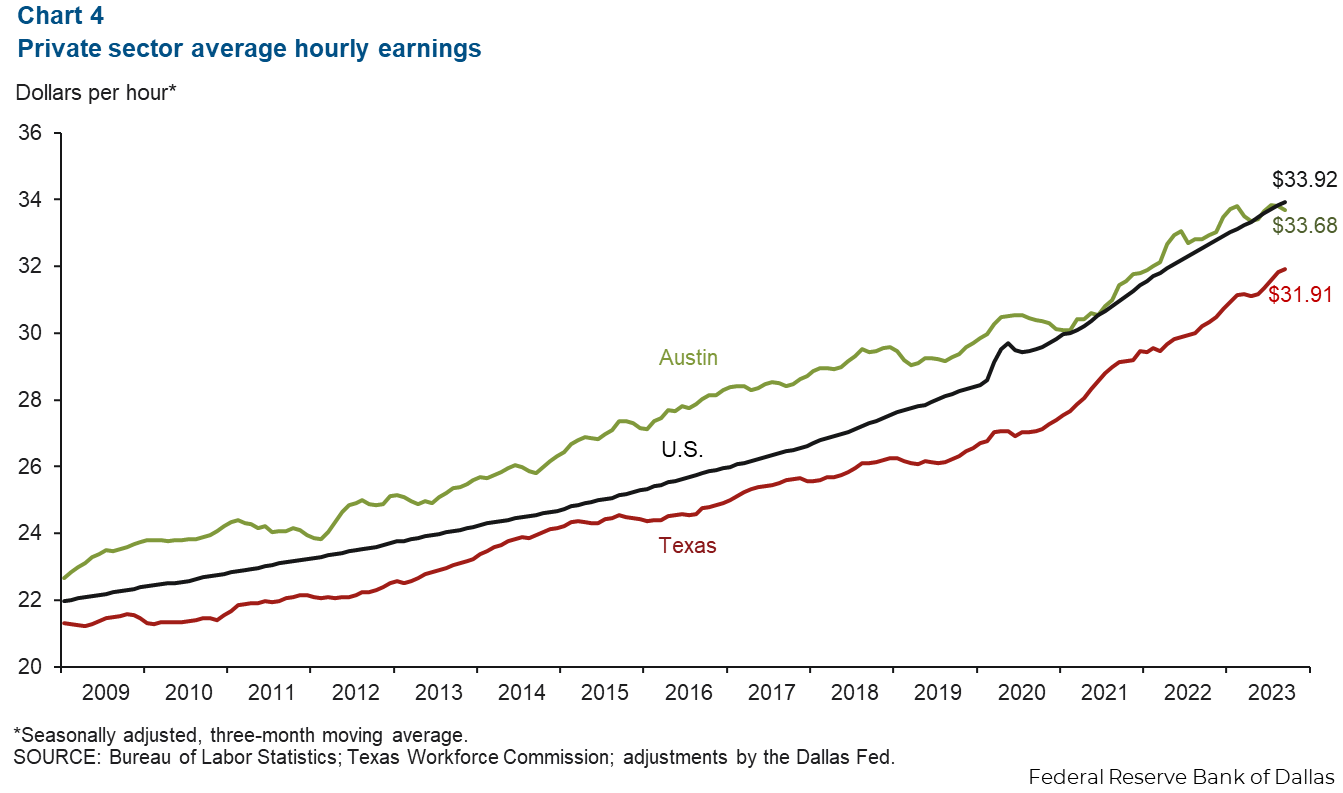
Austin wages stay below national average
Austin’s three-month moving average of wages declined 4.2 percent in October (Chart 4). This average was $33.68 in October—below the nation’s average of $33.92 for the third month in a row but above the state’s rate of $31.91. Year over year, Austin wage growth of 2.7 percent was slower than U.S. gains of 4.1 percent and Texas growth of 5.2 percent.
Residential real estate
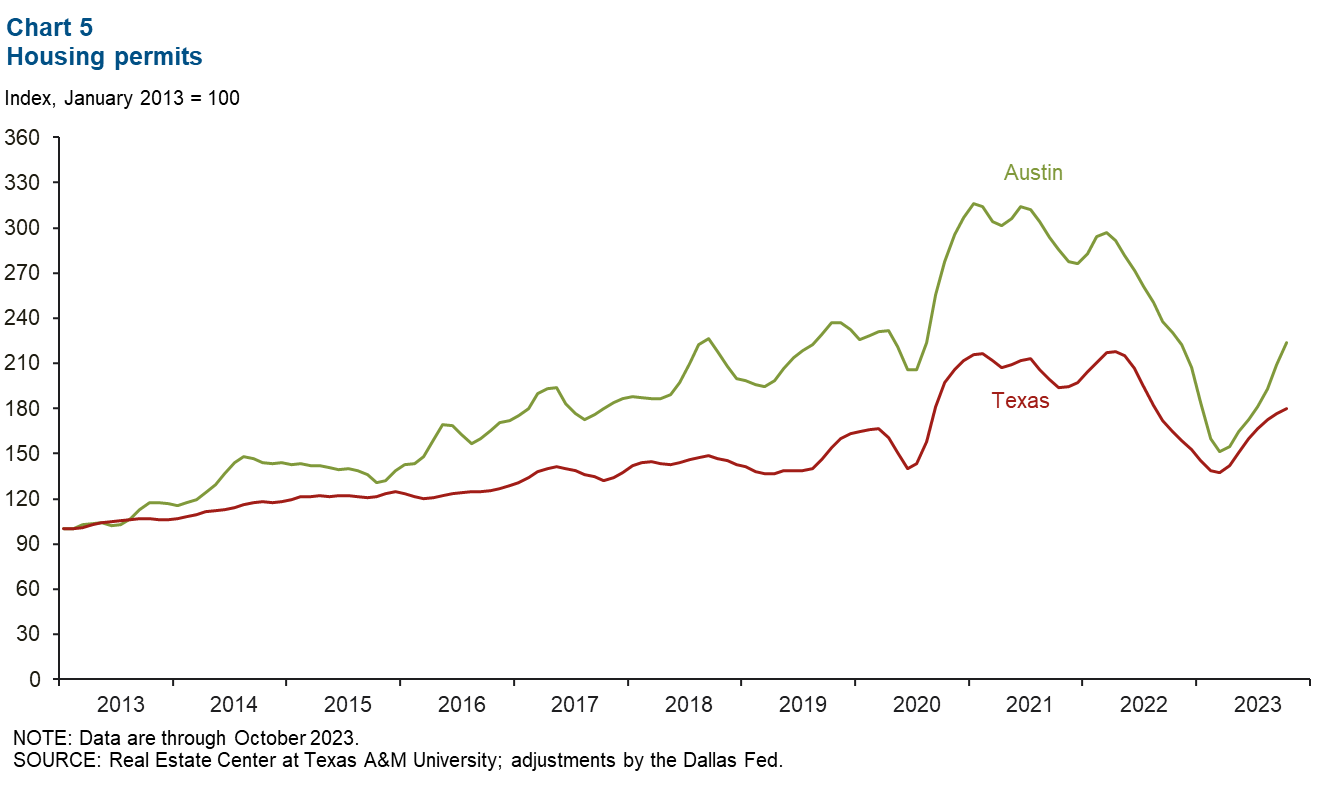
Housing permits continue to increase
Austin’s single-family home permits increased by 4.0 percent in October, less than the 2.0 percent increase seen across the state (Chart 5). Year over year, however, Austin’s single-family home permits remained down 3.0 percent, while the state’s permits rose 9.3 percent.
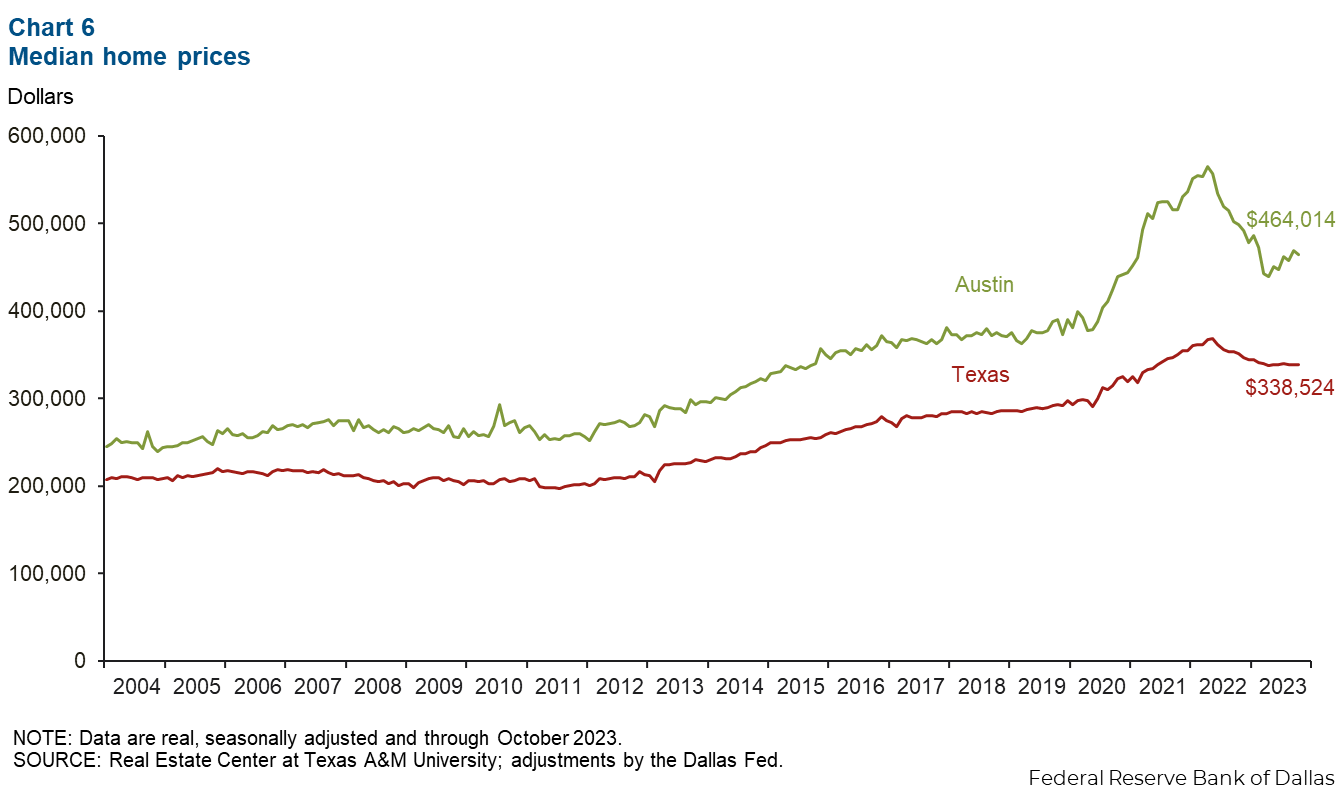
Home prices dip slightly
Austin’s median home prices declined in October by 1.1 percent. Texas home prices were also slightly down, by 0.15 percent. Median home prices in October were $464,014 in Austin and $338,524 in Texas (Chart 6). Year over year, home prices trended down—falling 6.8 percent in the metro and 3.6 percent in the state.
NOTE: Data may not match previously published numbers due to revisions.
About Austin Economic Indicators
Questions or suggestions can be addressed to Vee Kalkunte at Prithvi.Kalkunte@dal.frb.org.
Austin Economic Indicators is released on the first Thursday of every month.