Houston Economic Indicators

| Houston economy dashboard (November 2023) | |||||
| Job growth (annualized) Aug.–Nov. '23 |
Unemployment rate |
Avg. hourly earnings | Avg. hourly earnings growth y/y |
||
| 2.7% | 4.2% | $34.45 | 8.2% | ||
Houston employment growth was strong in November, with services driving the 2.7 percent increase from August levels. Construction continued to decline as the real estate market slowed. Median home-price growth in the metro returned to the prepandemic normal, and mortgage rates remained elevated as sales and housing inventories rose. On the commercial side, vacancies remained high in the third quarter, and multifamily housing permits dropped.
Employment
Houston employment grew 2.7 percent from August to November 2023, with 22,619 jobs added (Chart 1). The Houston economy had 98,213 more workers in November 2023 than November 2022, a 3.0 percent increase that pushed local employment over 3.4 million for the first time.
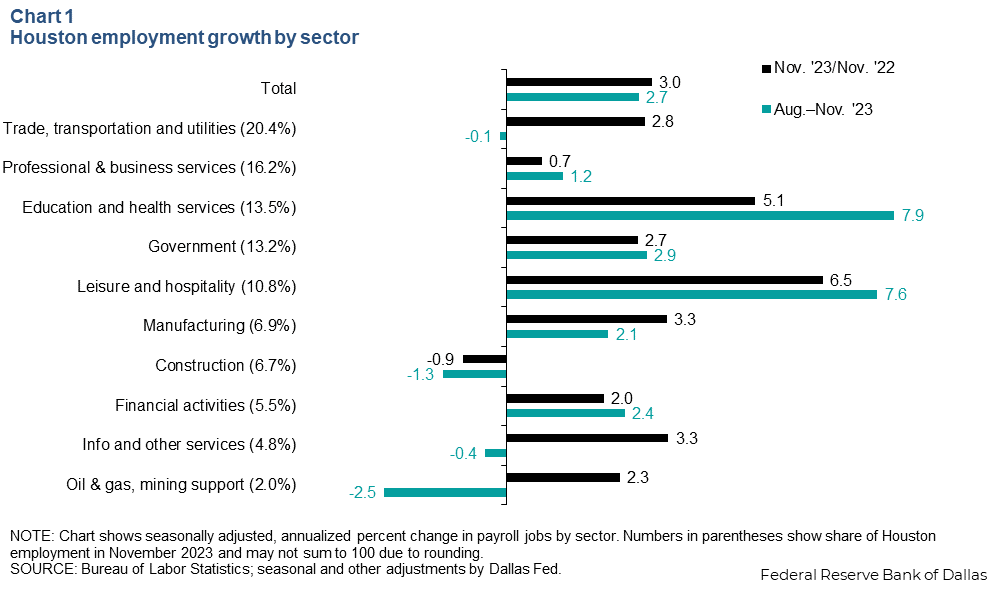
A number of sectors contributed to the growth, which was led by the service industries. Education and health services jumped 7.9 percent (8,662 jobs) while leisure and hospitality was close behind with 7.6 percent growth (6,652 jobs). On the other hand, oil and gas employment fell by 2.5 percent (427 jobs) from August, and construction fell 1.3 percent (744 jobs).
Real estate
Median home-price growth in Houston returns to prepandemic levels
The median price of a Houston home for sale in November 2023 was 1.1 percent below the November 2022 price, a drop of $3,764 (Chart 2). The median nominal home price in Houston was $330,269 in November compared with $401,190 in Dallas–Fort Worth, $450,917 in Austin and $337,079 in Texas overall.
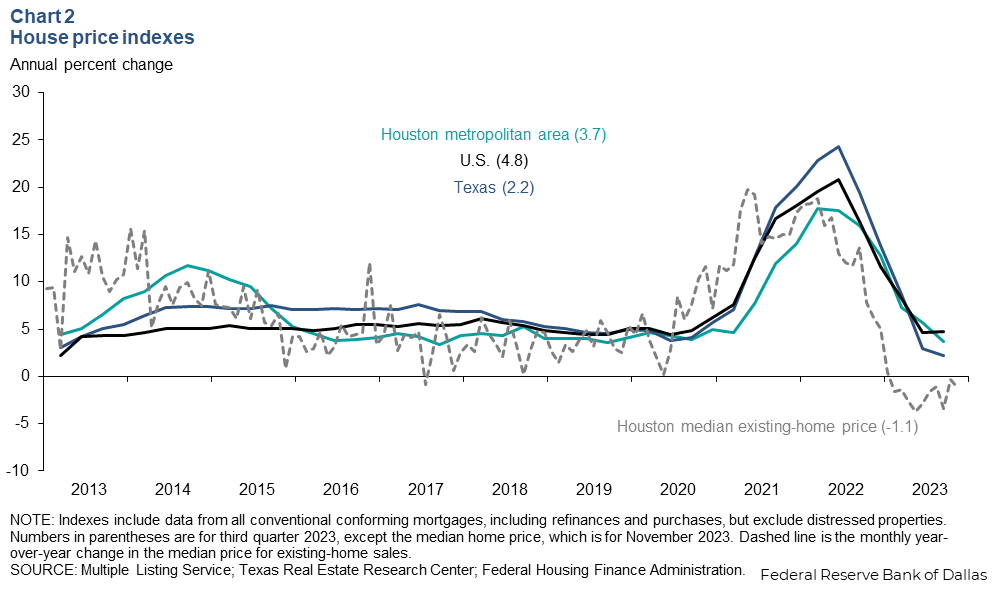
On a quarterly basis, Houston home prices rose 3.7 percent in third quarter 2023 compared with the same period in 2022, their lowest increase since late 2019. Houston sat between the U.S., which posted 4.8 percent growth, and Texas, which saw 2.2 percent growth. This index compares the same homes over different time periods, removing composition effects. This makes it a more accurate but less timely measure of home prices.
Housing market stabilizes with mortgage rates elevated
Houston’s housing inventory rose to 3.2 months in November, and home sales rose to 7,032 (Chart 3). Mortgage rates dipped in December to 7.1 percent from a high of 8.2 percent in October. Home sales were down 32.3 percent from their peak of 10,394 in January 2022.
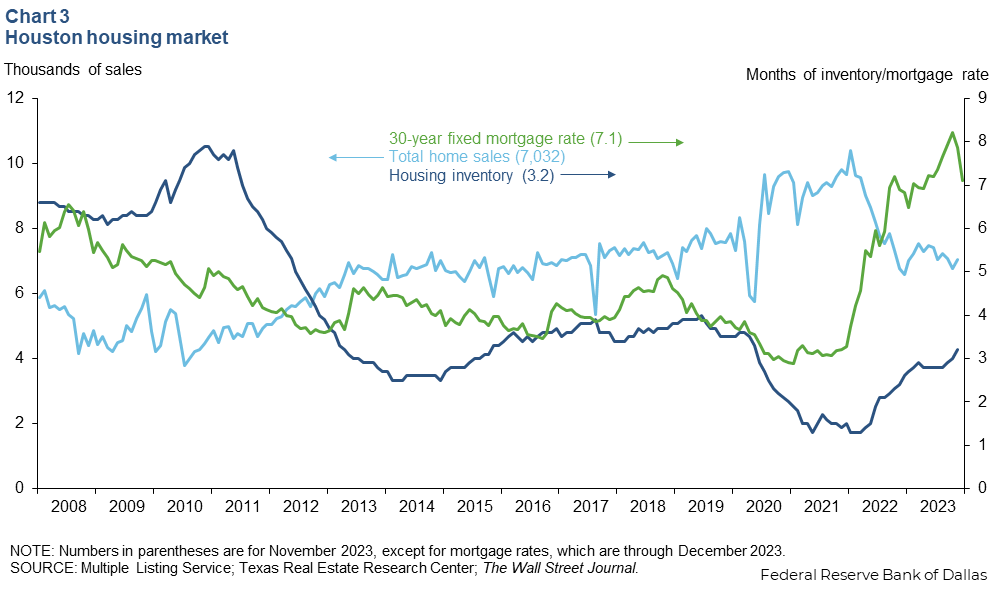
A balanced housing market is generally thought to have four to five months of inventory. The Houston market averaged 3.5 months of inventory from 2015 to 2019 during the relatively stable period of modest increases in price between the Great Recession and the pandemic.
Vacancy rates remain elevated through third quarter 2023
Office vacancies ticked up to 24.4 percent in third quarter 2023, while apartment vacancies were stable at 7.0 percent, and industrial vacancies rose to 5.3 percent (Chart 4). Though office vacancies reached a high of 26.2 percent during the pandemic, they had been on an upward trend since the 2015–16 oil bust. After recovering from the Great Recession to 11.7 percent in 2014, office vacancies rose to 21.4 percent in fourth quarter 2019—before lockdowns and the rise of remote work sent office workers home.
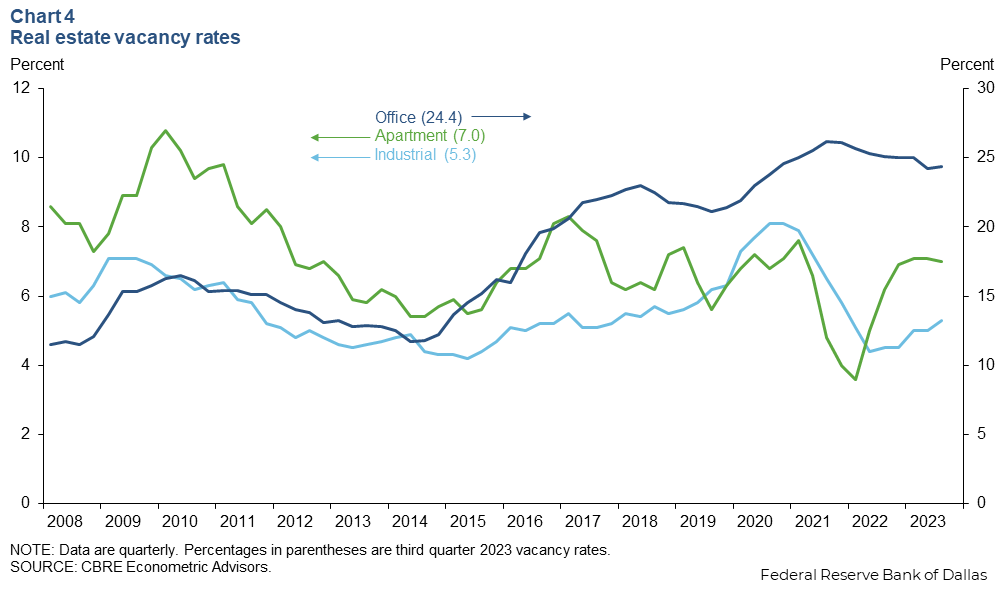
Apartment and industrial vacancies are not experiencing the same rise as offices. Apartment vacancies have hovered around 7 percent since fourth quarter 2022, while industrial vacancies picked up in third quarter 2023 amid strong deliveries of new square footage. Third quarter data put apartment and industrial vacancies even with their 2010–19 averages of 7.1 percent and 5.3 percent, respectively.
Apartment rent growth slows in Houston but not as much as other Texas metros
Rents in Houston in November 2023 were 2.8 percent higher than November 2022, a higher growth rate than most other major Texas metros (Chart 5). Dallas–Fort Worth and San Antonio saw rents grow less than 1 percent year over year, while Austin—beleaguered by a massive influx of new apartments—actually saw a year-over-year decline in rents in November. On the Texas border, El Paso saw the highest growth of the major Texas metros, with rents soaring 5.0 percent in November compared with the prior year. Even so, the pace of rent growth in Houston was down 9.8 percentage points from the peak rate of 12.6 percent in March 2022.
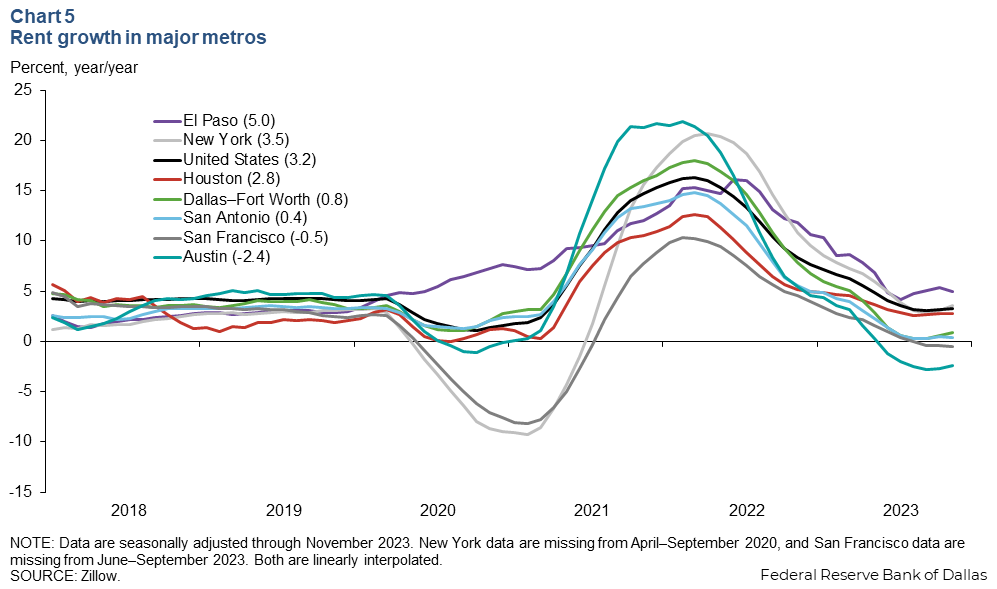
By comparison, New York saw rents jump 3.5 percent, and San Francisco rents fell 0.5 percent. The national average rent growth was 3.2 percent year over year in November.
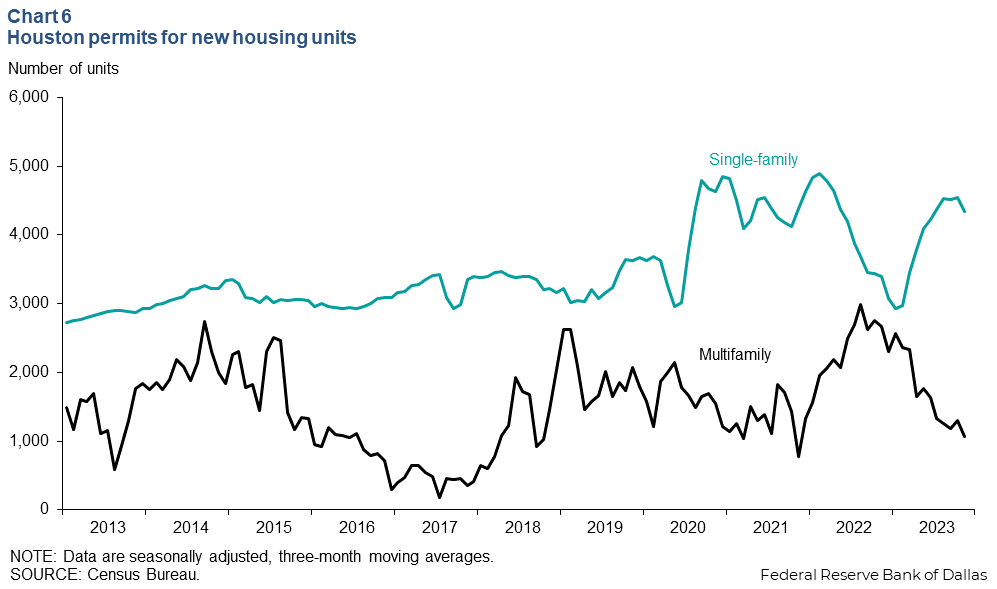
Houston permits dip in November
The three-month moving average of single-family permits issued fell to 4,342 in November 2023, while the same measure for multifamily units dropped to 1,065 (Chart 6). Multifamily permits have been declining since summer 2022 and are now 64.3 percent below August 2022 levels. Single-family permits are still well above prepandemic levels, even as they have fallen 11.3 percent from their peak in February 2022.
NOTE: Data may not match previously published numbers due to revisions.
About Houston Economic Indicators
Questions or suggestions can be addressed to Ana Pranger at ana.pranger@dal.frb.org. Houston Economic Indicators is posted on the second Monday after monthly Houston-area employment data are released.