Houston Economic Indicators

| Houston economy dashboard (December 2023) | |||||
| Job growth (annualized) Sept.–Dec. '23 |
Unemployment rate |
Avg. hourly earnings | Avg. hourly earnings growth y/y |
||
| 0.8% | 4.4% | $34.45 | 8.2% | ||
Houston job growth slowed from September through December, finishing the year with 2.9 percent growth from December 2022. Houston’s unemployment rate was flat in December as Texas unemployment dipped for the first time since November 2022. Mining-related jobs fell with the oil price in December, while the national rig count ticked up. January retail fuel prices showed small increases across the board, while December price indexes showed inflation picking up.
Labor Market
Houston employment growth slows in December
Houston employment grew 0.8 percent, annualized, from September through December 2023, a net increase of 6,517 jobs (Chart 1). Education and health services led growth, rising 6.7 percent (7,405 jobs) and offsetting declines in other sectors. Overall, the decline in trade, transportation and utilities, professional and business services, leisure and hospitality, and manufacturing amounted to a loss of 4,342 jobs in the fourth quarter.
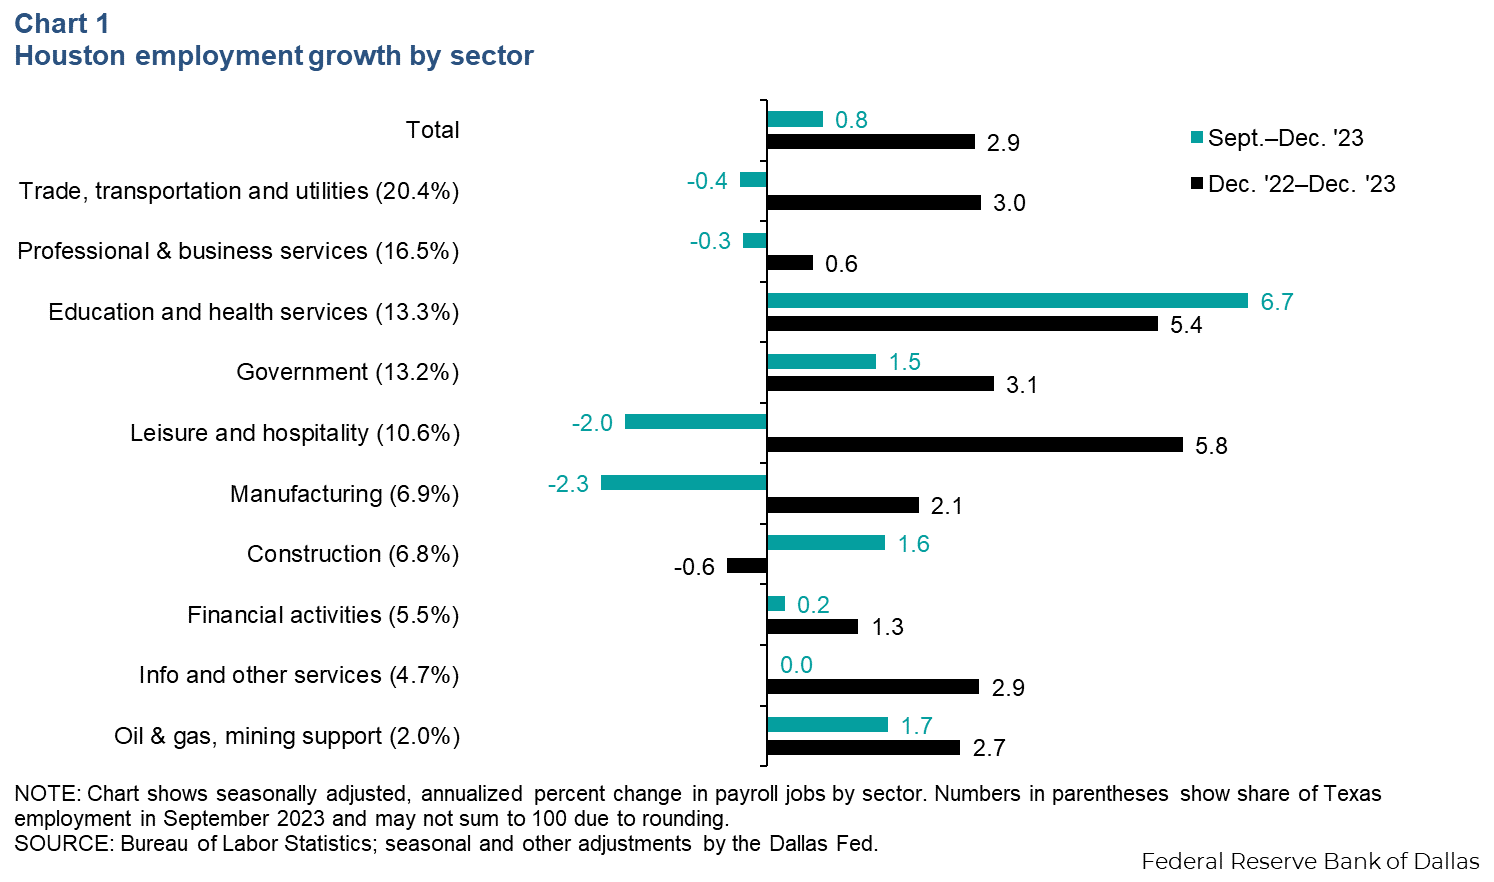
Almost all sectors saw slower growth in fourth quarter 2023 than the year overall, with some sectors shedding jobs between September and December. This broad-based slowing means Houston entered 2024 with a much cooler labor market than the one going into 2023.
Houston unemployment flat as Texas jobless rate ticks down
The Houston-area unemployment rate was 4.4 percent in December for the third straight month (Chart 2). Texas’ jobless rate fell to 4.0 percent after seven months at 4.1 percent. Both Houston and Texas saw higher unemployment rates than the U.S. overall, which was 3.7 percent in December.
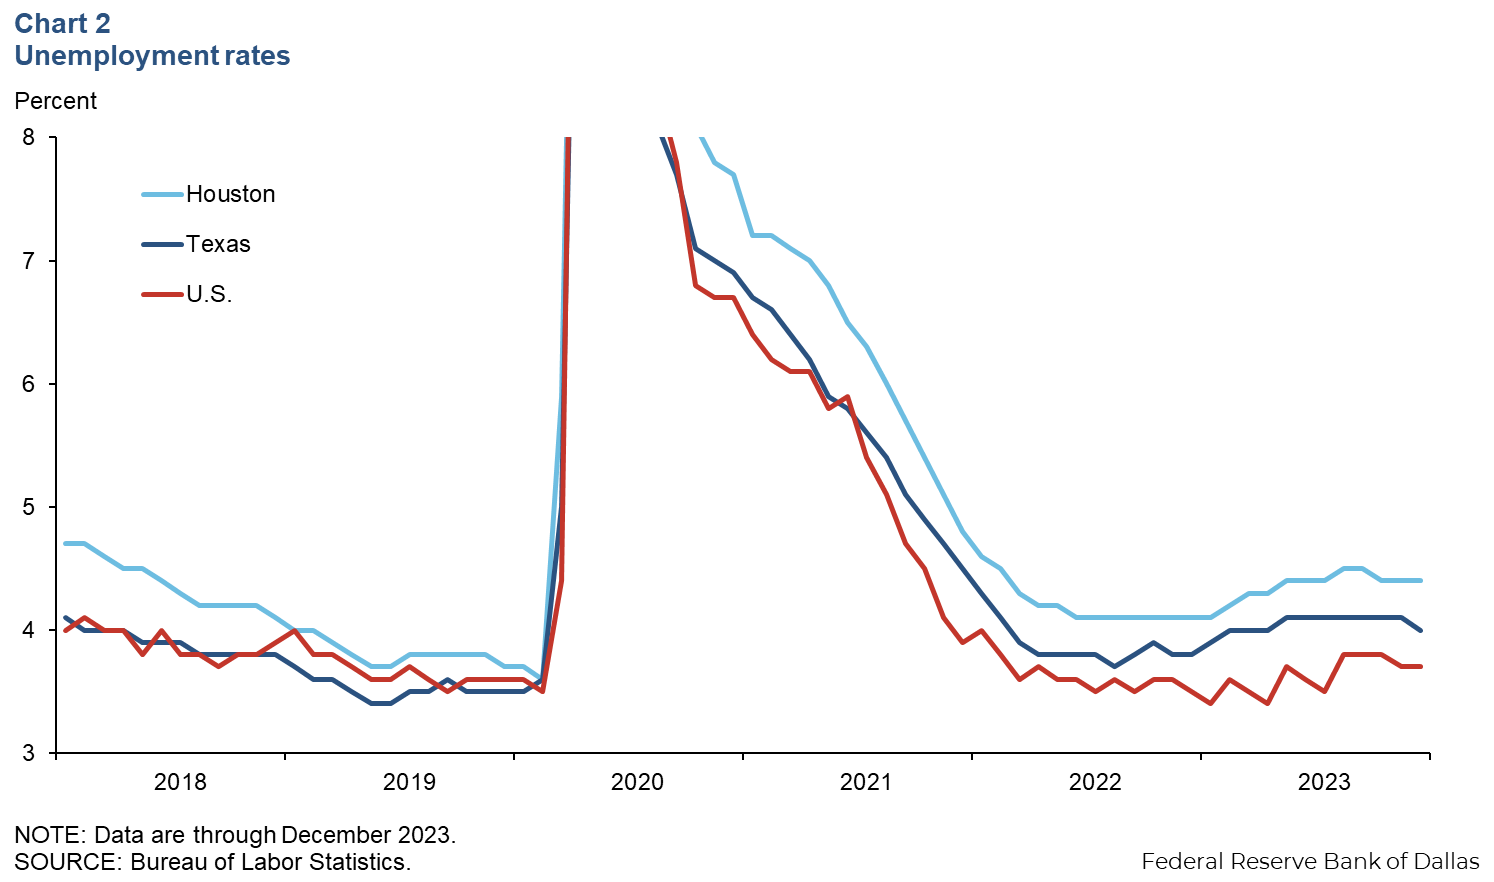
Since the pandemic spike, Houston unemployment has been higher than both the state and nation, likely due to the slower recovery of oil and gas jobs and strong labor force growth. Among the major sectors, oil and gas is one of three that remained below January 2020 employment levels in Texas in December 2023 (the others are construction and manufacturing). Houston’s labor force has grown by 3.8 percent since attaining its prepandemic level of employment in April 2022, aided by migration to the region. By comparison, labor force growth was 3.8 percent in Texas and 2.2 percent nationally since April 2022.
Energy
Rig count rises; oil price drops and mining jobs fall
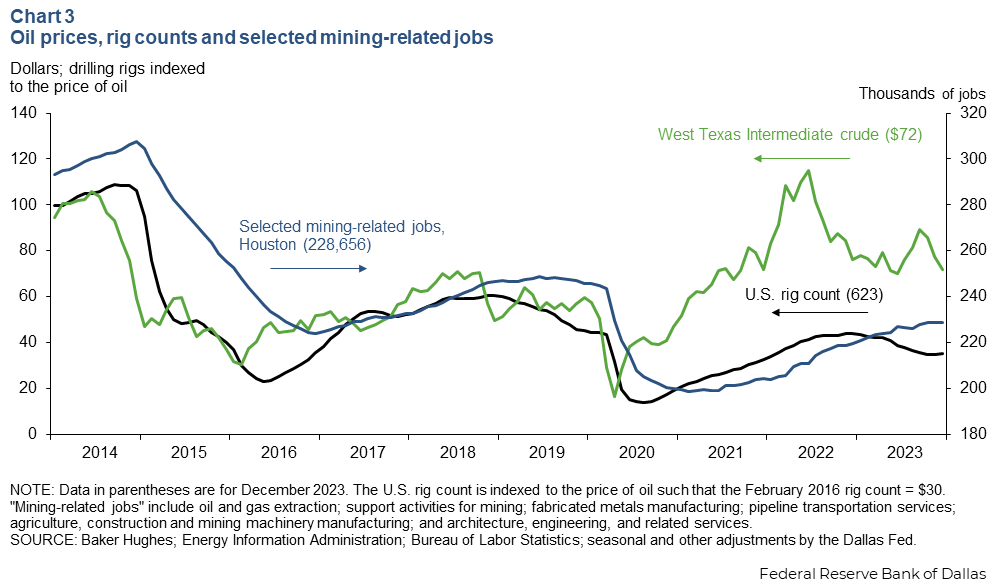
The price of West Texas Intermediate crude oil dropped to $72 a barrel in December as the U.S. rig count ticked up, and Houston mining-related jobs ticked down slightly (Chart 3). Historically, the rig count and mining jobs have closely followed the price of oil, but that relationship weakened after the pandemic. Increasing productivity and efficiency in the oilfield and a shift to business models that prioritize investor returns over production growth mean those indicators are now less responsive to changes in the price of oil.
Houston-area retail fuel prices tick up slightly in January
Data through the first two weeks of January showed Houston fuel prices stabilized around December 2023 levels after falling for several months (Chart 4). The nominal price of regular gasoline has hovered from $2.45 to $2.65 a gallon since November, and during the week of Jan. 15, it was 80 cents below its 2023 high of $3.37 in August.
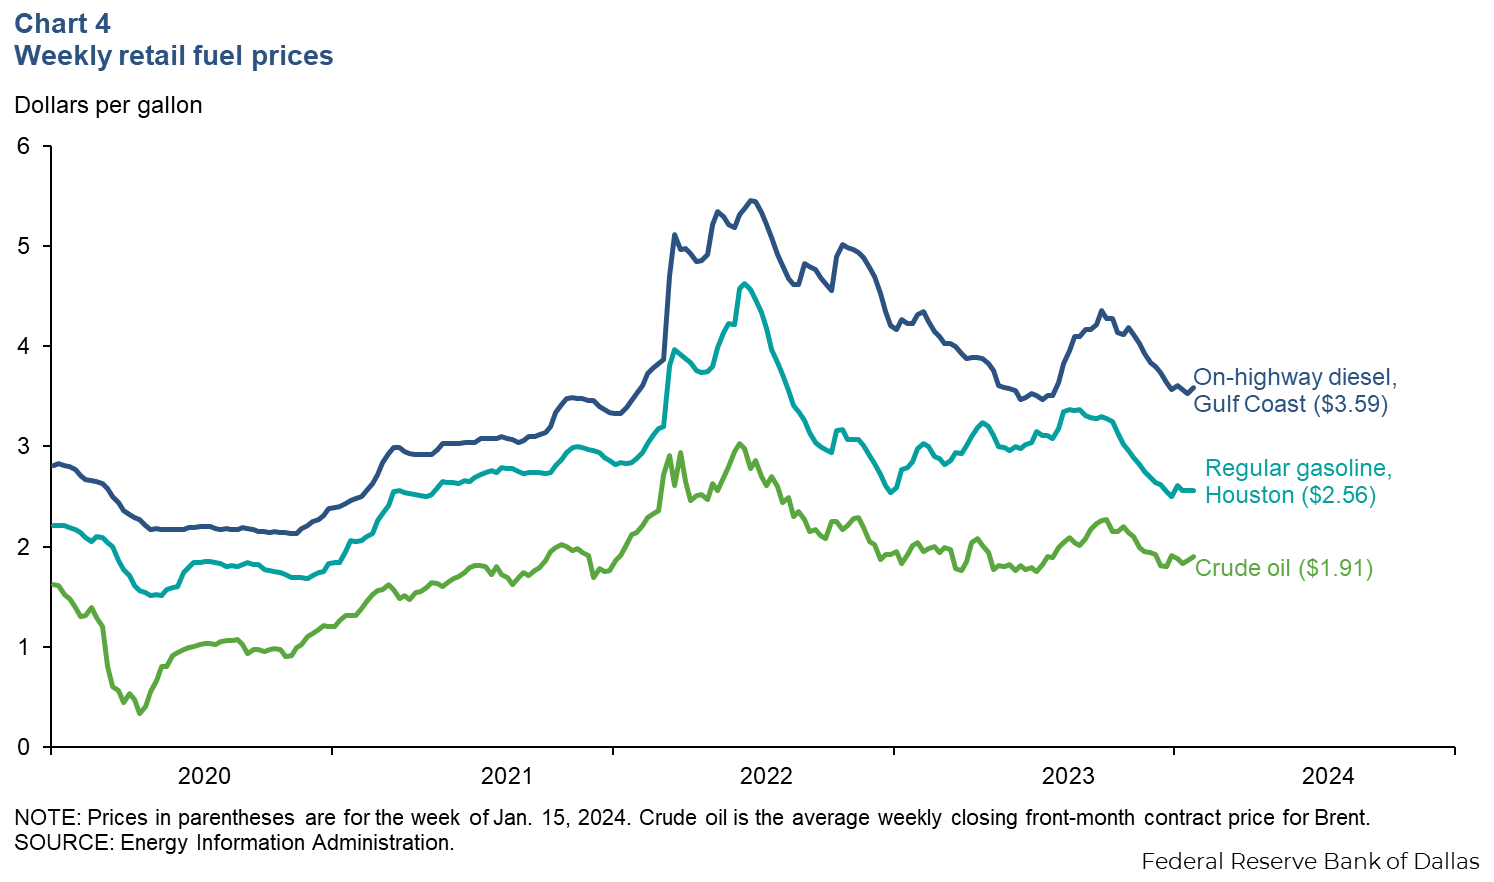
The week of Jan. 15, Gulf Coast diesel was up to $3.59 a gallon but was still well below September 2023 prices, which reached $4.35 a gallon. The Brent crude oil price, an international benchmark that retail fuel prices tend to follow, ticked up to $80 a barrel, or around $1.91 a gallon.
Prices
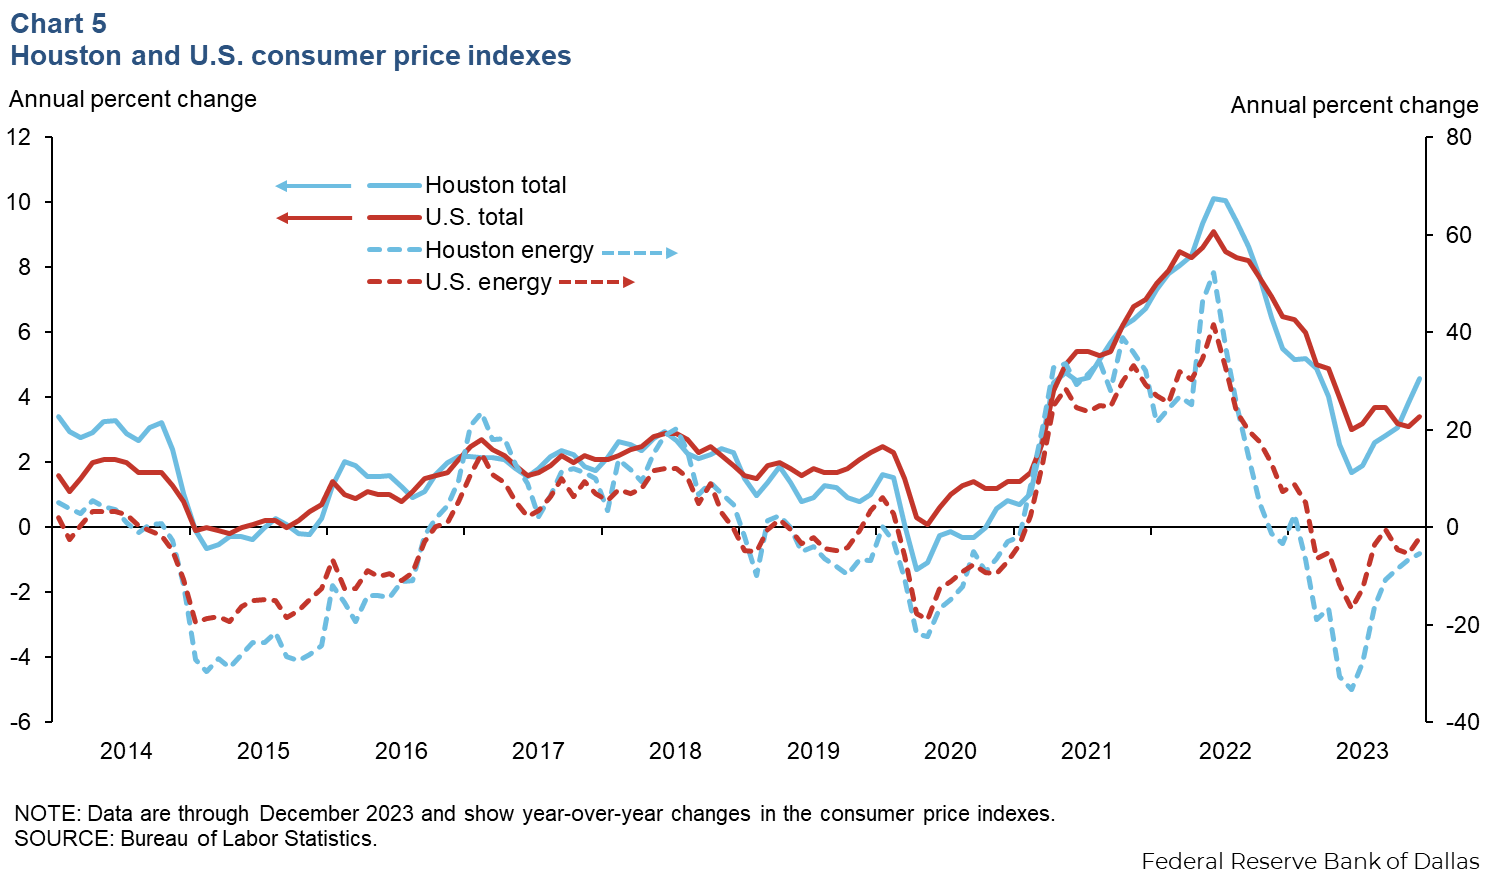
The headline Houston consumer price index rose 4.6 percent year over year in December 2023, above the U.S. reading of 3.4 percent (Chart 5). After falling from a peak of 10.1 percent in June 2022 to a trough of 1.7 percent in June 2023, Houston-area inflation has risen 2.9 percentage points. The slowing in the decline of energy prices, as seen in the dashed lines in Chart 5, drove the recent uptick. Local food inflation and shelter inflation have stabilized somewhat since their highs last summer but remain elevated at 5.3 and 7.7 percent, respectively.
NOTE: Data may not match previously published numbers due to revisions.
About Houston Economic Indicators
Questions or suggestions can be addressed to Ana Pranger at ana.pranger@dal.frb.org. Houston Economic Indicators is posted on the second Monday after monthly Houston-area employment data are released.