San Antonio Economic Indicators

| San Antonio economy dashboard (December 2023) | |||
| Job growth (annualized) Sept.–Dec. '23 |
Unemployment rate |
Avg. hourly earnings |
Avg. hourly earnings growth y/y |
| 3.8% | 3.8% | $28.86 | 3.6% |
San Antonio payroll job growth and wages picked up in December. However, unemployment remained stable, retail sales tax revenue fell, and existing home sales declined.
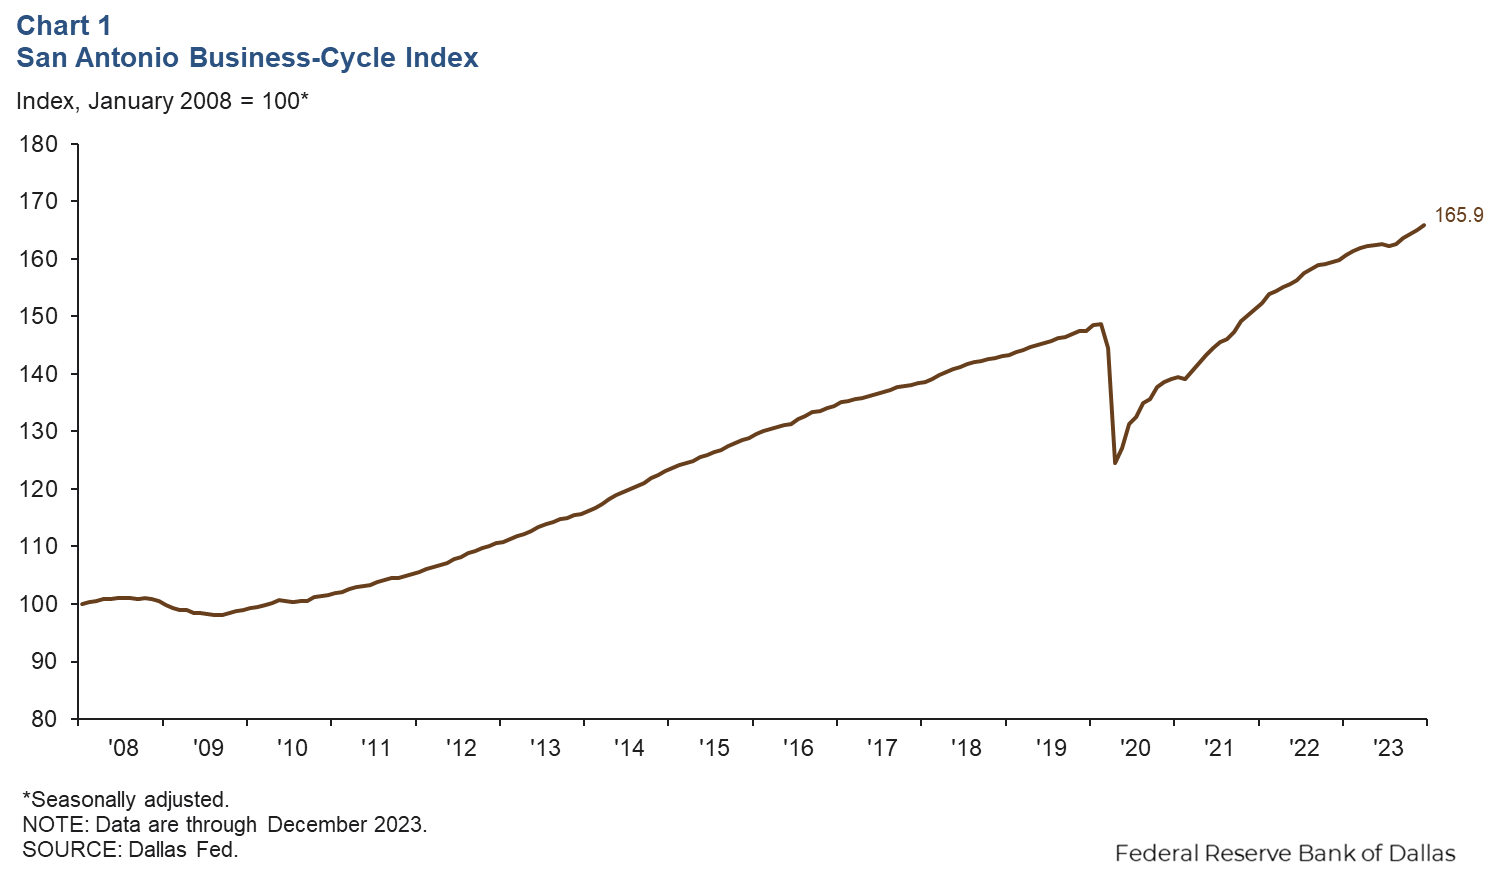
Business-cycle index
The San Antonio Business-Cycle Index, a gauge of economic conditions in the metro area, increased an annualized 6.3 percent from November to December, faster than the 5.5 percent rise from October to November (Chart 1).
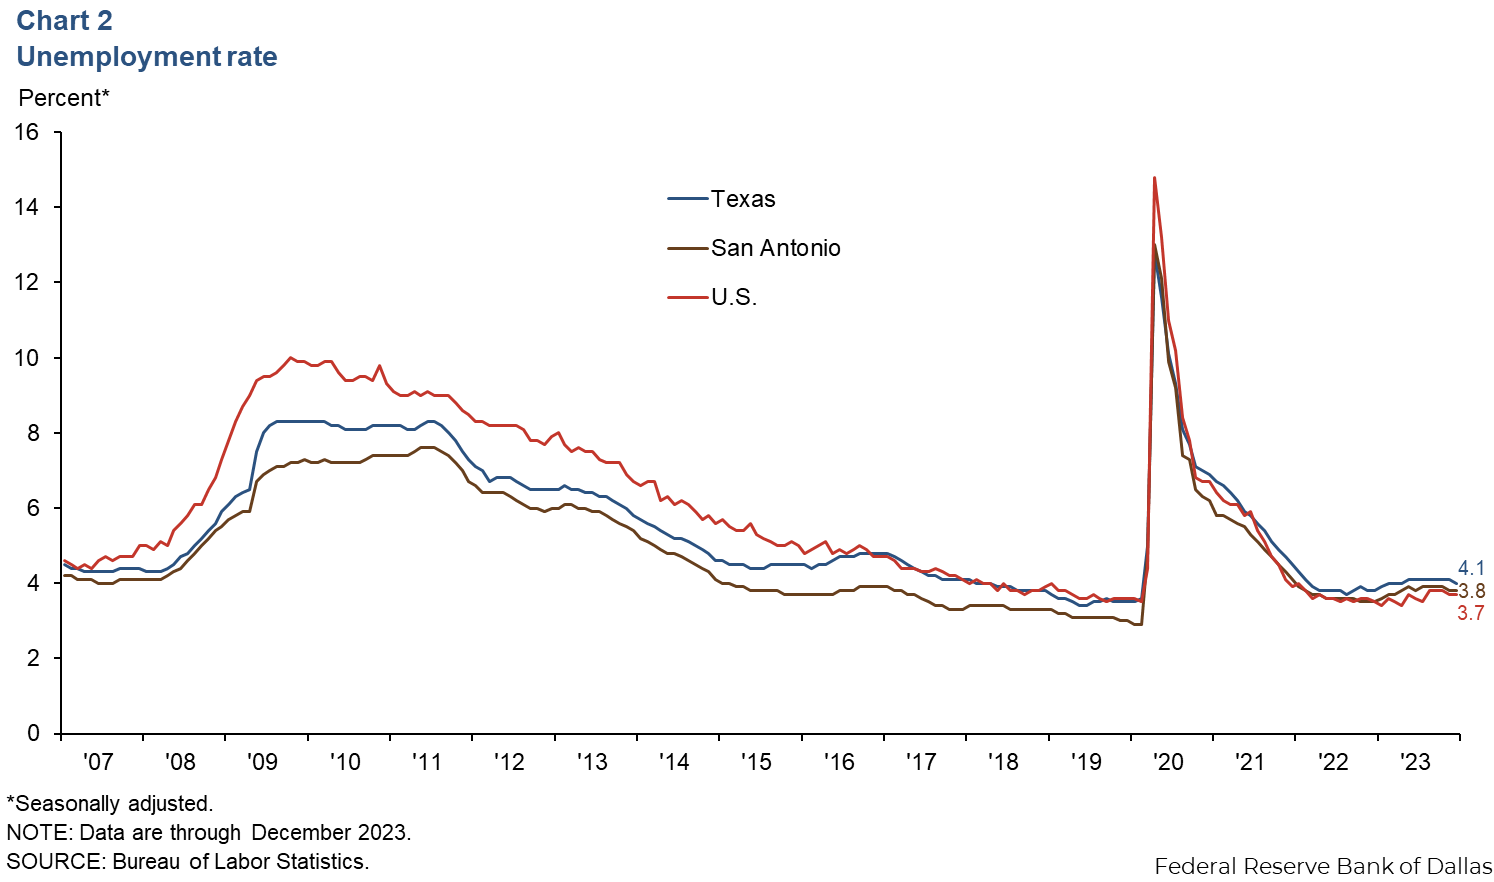
Labor market
Unemployment rate stable
The San Antonio unemployment rate remained 3.8 percent in December (Chart 2). After increasing throughout 2023, unemployment ended the year below the high of 3.9 percent reached in October. The jobless rate is lower in the region than in the state (4.0 percent) and slightly higher than the U.S. (3.7 percent).
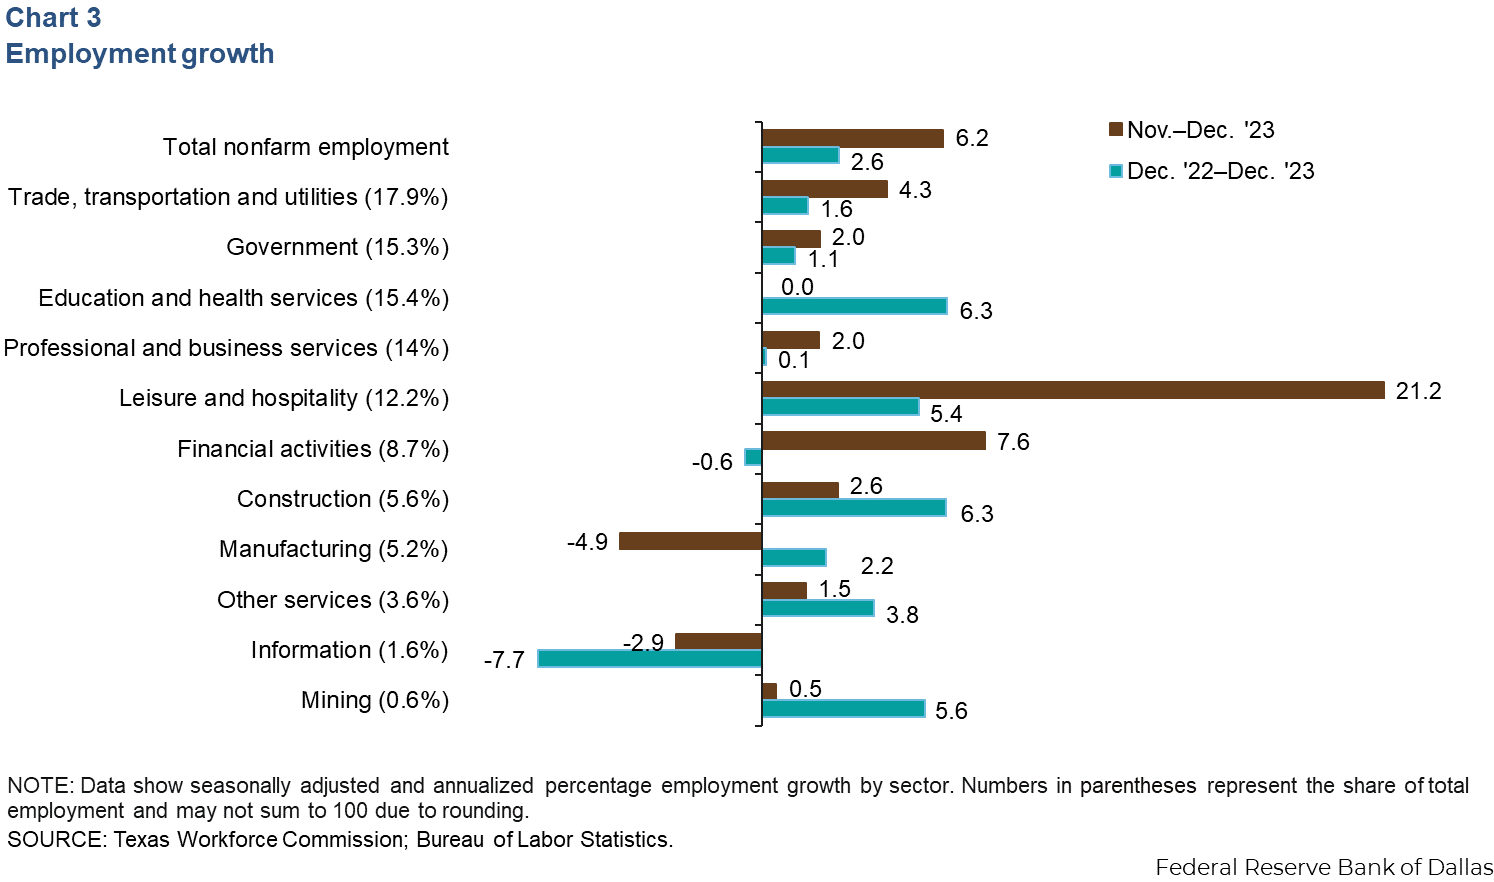
Employment growth accelerates
San Antonio payrolls increased an annualized 6.2 percent from November to December (5,826 jobs) (Chart 3). Job gains were driven by leisure and hospitality (21.2 percent, or 2,317 jobs) and education and health services (9.7 percent, or 1,396 jobs). All other sectors experienced positive monthly growth except manufacturing (down 4.9 percent, or 252 jobs) and information (down 2.9 percent, or 44 jobs). In 2023 total nonfarm employment grew 2.6 percent in San Antonio compared with gains of 3.1 percent in Texas and 1.7 percent in the U.S.
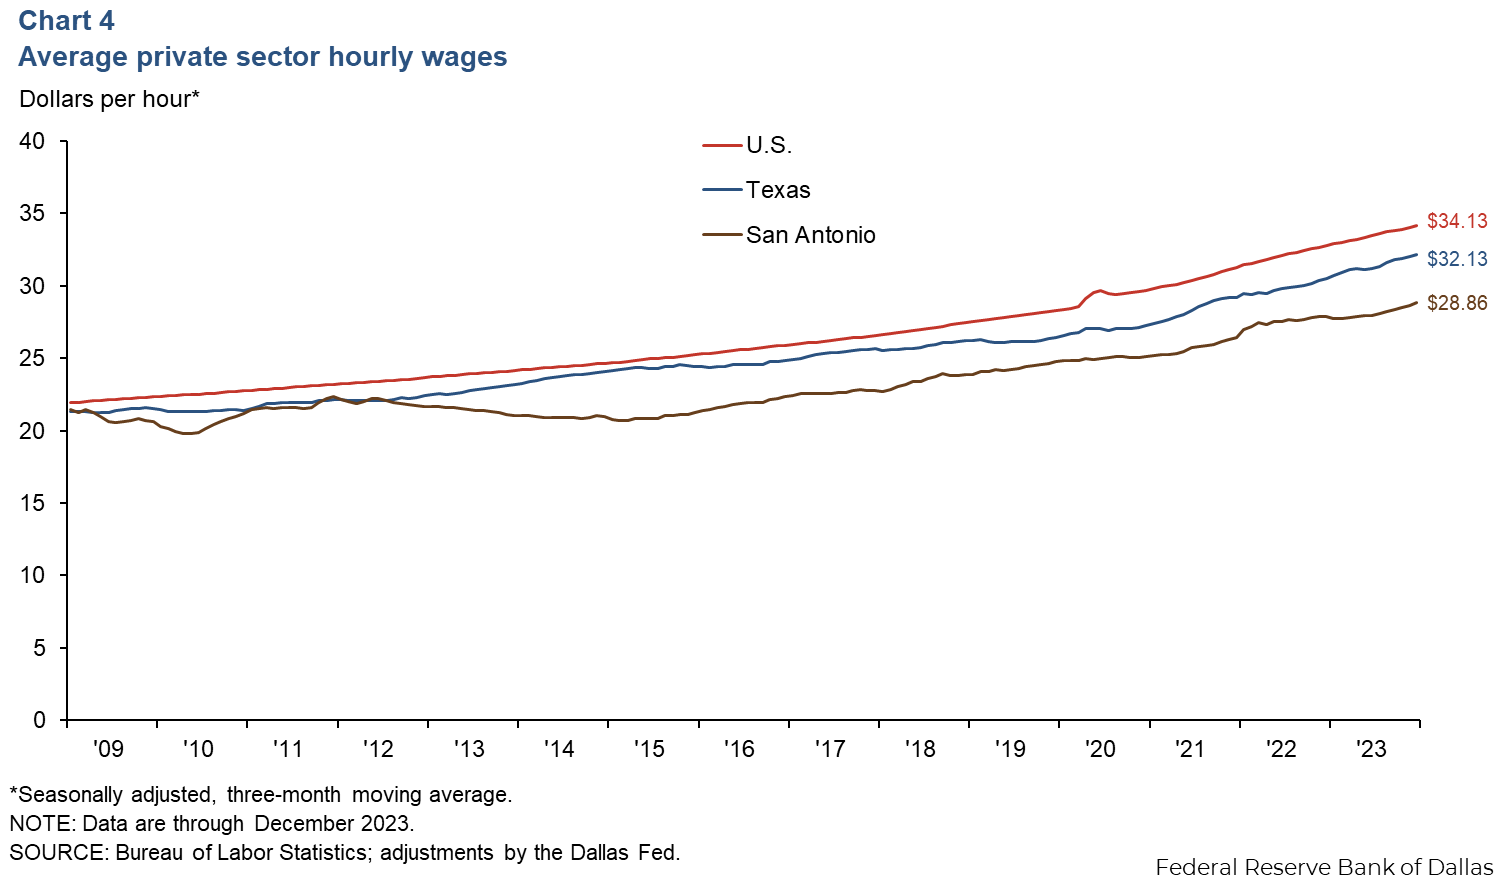
Wages rise
San Antonio wages rose an annualized 9.9 percent in December, faster than Texas’ increase (4.0 percent) and the nation’s (4.3 percent). The three-month moving average of hourly wages in San Antonio was $28.86, below both the state average of $32.13 and the national average of $34.13 (Chart 4). In the past year, wages in San Antonio have risen 3.6 percent, slower than the increases in Texas as a whole (5.4 percent) and the U.S. (4.1 percent).
Retail sales tax revenue
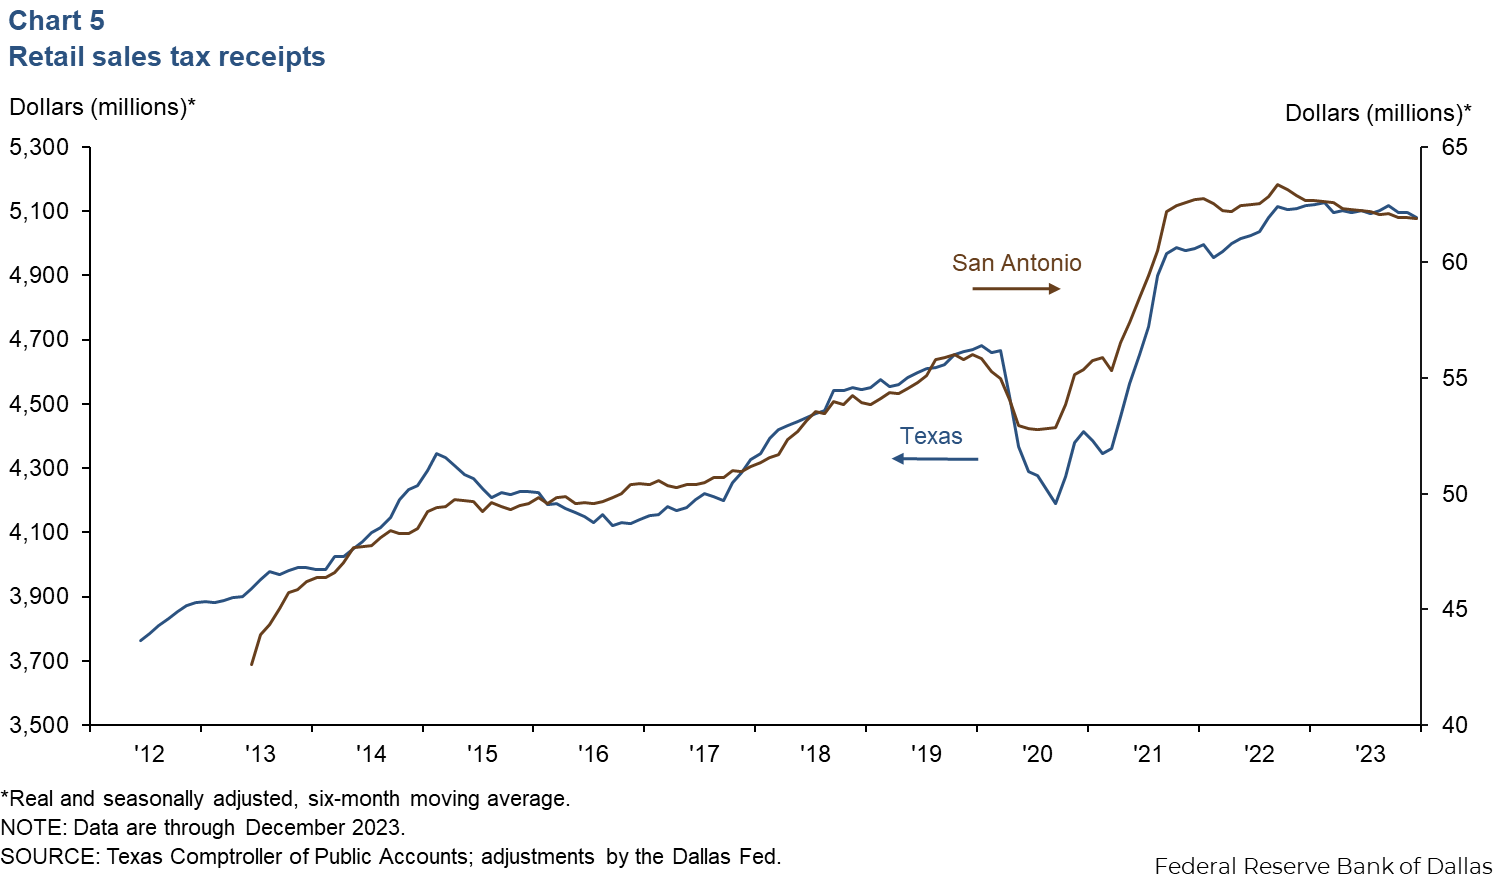
San Antonio’s revenue from sales tax, adjusted for inflation, declined 1.4 percent in December, less than the state’s decline of 3.9 percent (Chart 5). Year over year, the six-month moving average for sales tax revenue fell 1.2 percent in December, a mild improvement over November’s decline of 1.5 percent. State sales tax revenue dropped 0.7 percent in December compared with 2022. San Antonio’s year-over-year sales tax revenue has been declining for eight straight months.
Existing-home sales
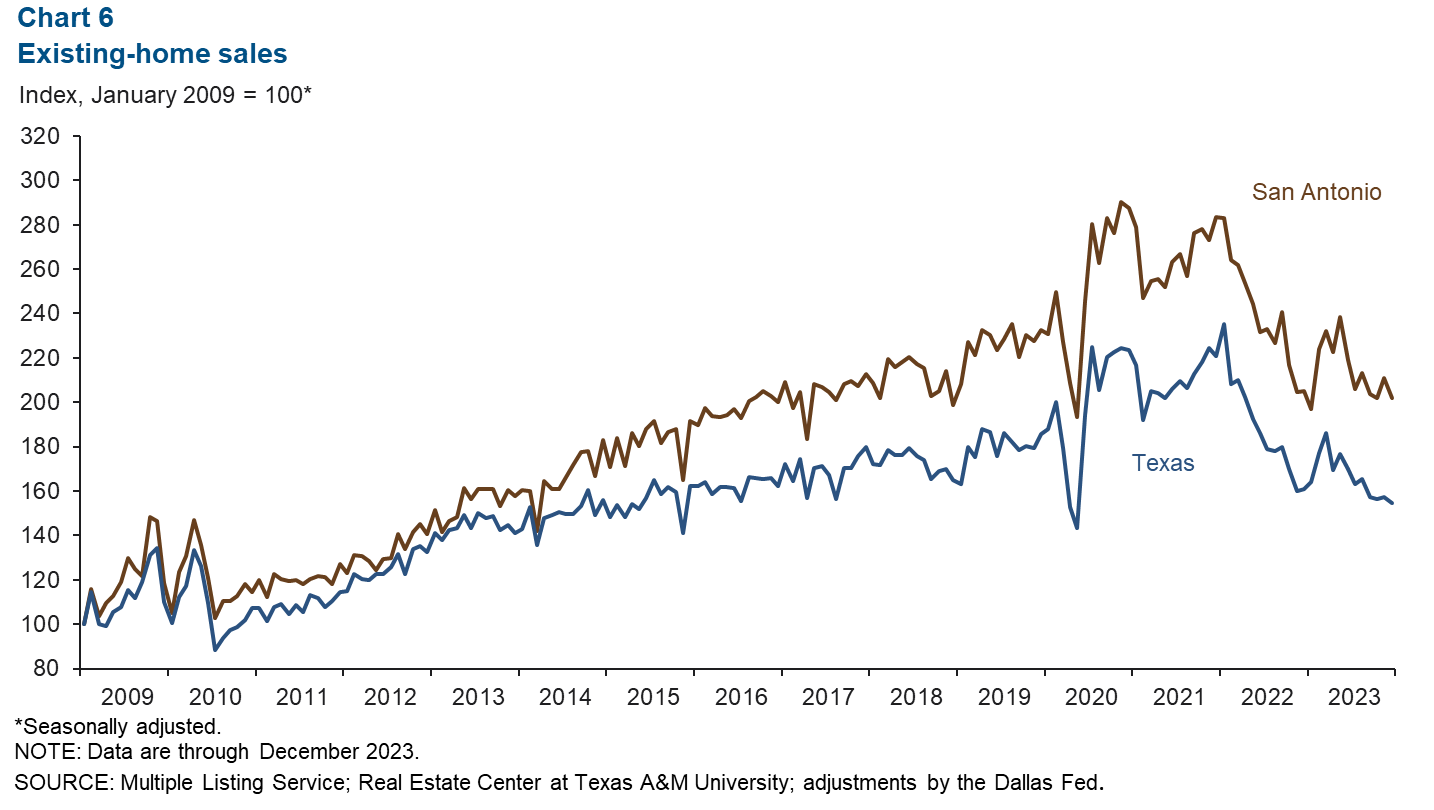
Existing-home sales in San Antonio dropped 4.3 percent in December compared to the 1.8 percent drop statewide (Chart 5). Still, home sales have fared better in San Antonio in 2023 than Texas. Year over year sales are down only 1.5 percent in San Antonio while down 3.8 percent for the state.
NOTE: Data may not match previously published numbers due to revisions.
About San Antonio Economic Indicators
Questions or suggestions can be addressed to Mariam Yousuf at Mariam.Yousuf@dal.frb.org. San Antonio Economic Indicators is published every month during the week after state and metro employment data are released.