Southern New Mexico Economic Indicators

First Quarter 2021
New Mexico and Las Cruces payrolls saw monthly job gains but remained down from year-ago levels due to the effects of the COVID-19 pandemic. Daily COVID-19 cases and deaths declined, and local mobility and engagement improved. Both Doña Ana County and New Mexico consumer credit and debit card spending exceeded prepandemic levels. Monthly oil production and the rig count in New Mexico fell. Copper prices rose in February, while potash prices held steady.
Labor Market
In February, Las Cruces payrolls grew an annualized 2.9 percent (168 jobs nonannualized), largely driven by gains in the leisure and hospitality sector (362 nonannualized). Since the onset of the pandemic a year ago, Las Cruces payrolls have contracted 6.2 percent (-4,579 jobs) (Chart 1). Employment losses were particularly severe in leisure and hospitality (-1,970) and government (-1,550). The only sector seeing job gains during this period was manufacturing, which expanded 7.2 percent (197).
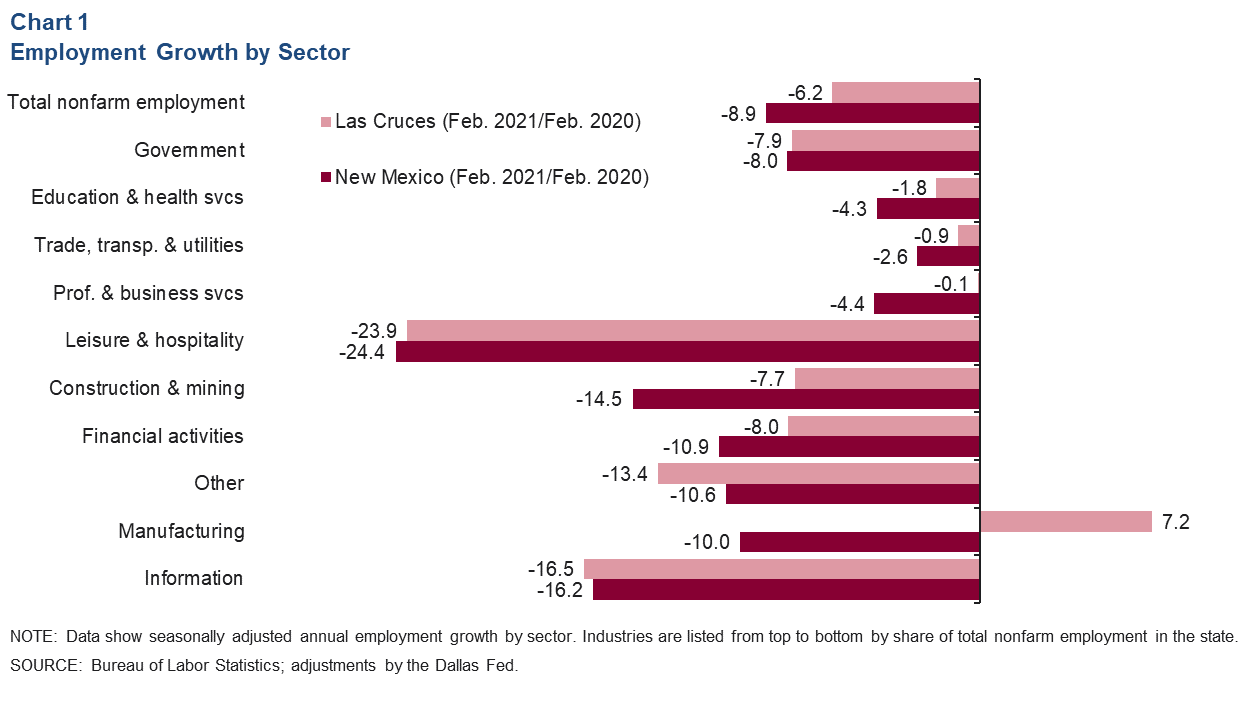
Likewise, the state’s labor market shrank 8.9 percent (-77,100 jobs) in February 2021 from year-ago levels. Declines in New Mexico employment were led by leisure and hospitality (-24,600, nonannualized), government (-15,100), and construction and mining (-11,200). From January to February, New Mexico employment grew an annualized 11.4 percent (7,000, nonannualized).
In January 2021 (latest data available), the southern New Mexico unemployment rate was 9.4 percent, up from 9.0 percent a month prior. Lea County’s unemployment rate was the highest in southern New Mexico at 14.0 percent, while Hidalgo County’s unemployment rate was the lowest in the region at 5.5 percent. Meanwhile, the unemployment rate in Las Cruces rose from 8.2 percent in December to 8.6 percent in January. Conversely, New Mexico’s unemployment rate fell from 9.0 percent in January to 8.8 percent in February.
COVID-19 Cases and Deaths and Local Mobility Trends
After peaking in late November, daily COVID-19 cases have generally trended down since the start of 2021. The seven-day moving average of daily cases in Doña Ana County as of March 28 was 29 per day (Chart 2). Daily COVID-related deaths have also declined, with one death per day on average as of March 28.
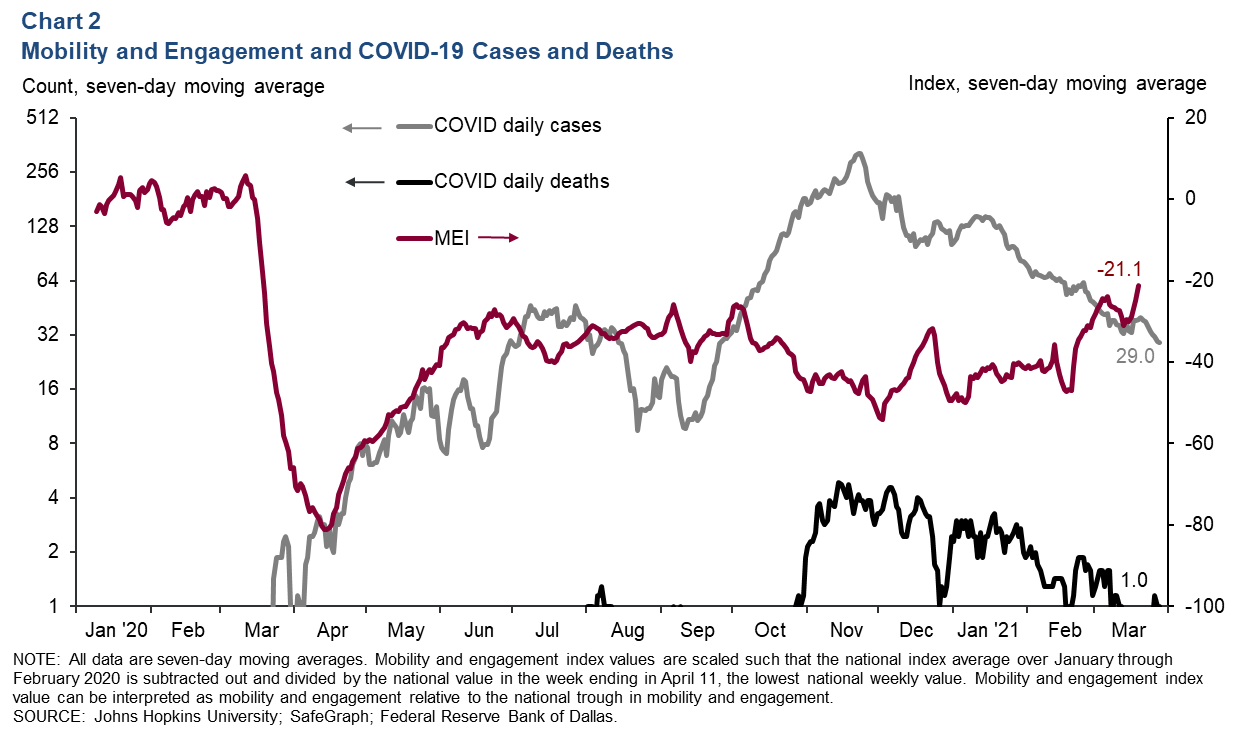
The Dallas Fed’s Mobility and Engagement Index (MEI) for Doña Ana County bottomed out on April 14, 2020 at -81.1 percent. That means Doña Ana County residents left their homes less often, traveled shorter distances from their home and stayed at other locations for shorter amounts of time as stay-at-home orders were implemented and the economy was partially closed. With improvement in local pandemic-related measures and restrictions loosening, the Doña Ana County MEI during the week of March 20, 2021, was only 21.1 percent lower than January 2020 levels .
Consumer Spending
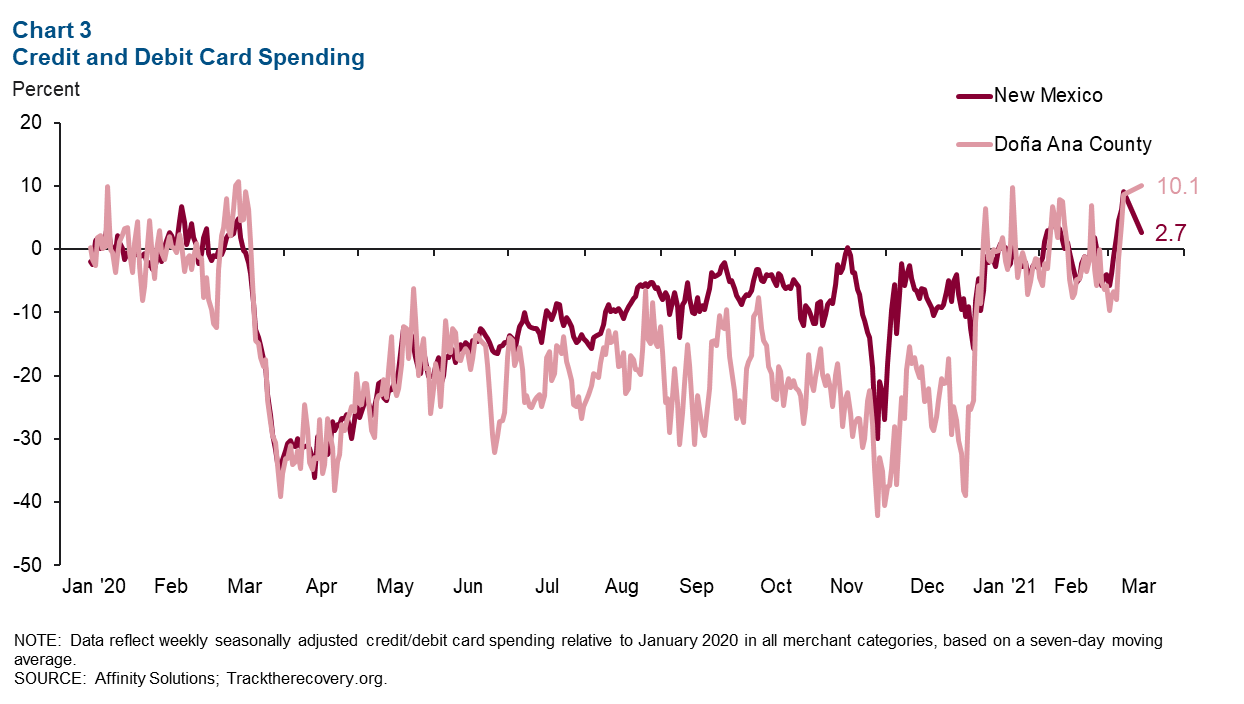
Doña Ana County consumer spending (as measured by credit and debit card purchases) has recovered ground since bottoming out in late November 2020 when weekly spending was down 42.1 percent from January 2020 levels (Chart 3). As of March 14, spending in the county was up 10.1 percent from January 2020 levels, and spending increased 2.7 percent in the state of New Mexico.
Santa Teresa Port Trade
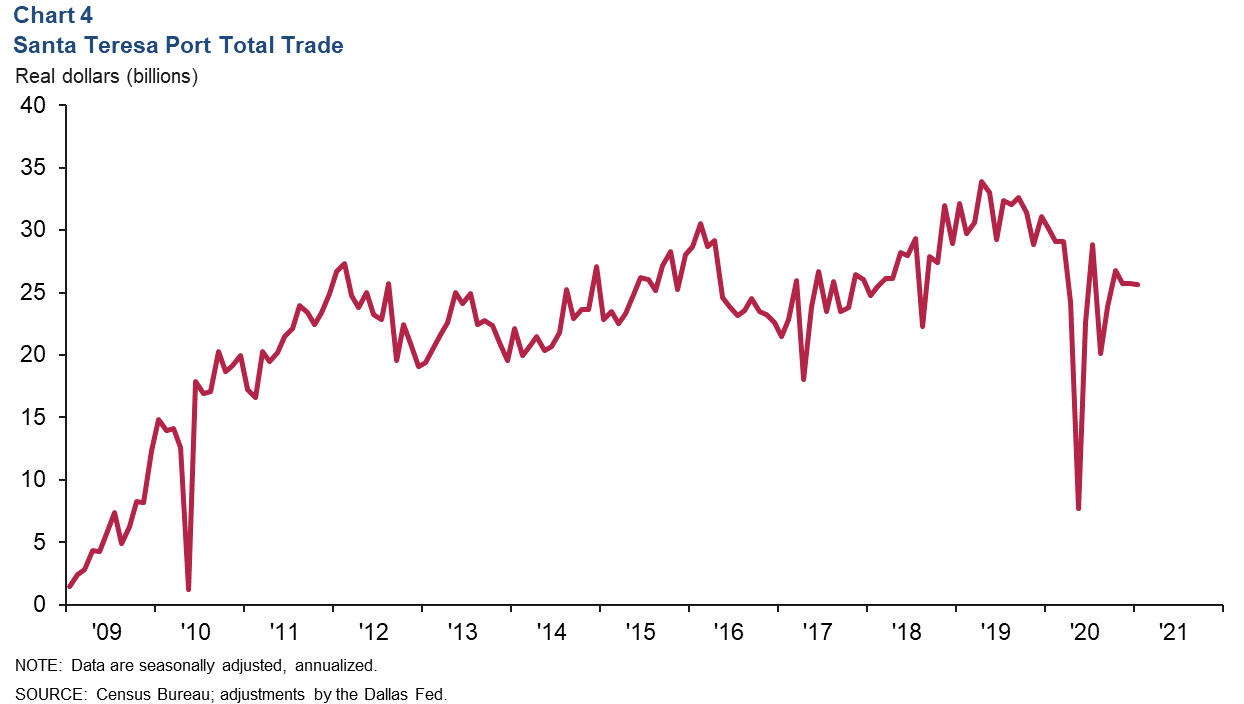
In January, annualized total trade in southern New Mexico was $25.7 billion, 14.8 percent lower than a year prior (Chart 4). The drop in total trade was driven by declines of 20.5 percent in exports and 10.3 percent in imports. Exports were $10.5 billion in January, while imports equaled $15.2 billion.
Commodity Markets
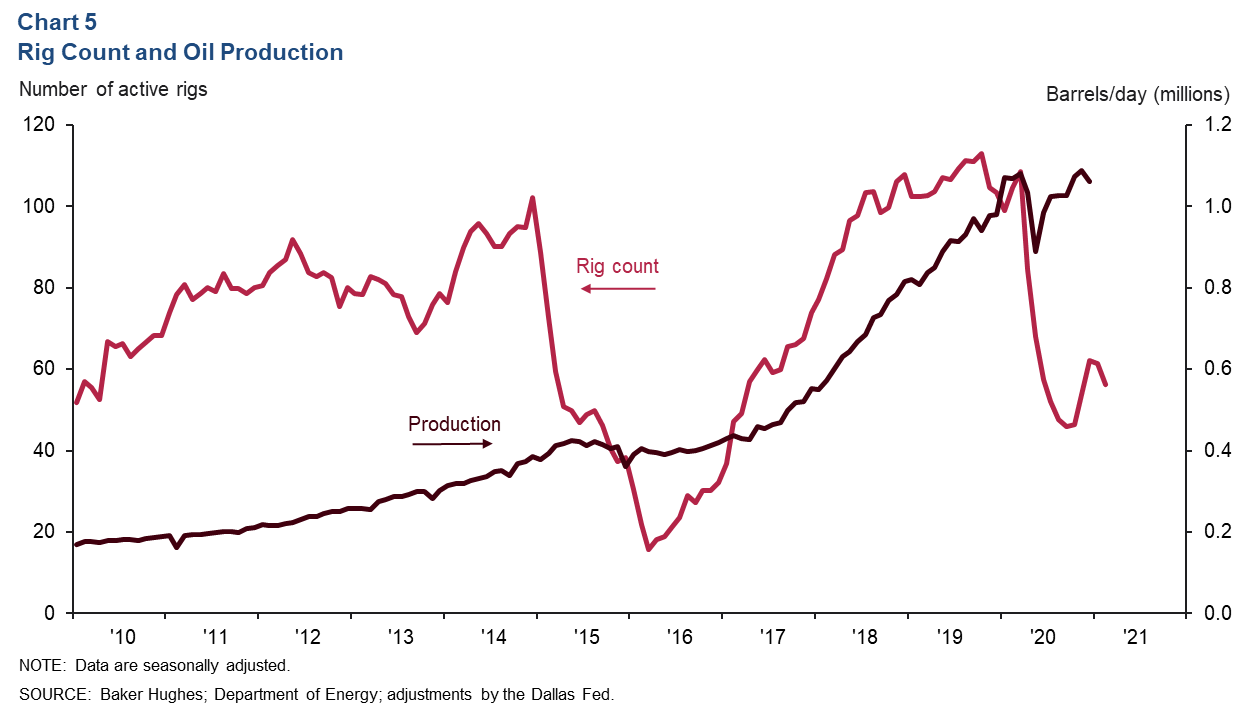
Rig Count, Oil Production Dip
In February, the rig count in New Mexico fell to 56 (Chart 5). Similarly, state oil production volumes fell 2.4 percent to 1.1 million barrels per day in December compared with a month prior.
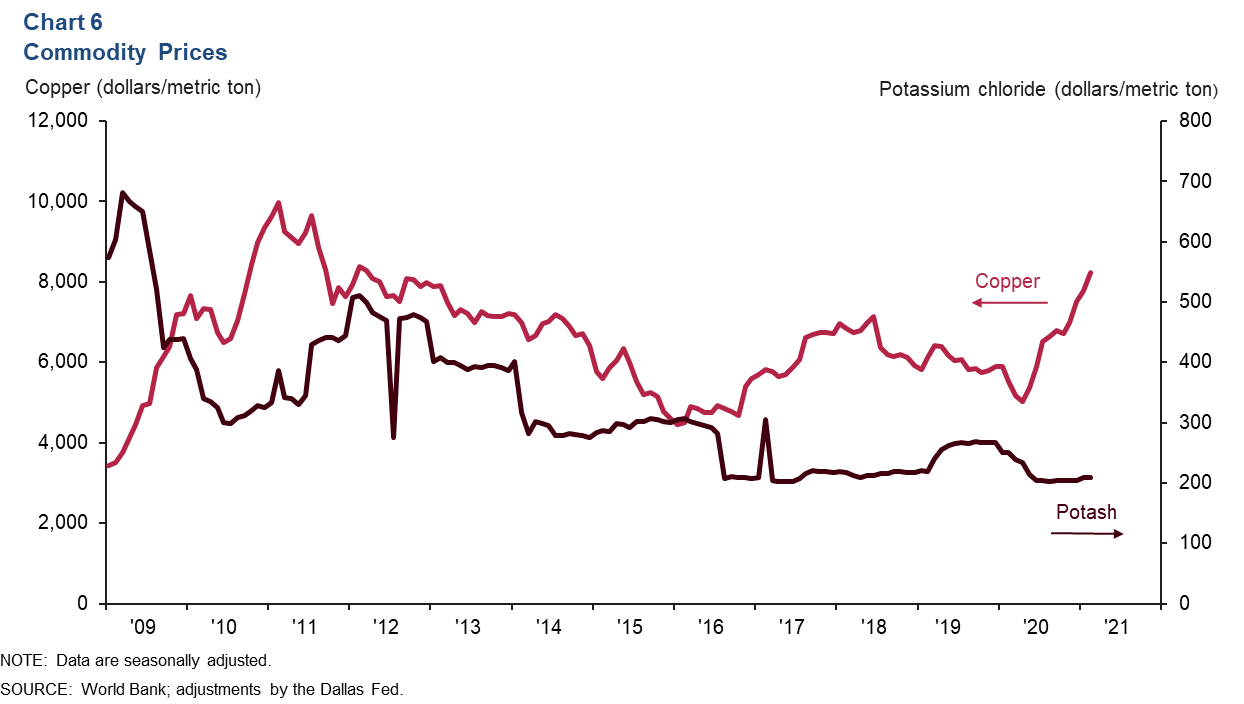
Copper Prices Climb, Potash Stable
In addition to oil and natural gas, southern New Mexico's economy is dependent on other commodities, such as potash, copper and silver. Potash prices remained relatively stable, increasing slightly from $208.24 per metric ton in January to $208.58 in February (Chart 6). Copper prices rose from $7,785 per metric ton in January to $8,231 in February.
NOTES: Data may not match previously published numbers due to revisions. All New Mexico counties within the Federal Reserve’s Eleventh District are counted as part of southern New Mexico. Las Cruces is excluded from southern New Mexico to better gauge unemployment levels outside the region’s largest population center.
About Southern New Mexico Economic Indicators
Questions can be addressed to Keighton Hines at Keighton.Hines@dal.frb.org. Southern New Mexico Economic Indicators is released quarterly.