Southern New Mexico Economic Indicators

Second Quarter 2023
| Las Cruces economy dashboard, June 2023 | |||
| Job growth (annualized) March–June '23 |
Unemployment rate |
Avg. hourly earnings |
Avg. hourly earnings y/y |
| 2.1% | 4.2% | $26.14 | -0.1% |
The Las Cruces economy grew moderately in the second quarter. Total nonfarm employment increased, but unemployment edged up. Consumer spending in Doña Ana County remained strong compared with prepandemic levels. Trade through the Santa Teresa port increased. The rig count increased, while crude oil production declined. Potash prices fell, and copper prices moderated.
Labor market
Payrolls continue to expand
Las Cruces payrolls grew an annualized 2.1 percent in the second quarter (400 jobs) (Chart 1). Gains were concentrated in government (530), education and health services (380), and professional and business services (164). Information employment increased from 510 employees in March to 618 in June, causing a large percentage increase in the other services and information sector. Trade, transportation and utilities was the only sector to lose jobs (167).
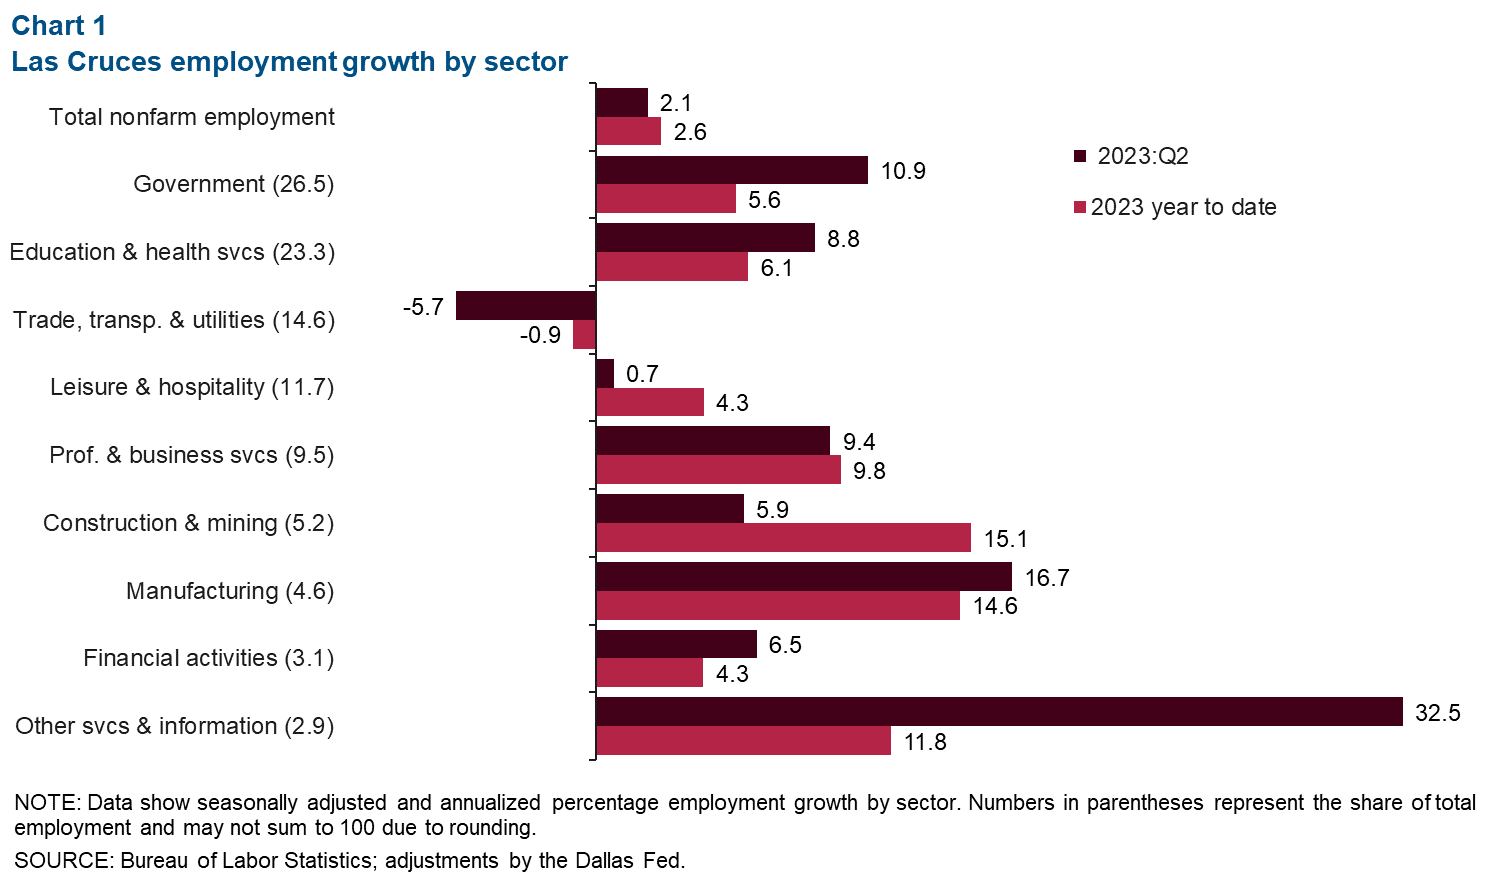
Total nonfarm employment has grown 2.6 percent year to date (1,000 jobs). Employment increased across all sectors but trade, transportation and utilities (54). Government (558) and education and health services (532) added the most jobs on net.
Unemployment rises
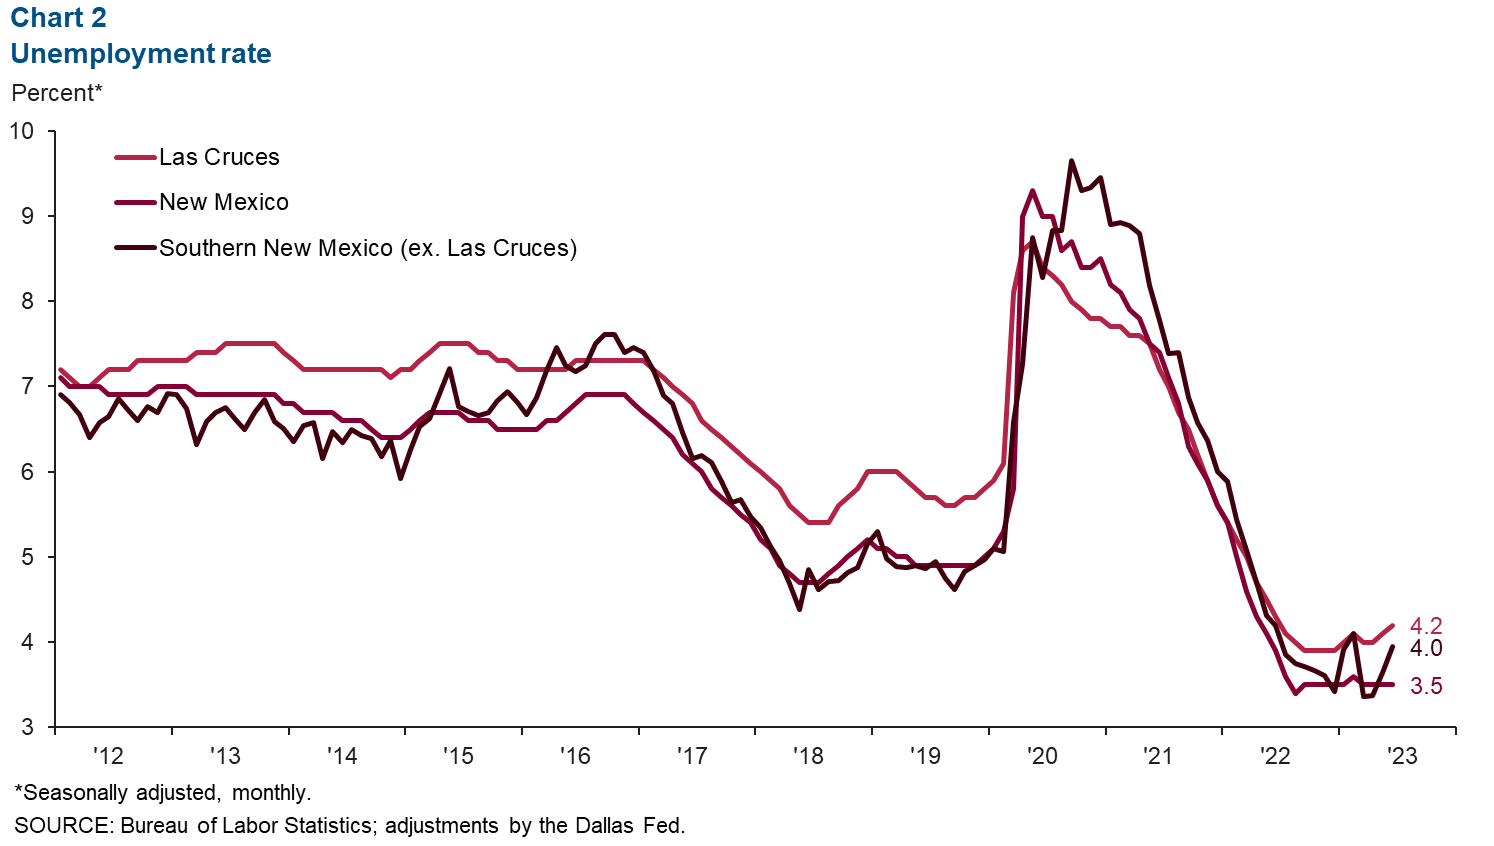
Las Cruces unemployment increased from 4.1 percent in May to 4.2 percent in June (Chart 2). Unemployment in southern New Mexico, excluding Las Cruces, rose to 4.0 percent. Statewide unemployment remained flat at 3.5 percent.
Consumer spending
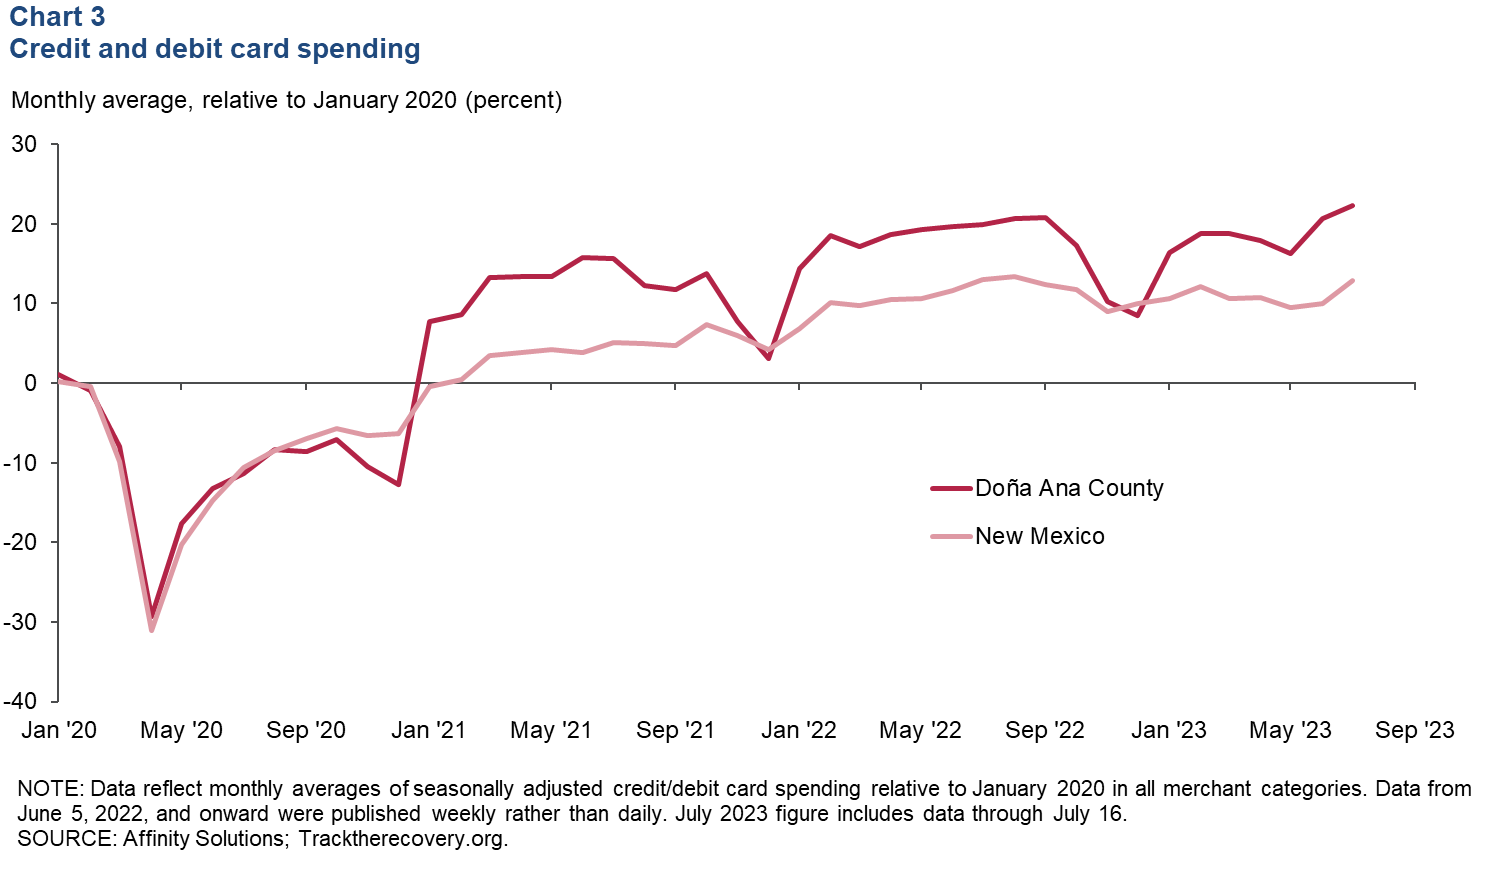
Doña Ana County consumer spending remained above prepandemic levels in July (Chart 3). Credit and debit card spending in the county was up 2.4 percentage points from July 2022, compared with a 0.1-percentage-point decrease in New Mexico.
Cross-border trade
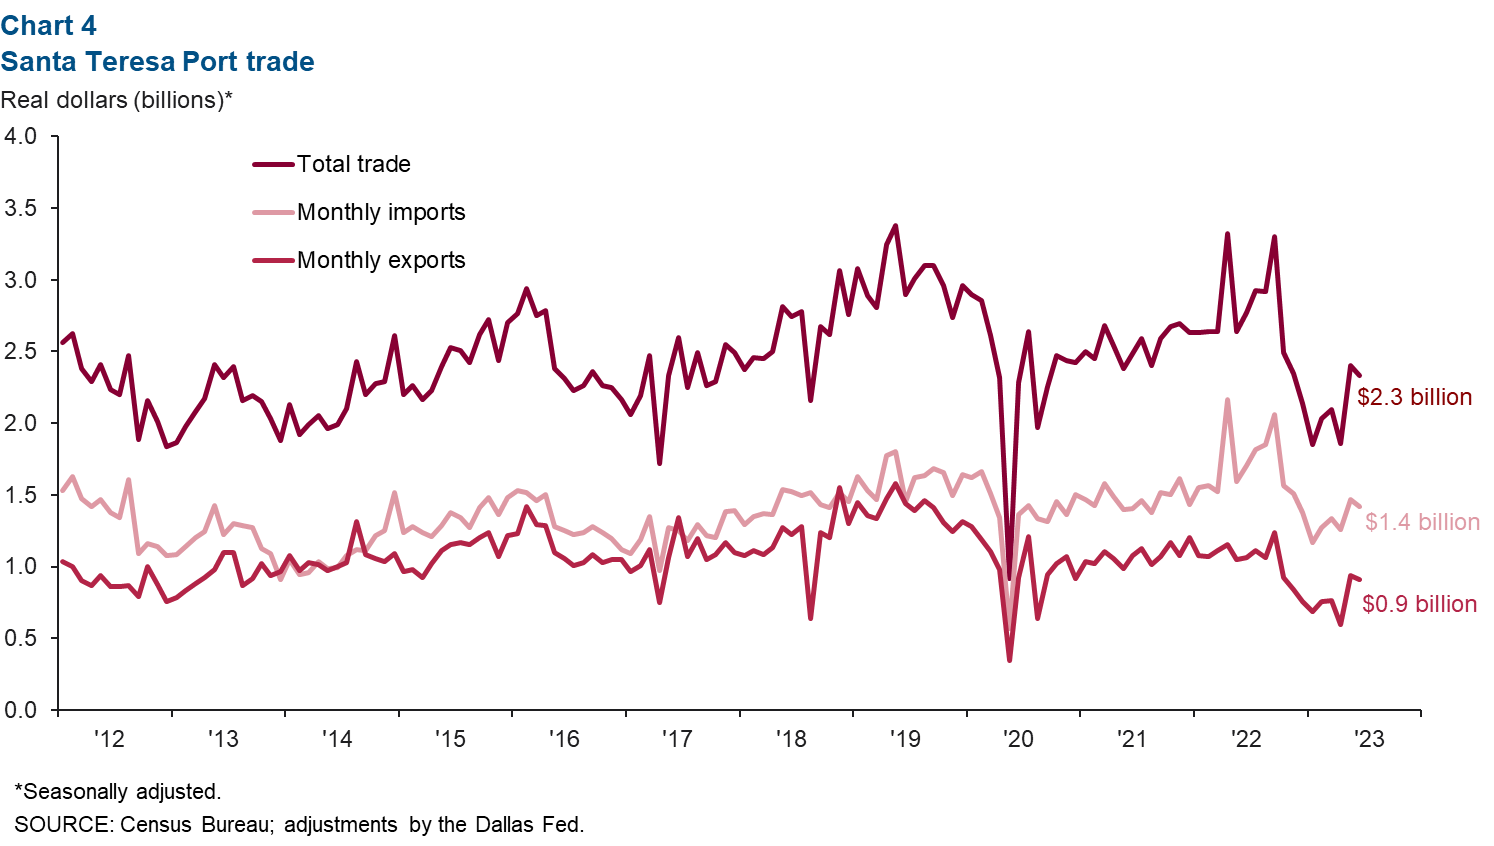
Monthly trade through the Santa Teresa port totaled $2.3 billion in June, down 15.8 percent from June 2022 (Chart 4). However, total trade increased 10.4 percent in the second quarter; imports grew 9.9 percent, and exports rose 11.2 percent.
Commodity markets
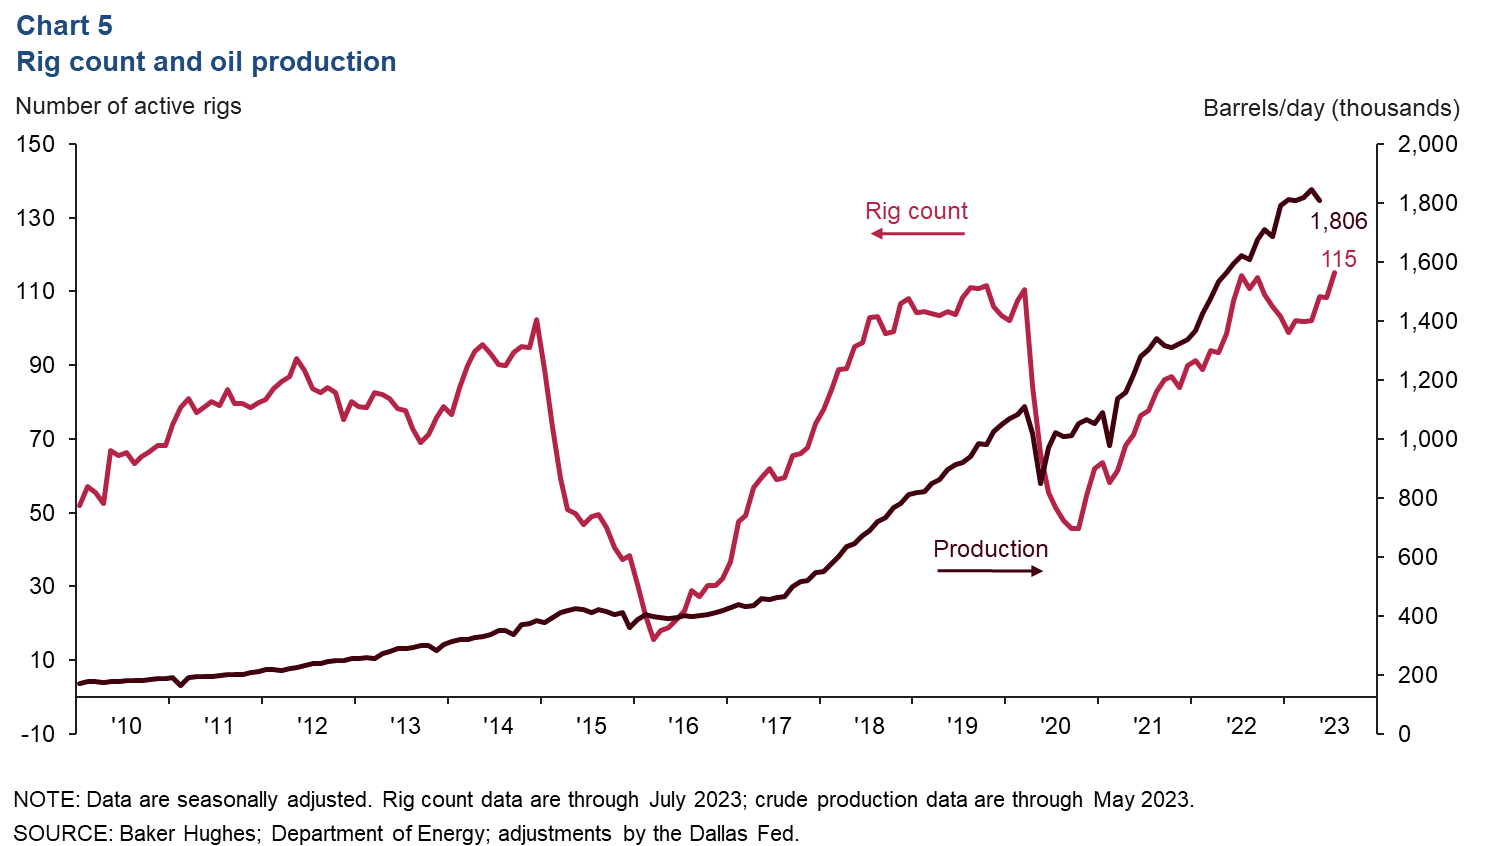
Rig count edges up; crude oil production stabilizes
The New Mexico rig count increased from 108 in June to 115 in July (Chart 5). After falling in the last few months of 2022, it climbed steadily through the first half of 2023. Crude oil production declined in May, down 2.1 percent from April but up 15.5 percent from May 2022.
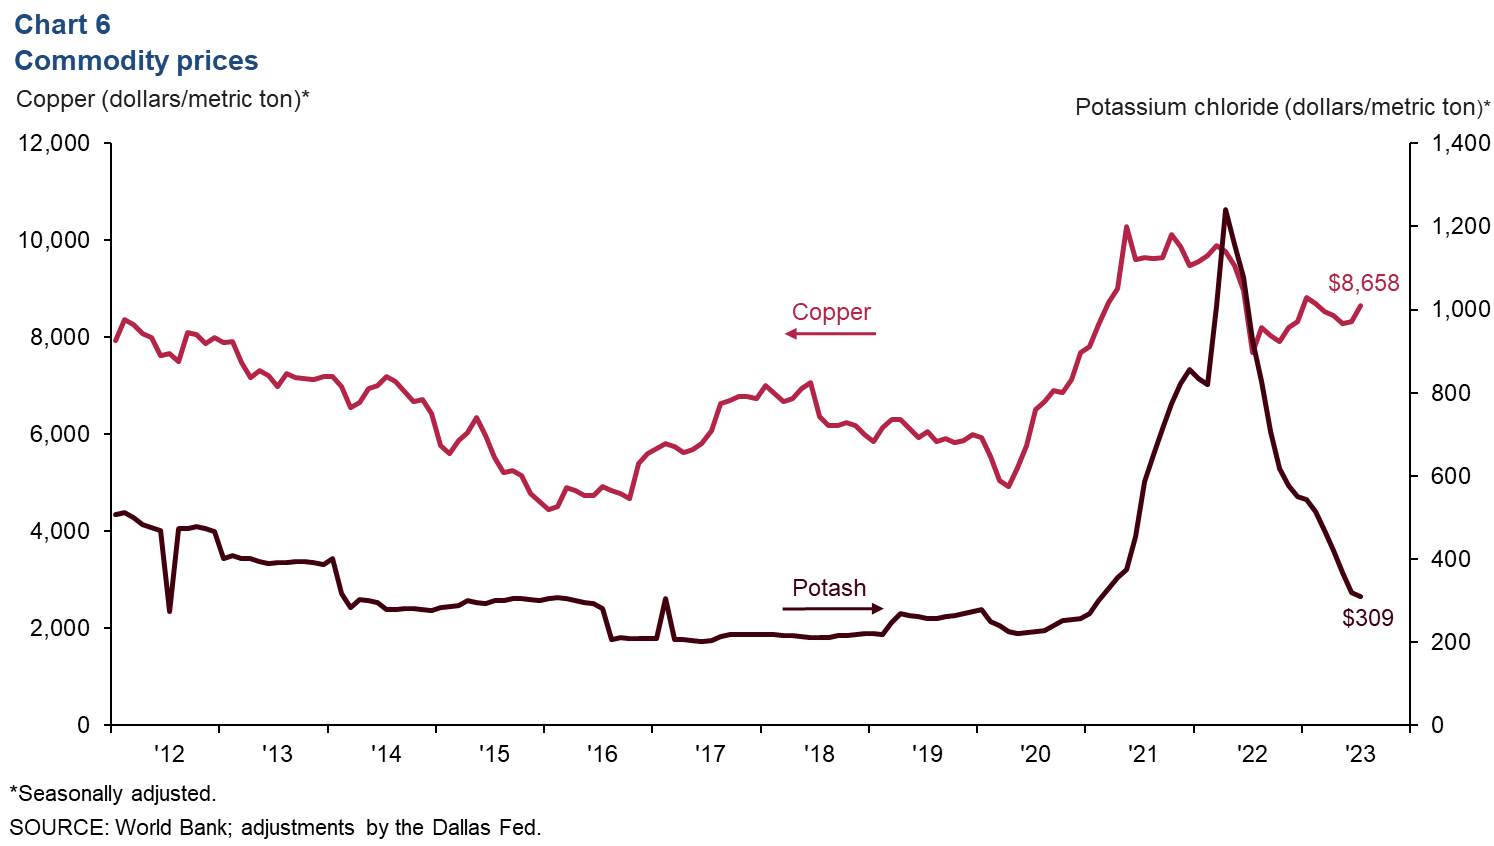
Potash prices fall while copper prices moderate
In addition to oil and natural gas, southern New Mexico’s economy is dependent on other commodities, such as potash, copper and silver. The price of potash, which is used in fertilizer, increased dramatically after producer Russia invaded Ukraine and was hit with sanctions. However, potash prices have declined significantly since their peak in April 2022. They fell 3.4 percent in July 2023 to $309 per metric ton after falling 31.9 percent in the second quarter (Chart 6). Copper prices rose 4.0 percent in July after declining 2.5 percent in the second quarter.
NOTES: Data may not match previously published numbers due to revisions. All New Mexico counties within the Federal Reserve’s Eleventh District are counted as part of southern New Mexico. Las Cruces is excluded from southern New Mexico to better gauge unemployment levels outside the region’s largest population center.
About Southern New Mexico Economic Indicators
Questions or suggestions can be addressed to Aparna Jayashankar at Aparna.Jayashankar@dal.frb.org. Southern New Mexico Economic Indicators is released quarterly.