Texas Economic Indicators

March 15, 2022
The Texas economy continued to experience broad-based growth in January, with both employment and the business-cycle index climbing. Wage growth moderated but remained elevated, according to February’s Texas Business Outlook Surveys. Oil prices skyrocketed in recent weeks as the Russia–Ukraine conflict escalated but have slipped the past few days. Natural gas prices and the Texas rig count rose. Texas exports fell in January but remained close to their recent highs.
Labor market
Texas employment gains continue
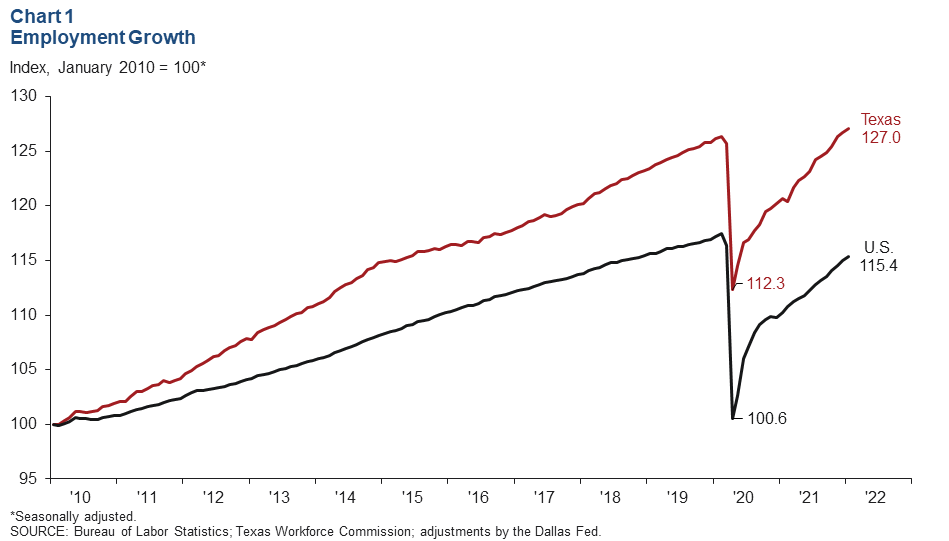
Texas employment expanded an annualized 3.6 percent (37,900 jobs) in January after increasing an upwardly revised 3.4 percent in December (Chart 1). Gains were widespread across sectors, with only the construction sector posting declines. The January data, which incorporate the annual benchmark, show that Texas regained its prepandemic level of employment in December 2021. In contrast, the U.S. remained 1.4 percent below. The Dallas Fed’s Texas Employment Forecast predicts 2.9 percent job growth this year (December/December).
Metro job growth mixed
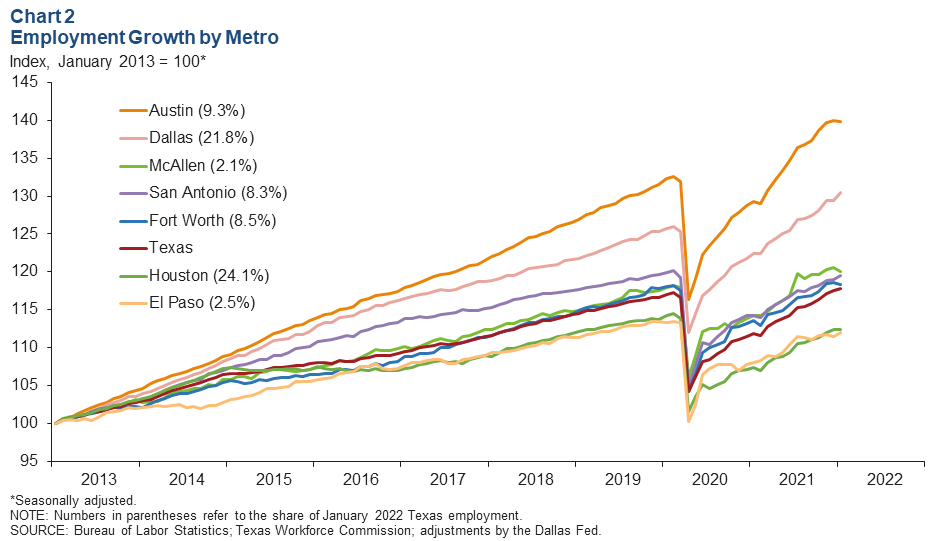
January employment growth was mixed among the major Texas metros (Chart 2). Dallas had the strongest growth, with payrolls increasing an annualized 9.9 percent. San Antonio and El Paso payrolls climbed an annualized 5.9 and 4.6 percent, respectively. Houston payrolls were flat at 0.3 percent, while employment contracted in Austin, Fort Worth and McAllen.
Business-cycle index
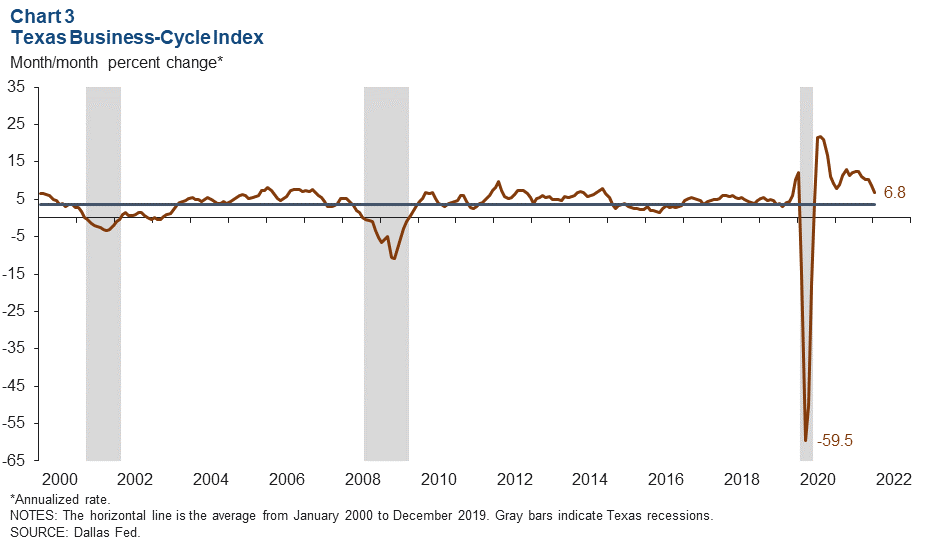
The Texas Business-Cycle Index—a composite of the unemployment rate, state payroll employment and gross state product—reflects underlying economic activity in the state. In January, the index grew at an above-average annualized pace of 6.8 percent (Chart 3). While index growth was robust, it moderated from December’s 8.7 percent increase.
Texas Business Outlook Surveys
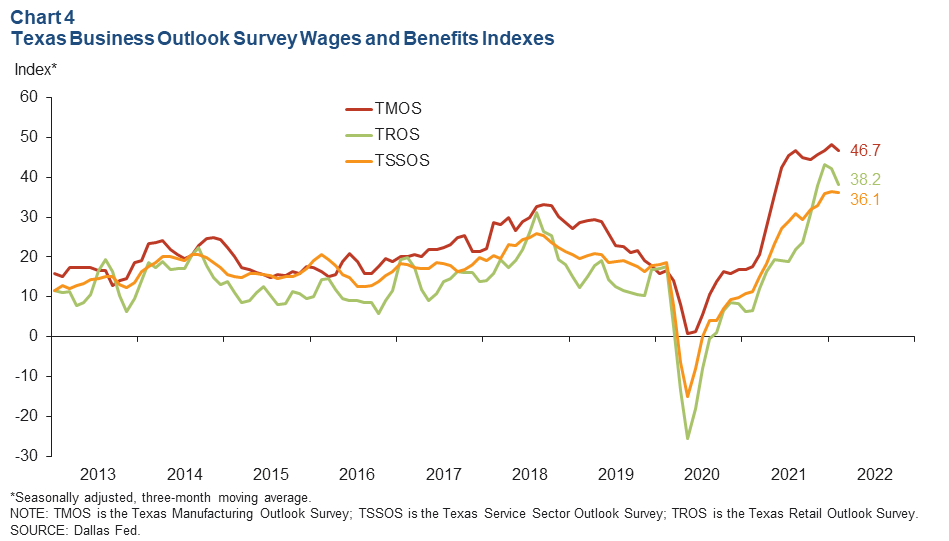
The Texas Business Outlook Surveys indicate that wage growth remains strong (Chart 4). In February, the three-month moving average of the manufacturing survey’s wages and benefits index dipped from a record level of 48.2 to 46.7. The service sector wages and benefits index was little changed in February based on a three-month moving average, and the retail sector index fell 3.9 points to 38.2. Despite a slight slowing in wage growth, index levels in all three sectors remained high due to a persistently tight labor market.
Energy
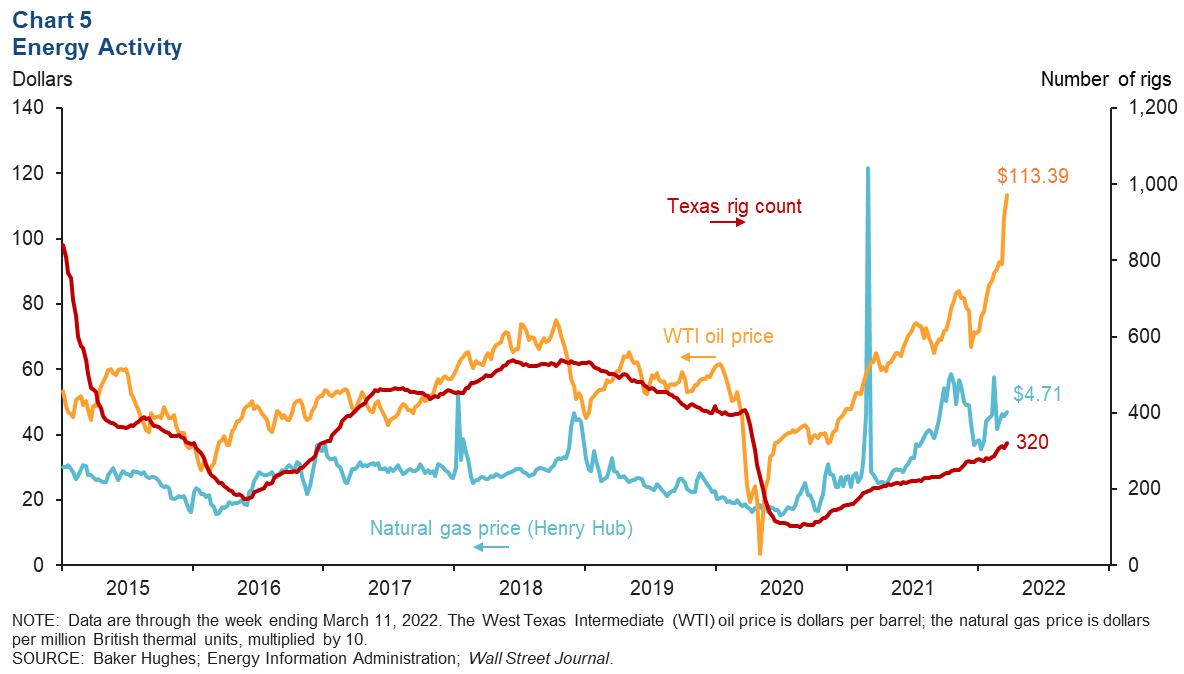
Amid the Russia–Ukraine conflict, oil prices surged to their highest level since 2008 (Chart 5). As of the week ending March 11, the price of West Texas Intermediate (WTI) crude spiked to $113.39 per barrel, an increase of $21.21 since the start of the conflict. Prices have since slid below $100. Natural gas (Henry Hub) prices were less affected by the recent geopolitical tensions, edging up 9 cents to $4.71 per MMBtu from the prior two weeks. The number of active rigs in Texas rose from 312 to 320 over the same period but remained below prepandemic levels.
Texas exports
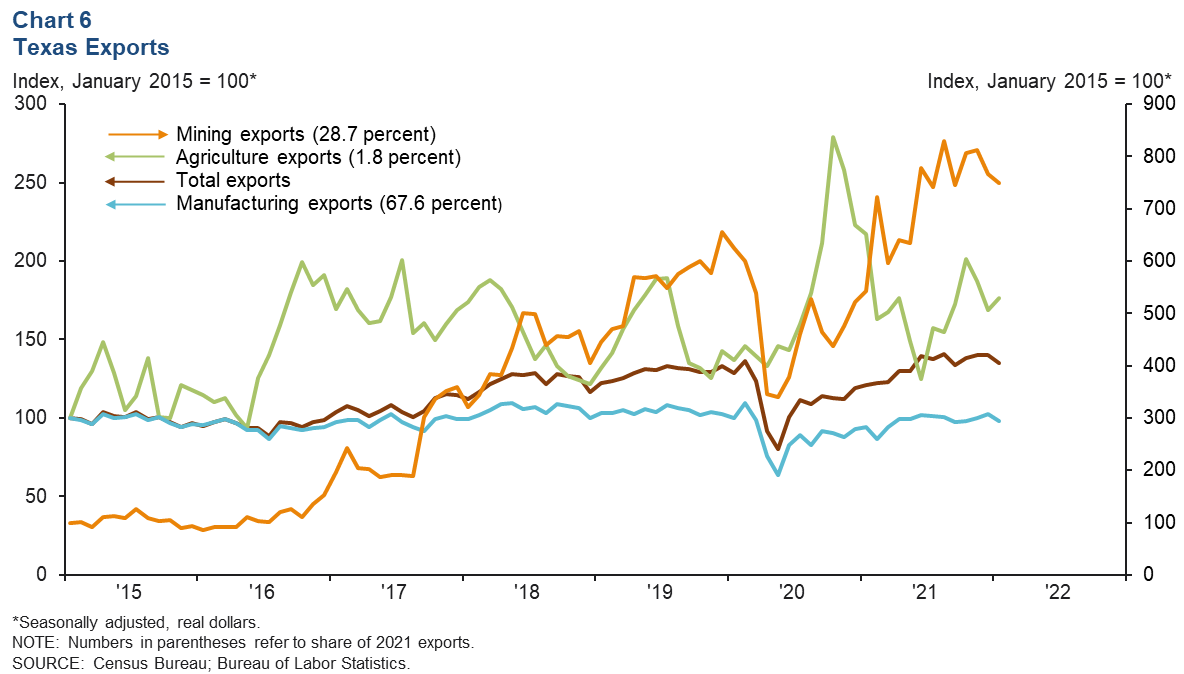
Texas exports dipped in January but remained close to their recent highs (Chart 6). As of January 2022, statewide exports fell 3.7 percent due to a decline in manufacturing and mining exports. Mining exports fell 2.4 percent but were still 25 percent above prepandemic levels. Manufacturing exports fell 4.4 percent and were 10 percent below prepandemic levels. Agricultural exports expanded 4.7 percent and were 21 percent above prepandemic levels. U.S. exports fell 4.4 percent in January.
NOTE: Data may not match previously published numbers due to revisions.
About Texas Economic Indicators
Questions can be addressed to Laila Assanie at Laila.Assanie@dal.frb.org and Mytiah Caldwell at Mytiah.Caldwell@dal.frb.org. Texas Economic Indicators is published every month during the week after state and metro employment data are released.