Texas Economic Indicators

July 26, 2022
The Texas economy continued to expand in June. Employment strengthened in most major sectors, led by growth in the information sector. The Texas Leading Index was flat in June. Oil prices increased in July, while the rig count remained the same. COVID-19 cases were rising due to the highly transmissible BA.5 subvariant. Dining-out levels moderated in July but remained well above comparable 2019 levels.
Labor market
Employment growth remains strong in second quarter
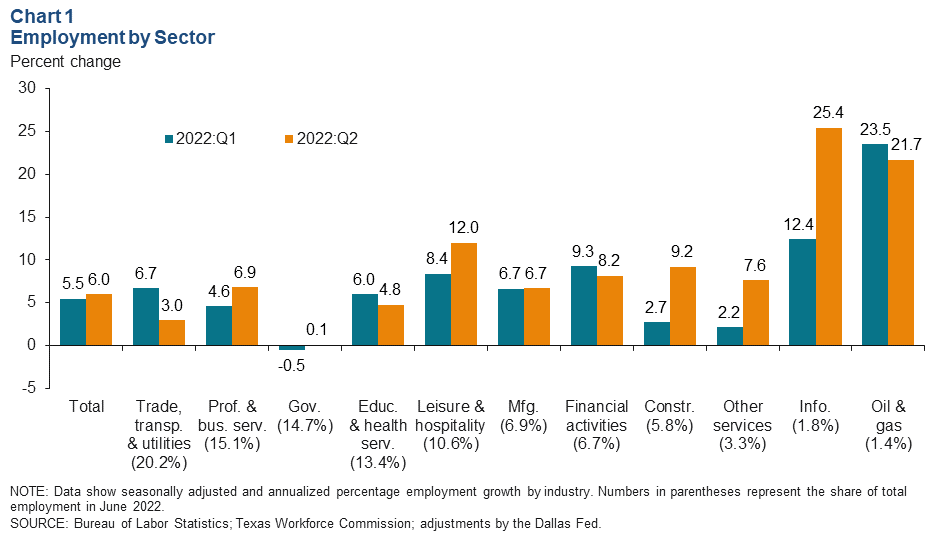
Texas employment expanded an annualized 7.3 percent in June. Job growth was an annualized 6.0 percent (194,750 jobs) in the second quarter after rising an upwardly revised 5.5 percent (175,760) in the first quarter (Chart 1). Second-quarter job growth strengthened in most major sectors, with information services seeing the fastest growth at an annualized 25.4 percent, followed by oil and gas. The Dallas Fed’s Texas Employment Forecast was revised up to predict 4.5 percent job growth this year (December/December).
Job growth accelerates in information services
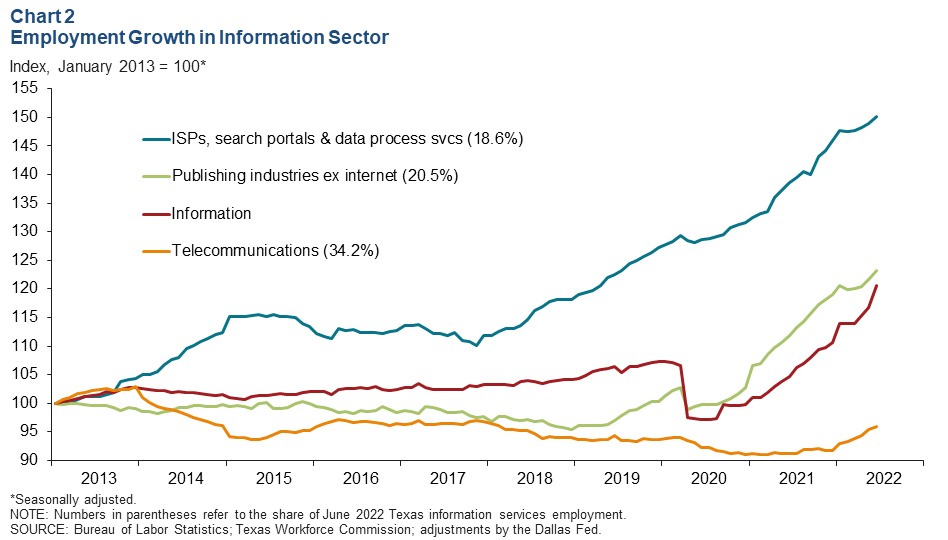
Employment growth in Texas’ information sector strengthened in the second quarter (Chart 2). Growth was broad based, with the publishing subsector, excluding internet, posting the strongest gains at an annualized 10.8 percent. Telecommunications increased an annualized 9.2 percent, while the category encompassing internet service providers, search portals and data processing services rose an annualized 6.8 percent.
Texas leading index
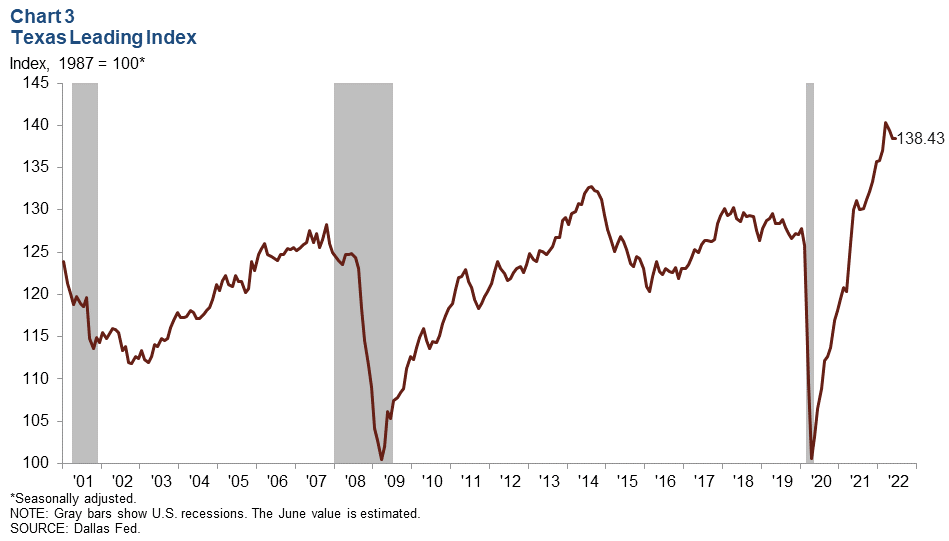
The Texas Leading Index, a composite of eight leading indicators that sheds light on the future of the state’s economy, was relatively flat at 138.4 in June following two months of decline (Chart 3). However, the three-month change remained negative, pulled down by falling stock prices of Texas based firms, a rise in new unemployment claims, a dip in the U.S. leading index and an increase in the Texas value of the dollar, which makes the state’s exports more expensive abroad.
Energy
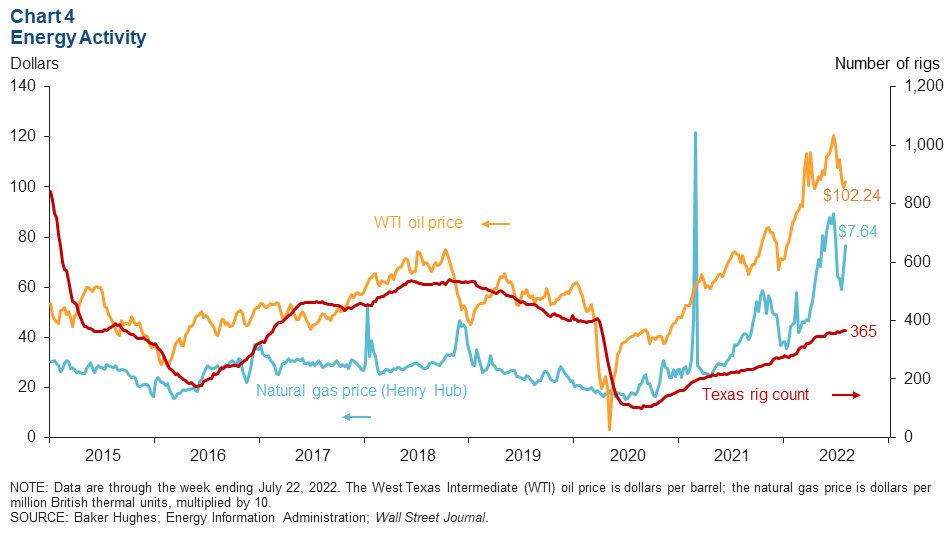
After trending downward in recent weeks, oil prices saw a slight uptick and are near the average year-end price forecast reported in the second-quarter Dallas Fed Energy Survey (Chart 4). As of the week ending July 22, the price of West Texas Intermediate crude increased to $102.24 per barrel, up $2.32 from the previous week. Natural gas (Henry Hub) prices ticked up 88 cents to $7.64 per million British thermal units. The number of active rigs in Texas remained at 365 over the same period, its highest level since late March 2020.
COVID-19 trends
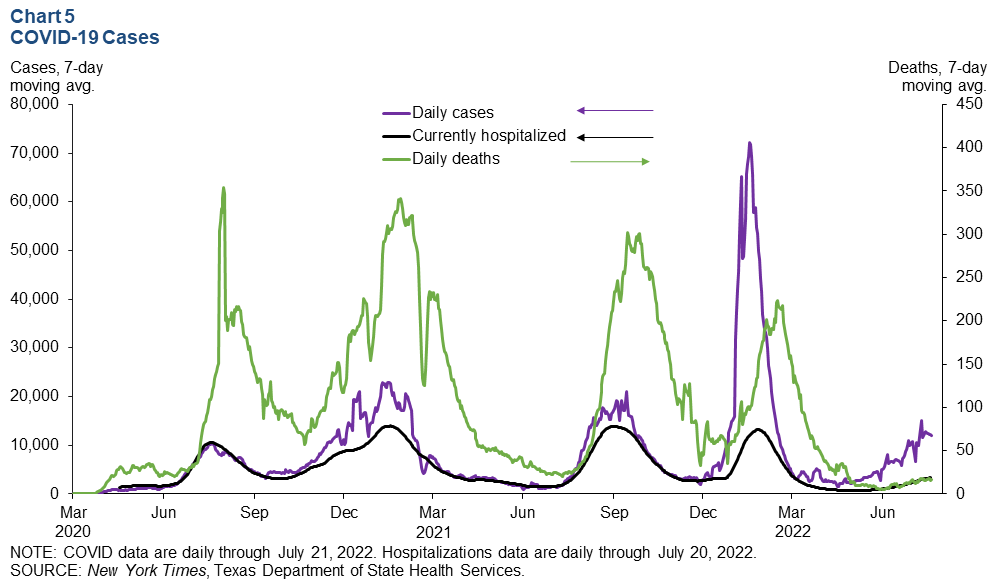
Following a decline in cases in spring 2022, the seven-day average of daily new COVID-19 cases in Texas began increasing in late June and climbed further in July (Chart 5). The highly contagious BA.5 subvariant is suspected to be the primary cause of the recent rise. As of July 21, the number of cases increased to 12,032. COVID-19 daily deaths rose to 17. On July 20, COVID hospitalizations reached a 20-week high of 3,330.
Dining out
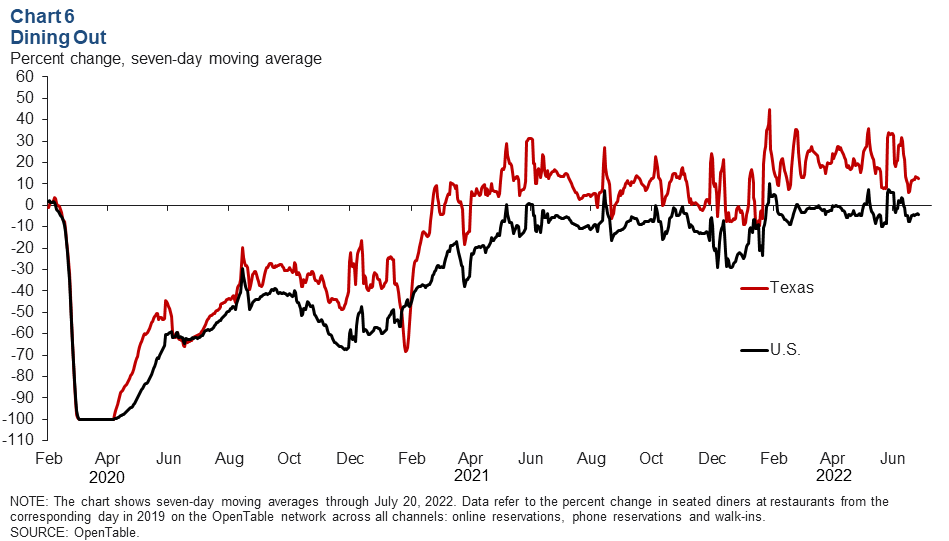
In July, the number of seated-diner reservations at restaurants remained above 2019 levels in Texas but decreased nationwide, based on a seven-day moving average (Chart 6). The U.S. figure dipped into negative territory in early July, and on July 20, it was 4.1 percent below 2019 levels. The Texas figure eased but remained strong amid rising COVID cases and was 12.3 percent above 2019 levels. As of July 20, dining out in Austin and San Antonio was 22.6 percent and 13.2 percent above 2019 levels, respectively. In contrast, dining out was down 10.4 percent in Dallas and 1.7 percent in Houston.
NOTE: Data may not match previously published numbers due to revisions.
About Texas Economic Indicators
Questions can be addressed to Mytiah Caldwell at Mytiah.Caldwell@dal.frb.org. Texas Economic Indicators is published every month during the week after state and metro employment data are released.