Texas Economic Indicators

October 26, 2022
Texas economic activity accelerated in September. Payrolls increased strongly and jobless claims dipped. While job growth picked up, sentiment remained pessimistic, according to the September Texas Business Outlook Surveys. Texas exports expanded slightly in August. Dining out and consumer spending continued to rise in October.
Labor market
Texas employment growth resumes
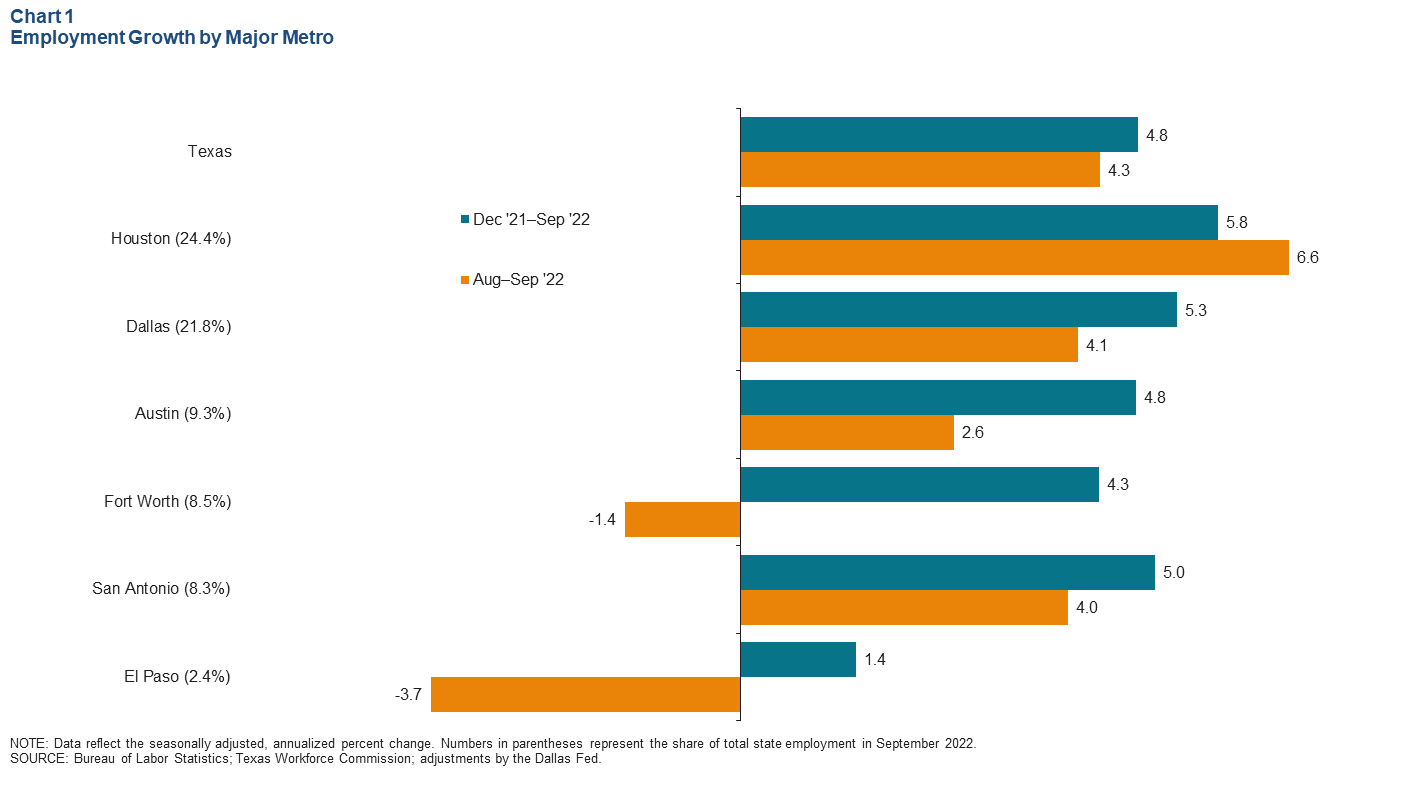
Texas employment expanded an annualized 4.3 percent in September after posting no growth in August (Chart 1). Most major Texas metros saw strong gains in September, except for Fort Worth and El Paso. Houston took the lead at 6.6 percent. Payrolls climbed an annualized 4.1 percent in Dallas and 2.6 percent in Austin. Year-to-date employment growth in nearly all Texas metros was positive. The Dallas Fed’s Texas Employment Forecast is for 4.4 percent growth this year (December/December), up from 4.2 percent in September.
Initial unemployment claims remain at low levels
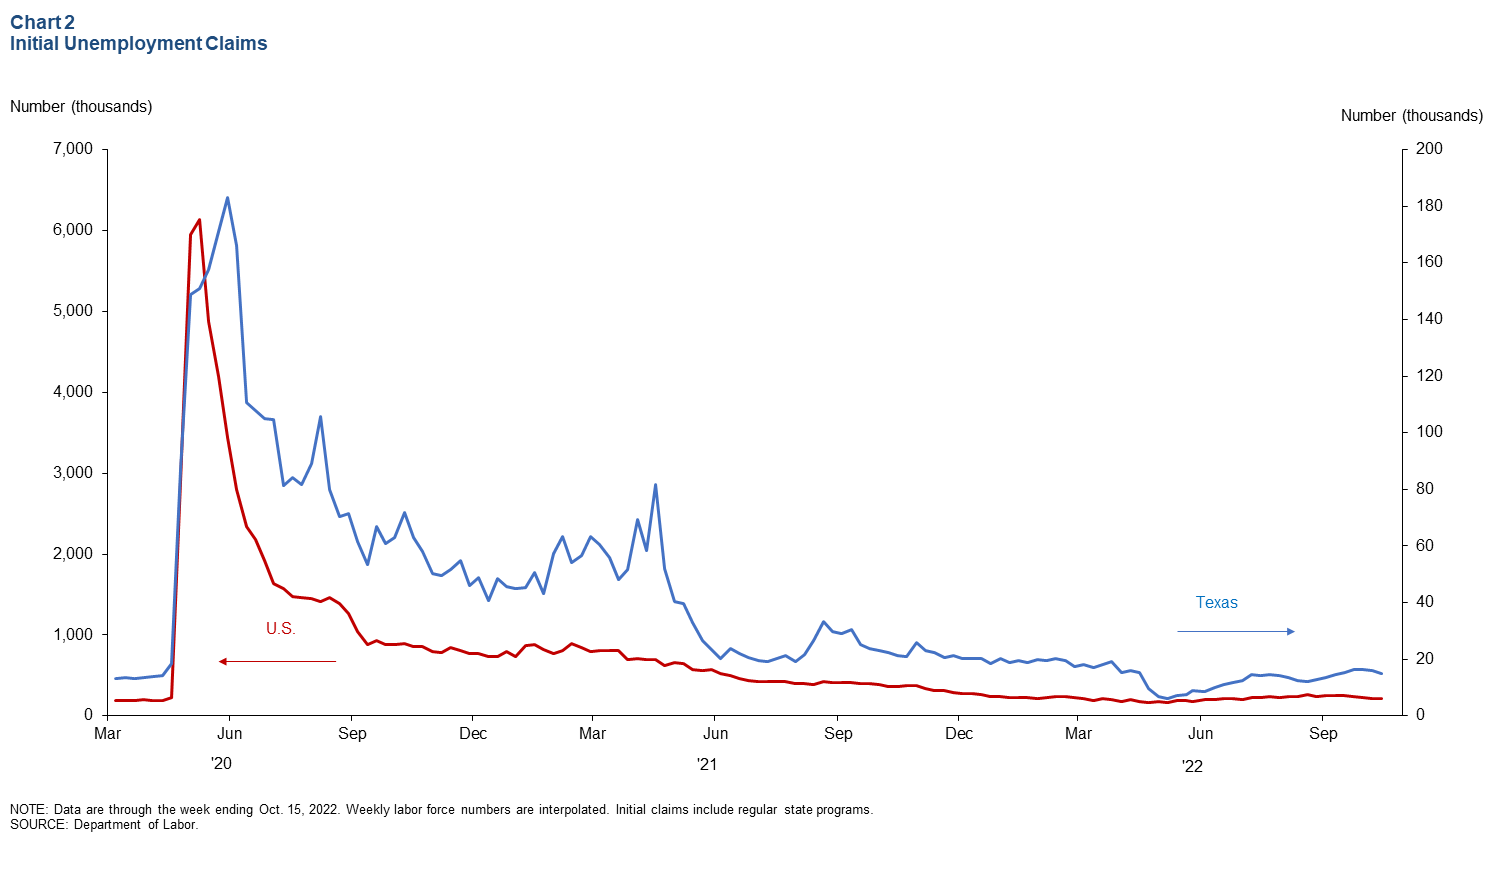
Weekly initial unemployment claims fell nationally and in Texas in mid-October (Chart 2). During the week ending Oct. 15, initial claims in Texas fell from the previous week by 1,531 to 15,468, while claims nationally fell by 12,000 to 214,000. The state’s initial filings are above the postpandemic low of 6,184 in April and prepandemic levels (February 2020). The Texas unemployment rate was 4.0 percent in September, while U.S. unemployment decreased to 3.5 percent.
Texas Business Outlook Surveys
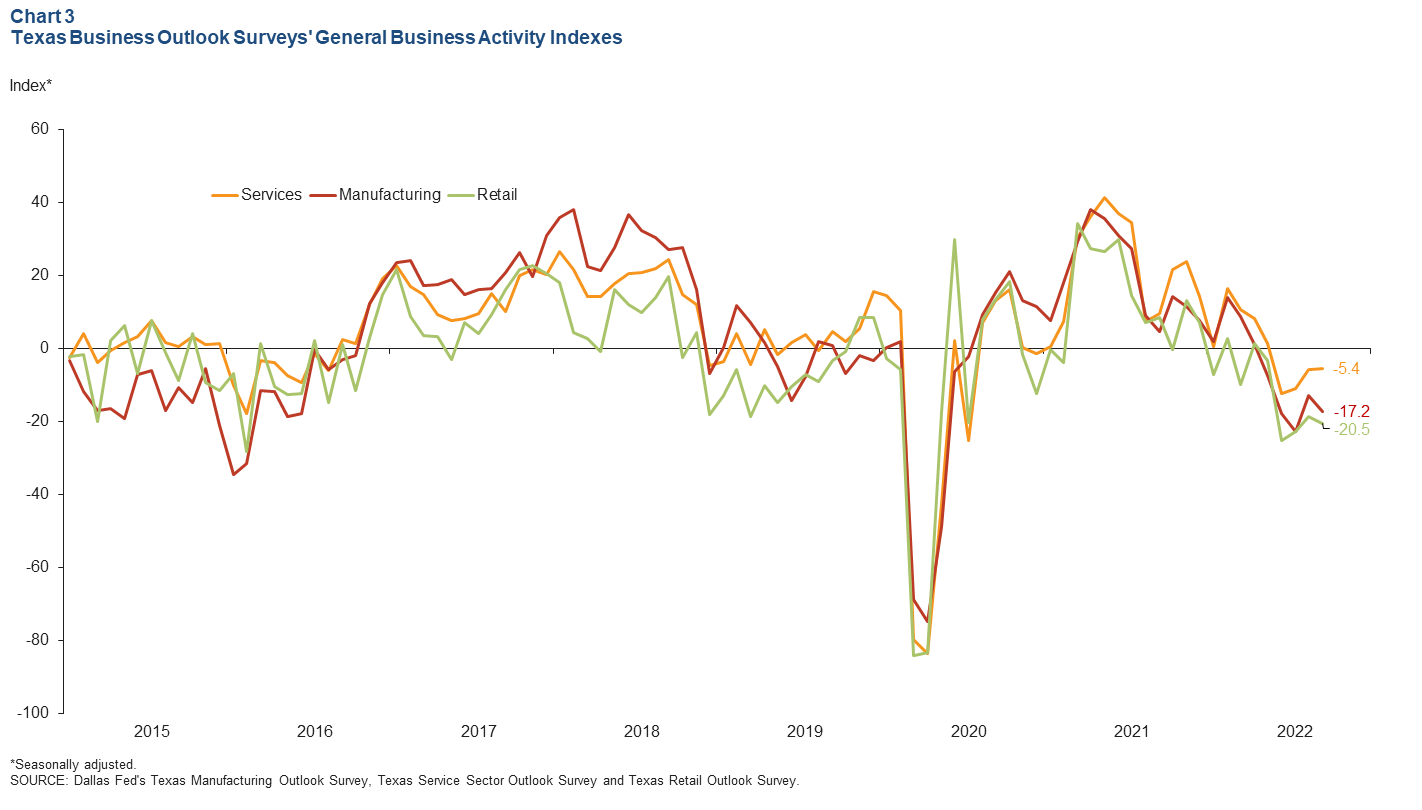
Perceptions of broader business conditions remained negative in September’s Texas Business Outlook Surveys (Chart 3). The general business activity indexes for the manufacturing and retail sectors were negative for the fifth consecutive month. The manufacturing business activity index dipped 4.3 points to -17.2, while the retail index fell 1.9 points to -20.5. The service sector business activity index was negative for the fourth consecutive month and held steady at -5.4.
Exports
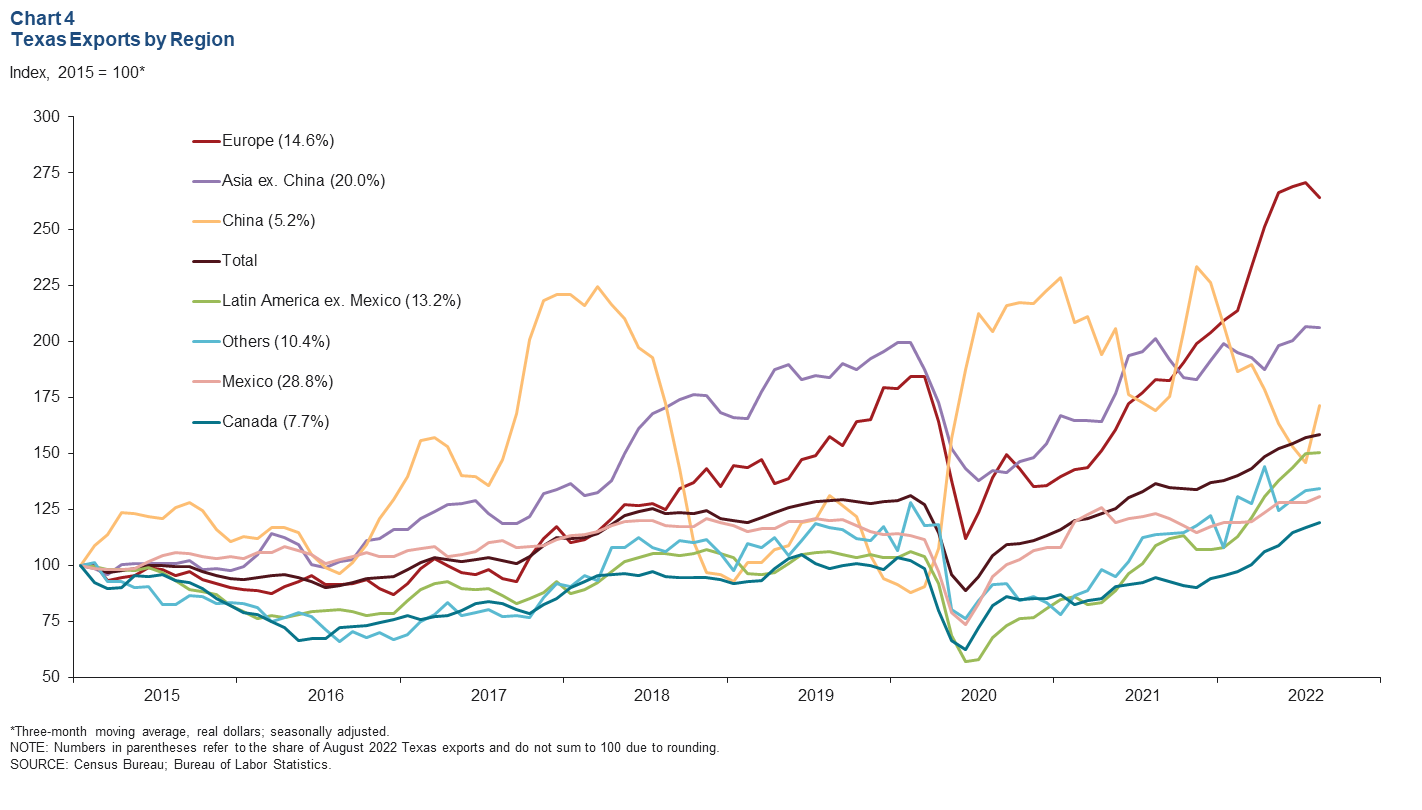
Texas exports edged up 0.7 percent in August, and the three-month moving average rose 1.0 percent. On a smoothed basis, exports to Texas’ largest trading partners were mixed (Chart 4). Exports to China surged 17.6 percent in August. Exports to Mexico (2.0 percent), Canada (1.7 percent) and Latin America (0.4 percent) showed more modest growth. Exports to Europe declined 2.5 percent, and exports to the rest of Asia were little changed. Through August, Texas exports were 18.0 percent above the same period last year.
Dining out
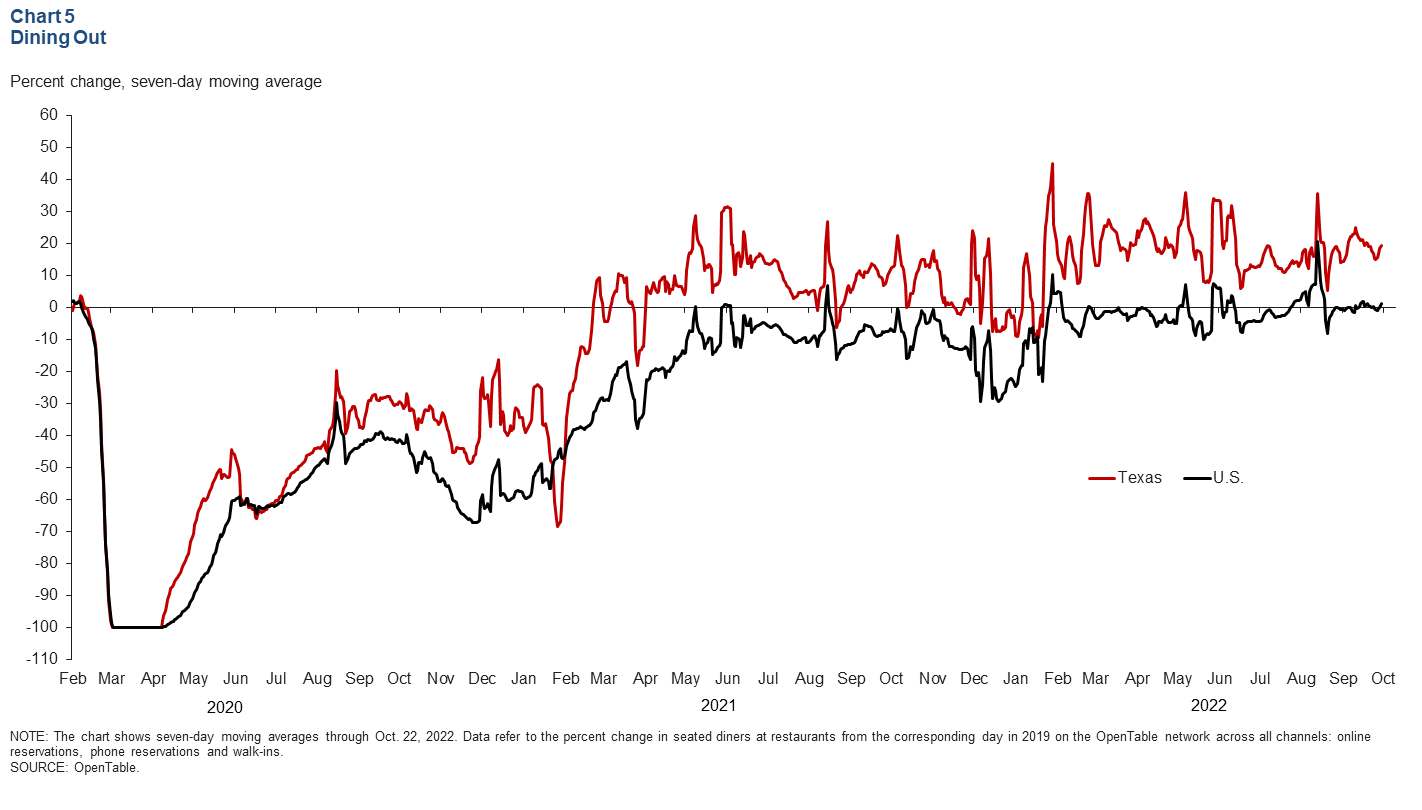
In October, the number of seated diners at restaurants across the OpenTable network remained above 2019 levels both statewide and nationwide, based on a seven-day moving average (Chart 5). The U.S. figure moderated throughout October and was 1.2 percent above 2019 levels on Oct. 22. The Texas figure was above 2019 levels for the 36th consecutive week, reaching 19.4 percent above the benchmark on Oct. 22. Austin led major Texas metros at 32.1 percent above 2019 levels. Dining out was up 17.7 percent in San Antonio and 7.2 percent in Houston. Dining-out levels in Dallas have been consistently at or below 2019 levels since Sept. 1 and are currently 3.8 percent below the benchmark.
Consumer spending
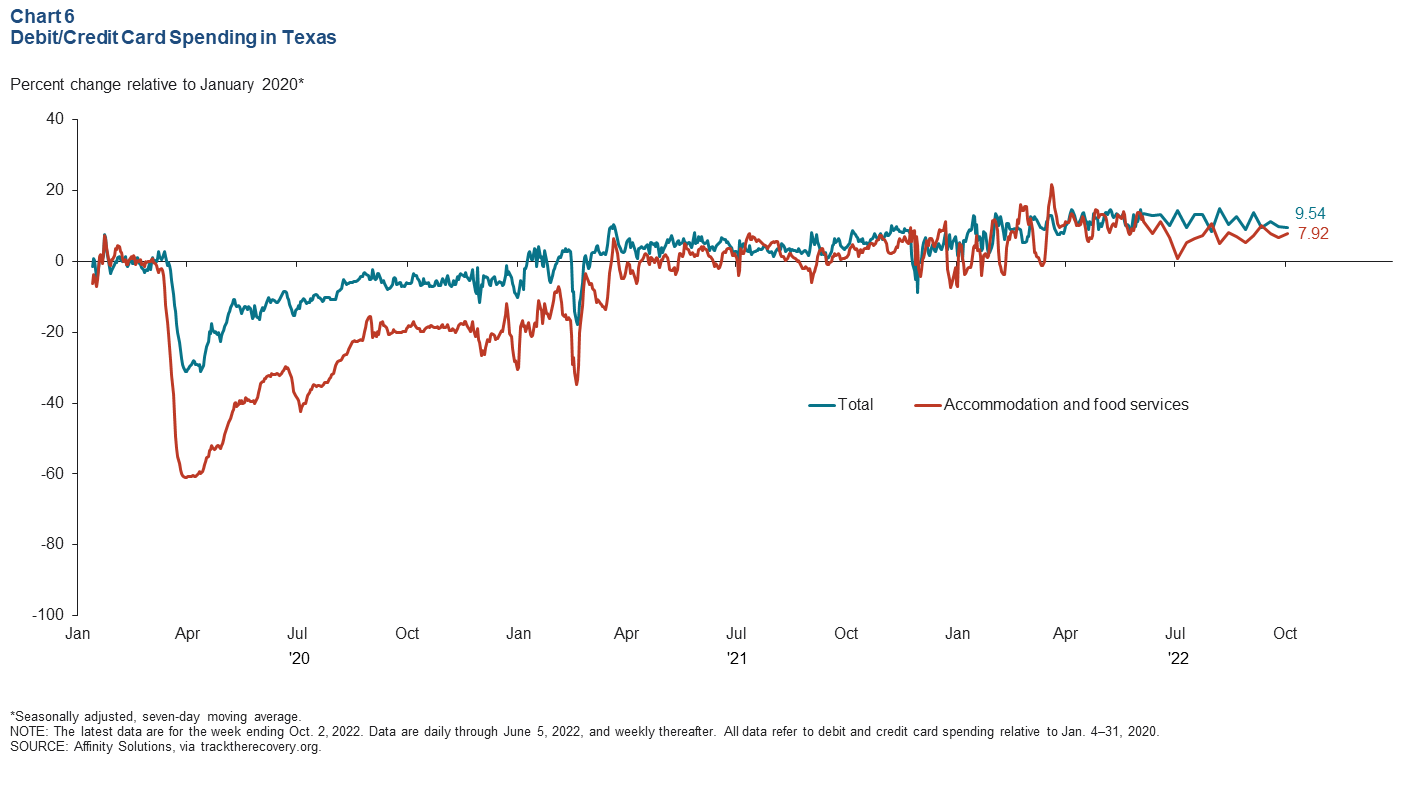
Relative to January 2020 levels, consumer spending in Texas continued to increase amid high inflation (Chart 6). As of the week ending Oct. 2, total debit and credit card spending was 9.5 percent above January 2020 levels. Accommodation and food services spending rose to 7.9 percent above January 2020 levels.
NOTE: Data may not match previously published numbers due to revisions.
About Texas Economic Indicators
Questions or suggestions can be addressed to Mytiah Caldwell at Mytiah.Caldwell@dal.frb.org. Texas Economic Indicators is published every month during the week after state and metro employment data are released.