Texas Economic Indicators

November 28, 2022
| Texas economy dashboard (October 2022) | |||
| Job growth (annualized) Aug.–Oct. '22 |
Unemployment rate |
Avg. hourly earnings |
Avg. hourly earnings growth y/y |
| 2.6% | 4.0% | $30.58 | 4.7% |
Texas economic growth eased in October. Texas payroll gains moderated and the unemployment rate remained unchanged. The Texas Manufacturing Outlook Survey headline index suggested output growth abated in November. Existing-home sales declined further in October, while housing inventories ticked up for most major metros. Overall, consumer delinquencies fell in the third quarter, though they ticked up in some categories.
Labor market
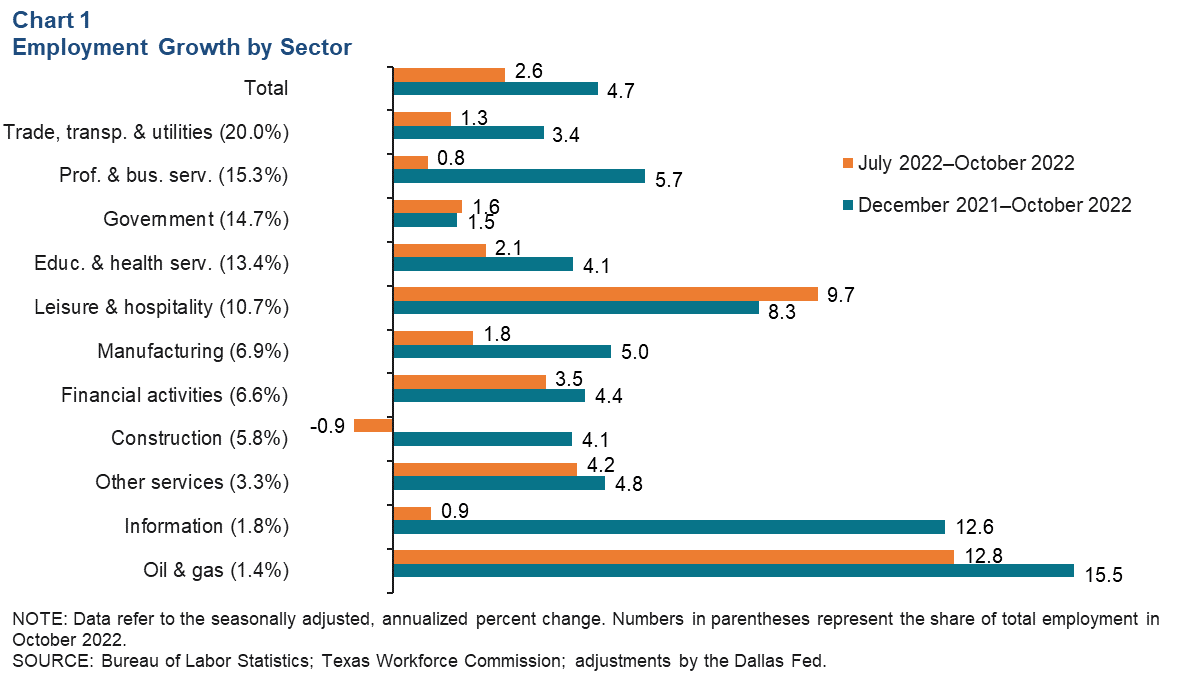
Job gains moderate
Texas employment growth was an annualized 2.9 percent in October, down from 4.8 percent in September. Over the three months through October, growth slowed to an annualized 2.6 percent (Chart 1). The slowing was generally broad based across sectors, with construction job growth slipping into negative territory during the period. Despite the downshift, Texas (4.7 percent) is still outpacing the nation (3.3 percent) in year-to-date job growth. The Dallas Fed’s Texas Employment Forecast in November estimates 4.3 percent job growth this year (December/December), down slightly from its October reading.
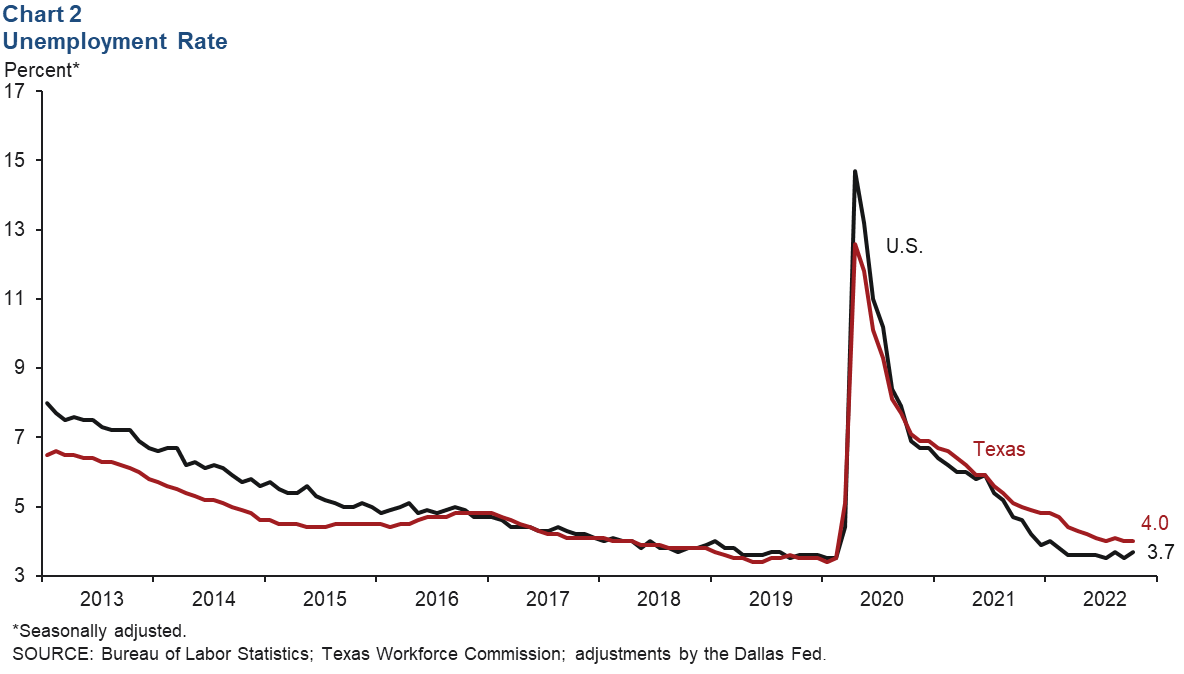
Unemployment rate flat in Texas
The Texas unemployment rate was unchanged at 4.0 percent in October, while the nation’s rate increased 0.2 percentage points to 3.7 percent (Chart 2). Texas’ labor force grew an annualized 0.7 percent (8,700 people) in October after contracting 1.0 percent in September. Meanwhile, the U.S. labor force shrank in October for the second straight month.
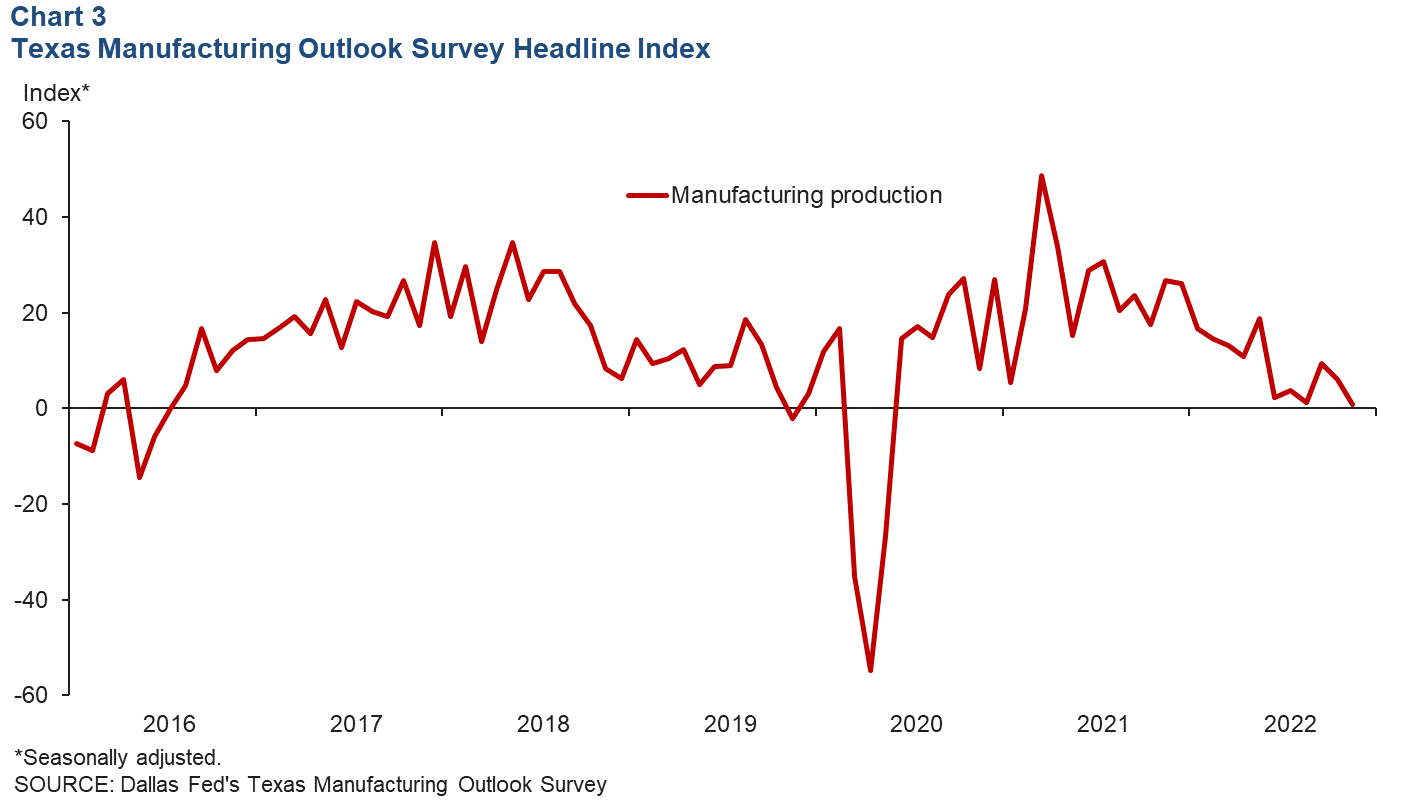
Texas Business Outlook Surveys
Manufacturing activity in the state has moderated relative to earlier in the year, according to the Texas Manufacturing Outlook Survey (Chart 3). The manufacturing production index fell to near zero, indicating no growth in output in November, and the new orders index continued to decline for the sixth straight month. The company outlook index for the manufacturing sector remained negative for the ninth consecutive month.
Housing
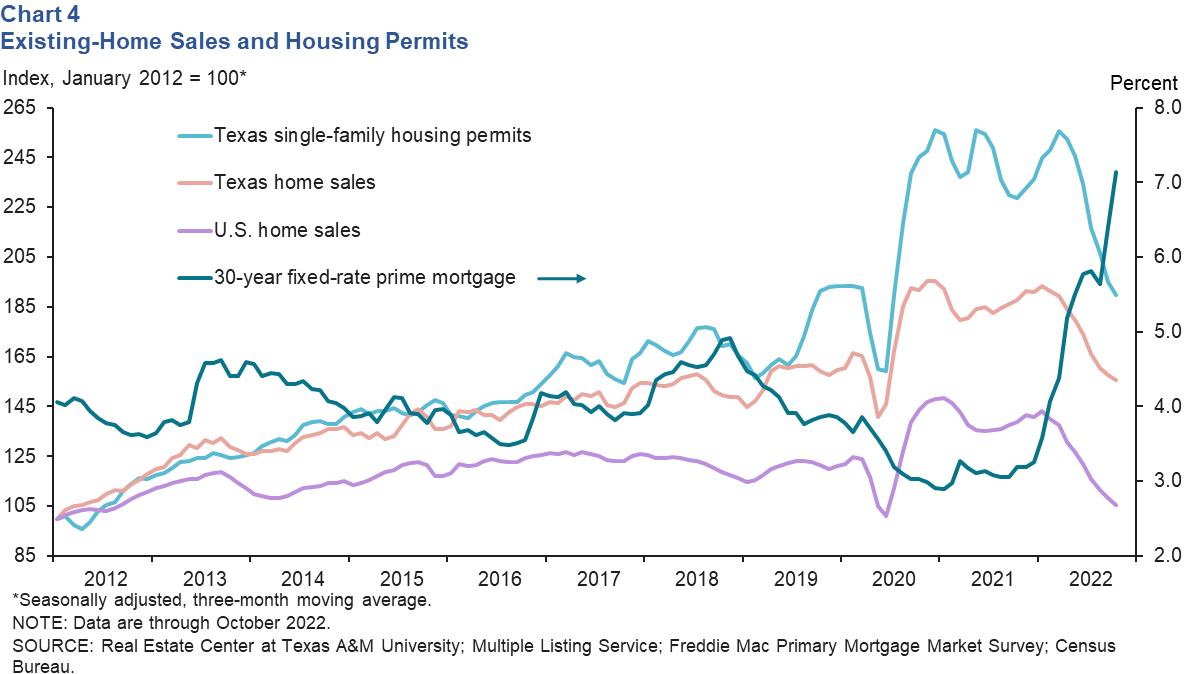
Existing-home sales and permits continue to fall
Texas existing-home sales fell 5.2 percent in October, the second straight month of decline (Chart 4). U.S. home sales slipped 5.9 percent in October following a 1.5 percent decline the month prior. Mortgage rates remained high, reaching 7.1 percent in October, and pressured sales as some buyers were priced out of the market. Declining sales are impacting single-family housing permits, which fell 6.4 percent in October.
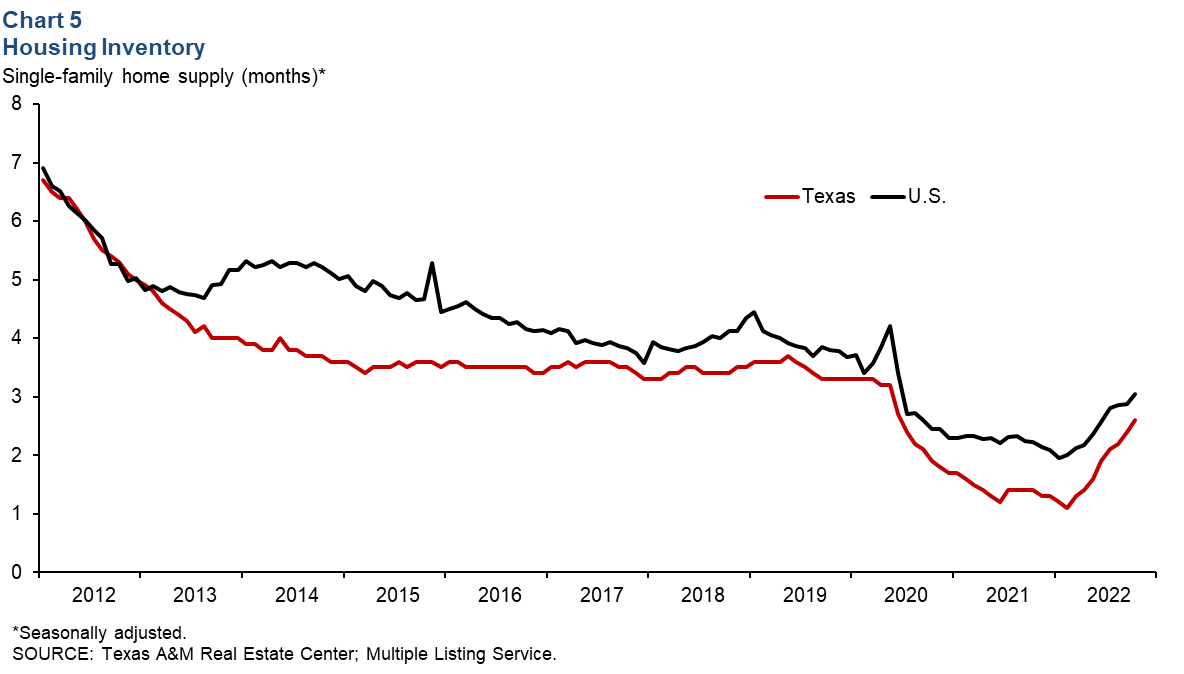
Housing inventories rise
In October, the existing-home supply continued its upward trend, with inventories rising in both the U.S and Texas (Chart 5). However, inventories remained well below the six months considered a balanced market. Texas’ housing supply was 2.6 months, compared with the nation’s 3.1 months. Most major Texas metros also saw an increase in housing supply, though in the Dallas area, it fell from 1.9 to 1.7 months. Housing supply reached 2.6 months in San Antonio, 2.4 in Austin and 2.1 in Fort Worth.
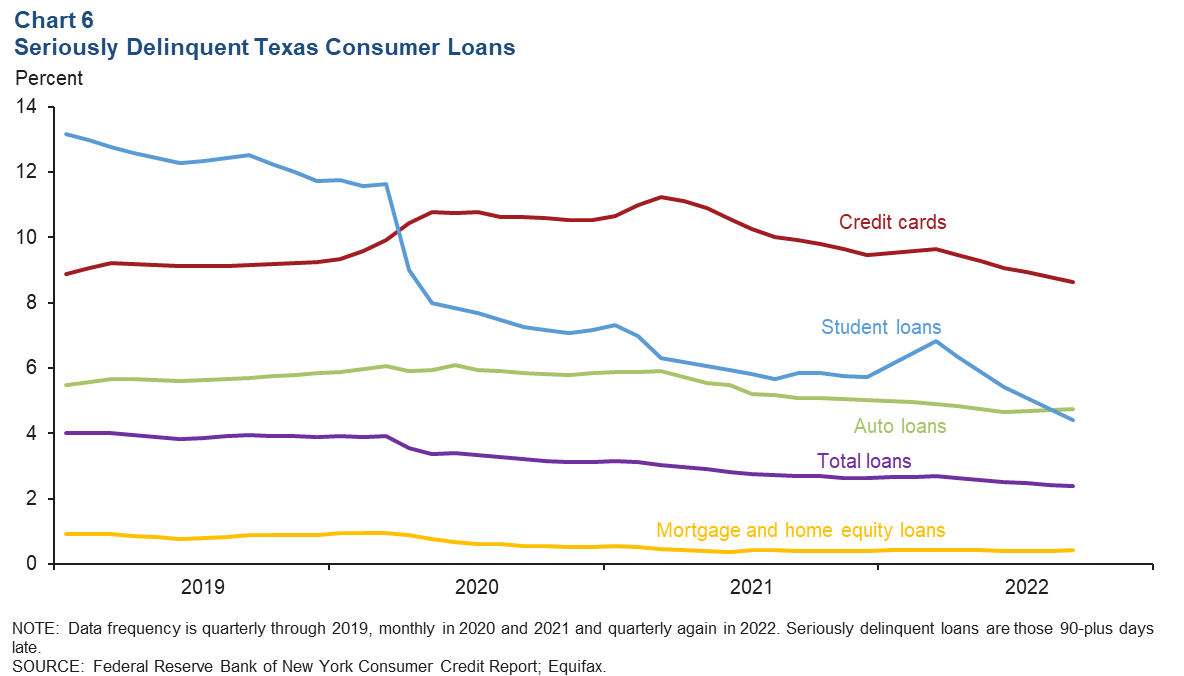
Delinquencies
Overall serious delinquency rates for consumer loans in Texas fell slightly in third quarter 2022 (Chart 6). Delinquency rates for credit card loans decreased 0.4 percentage points from the second quarter to 8.6 percent. Student loan delinquencies remained below prepandemic levels (February 2020) at 4.4 percent amid the government forbearance period. Delinquencies for auto loans ticked up to 4.7 percent but were relatively flat for mortgage and home-equity loans.
NOTE: Data may not match previously published numbers due to revisions.
About Texas Economic Indicators
Questions or suggestions can be addressed to Mytiah Caldwell at Mytiah.Caldwell@dal.frb.org. Texas Economic Indicators is published every month during the week after state and metro employment data are released.