Texas Economic Indicators

December 22, 2022
| Texas Economy Dashboard (November 2022) | |||
| Job growth (annualized) Aug.–Nov. '22 |
Unemployment rate |
Avg. hourly earnings |
Avg. hourly earnings growth y/y |
| 4.0% | 4.0% | $30.25 | 3.7% |
Texas’ economy continued to expand in November. Payroll gains were mostly broad based, and unemployment was unchanged. Average hourly wages dipped but remained above year-ago levels. Price indexes in the Dallas Fed’s Texas Business Outlook Surveys pointed to slower price growth both in manufacturing and services. Texas exports fell in October, while total consumer spending increased during the first week of December.
Labor market
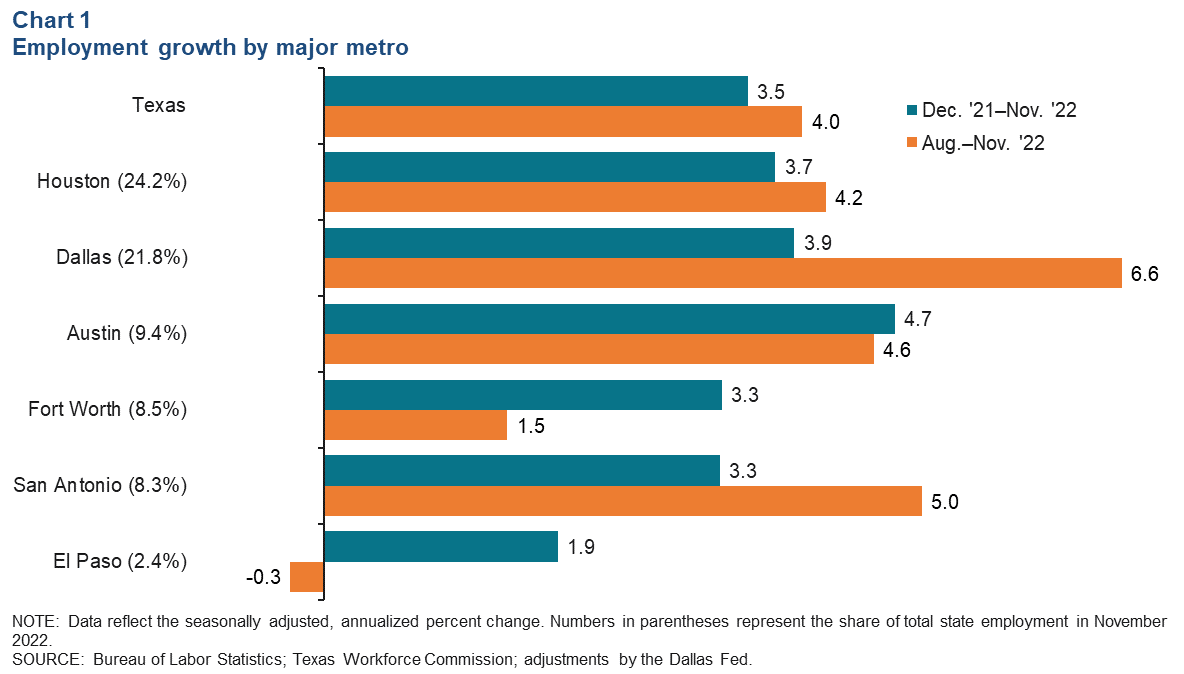
Job gains solid in most major metros
Texas employment expanded an annualized 3.7 percent in November after growing an upwardly revised 3.4 percent in October. Employment gains were generally broad based across major Texas metros in the three months ending in November, led by Dallas (Chart 1). Employment in El Paso dipped during the period. Texas payroll employment numbers for the second quarter 2022 were revised down in the Dallas Fed’s quarterly benchmark revision process. With those revisions to the job estimates, state employment expanded an annualized 3.5 percent through November, adding 421,000 jobs. The Dallas Fed’s Texas Employment Forecast is now for 3.5 percent growth this year (December/December), down from its 4.3 percent estimate in October, prior to the benchmark.
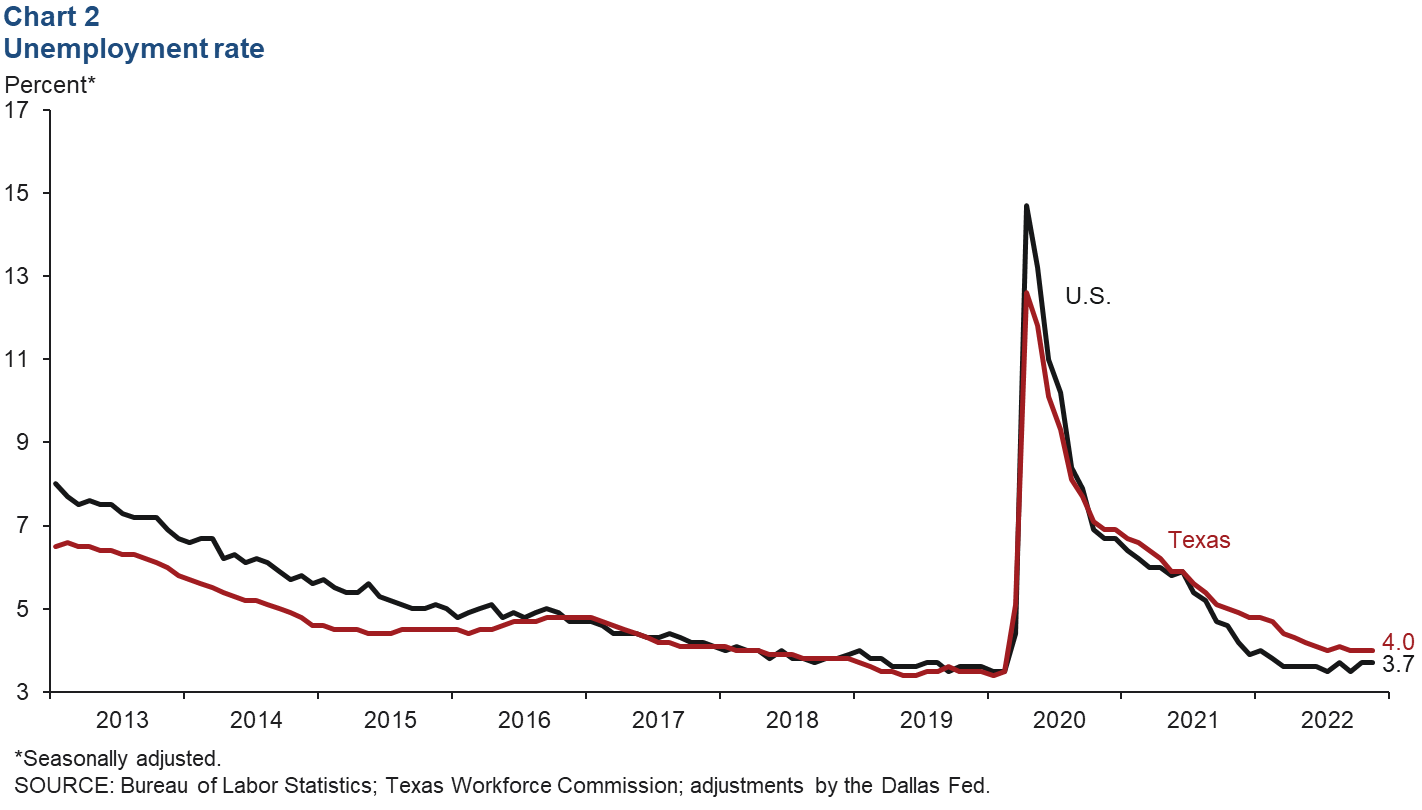
Unemployment remains unchanged
The Texas unemployment rate was 4.0 percent in November for a third straight month, while the nation’s rate remained at 3.7 percent for a second month in a row (Chart 2). Texas’ labor force growth continued in November, rising an annualized 0.2 percent (2,300 people). Meanwhile, the U.S. labor force declined for a third month in a row.
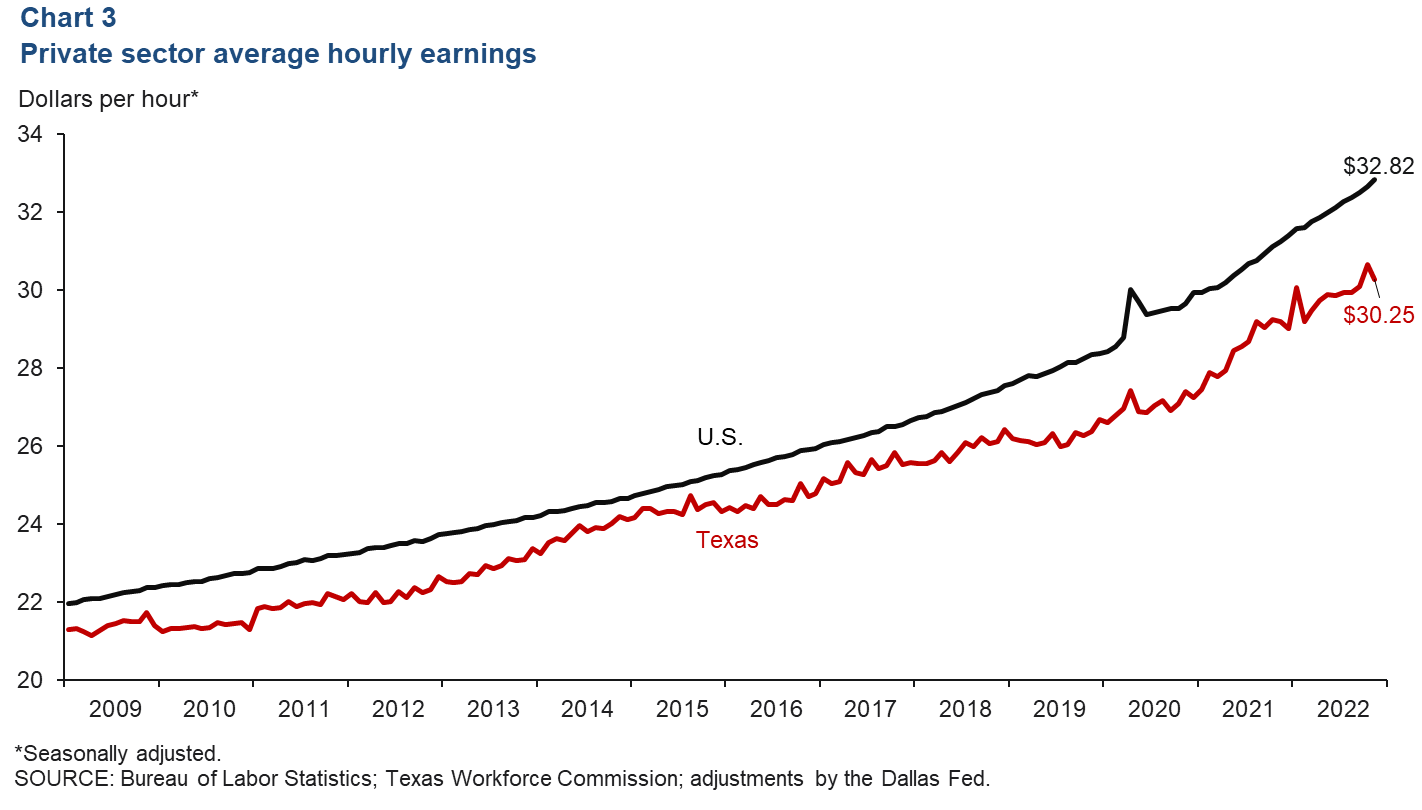
Wages fall in November
Private sector average hourly earnings fell in Texas in November, but they increased 6.8 percent nationwide. Texas’ earnings slipped from $30.64 to $30.25, remaining below the U.S. average of $32.82 (Chart 3). Despite the decline, Texas’ private sector hourly wages were up 3.7 percent over the 12-month period ending in November, compared with 5.1 percent nationwide.
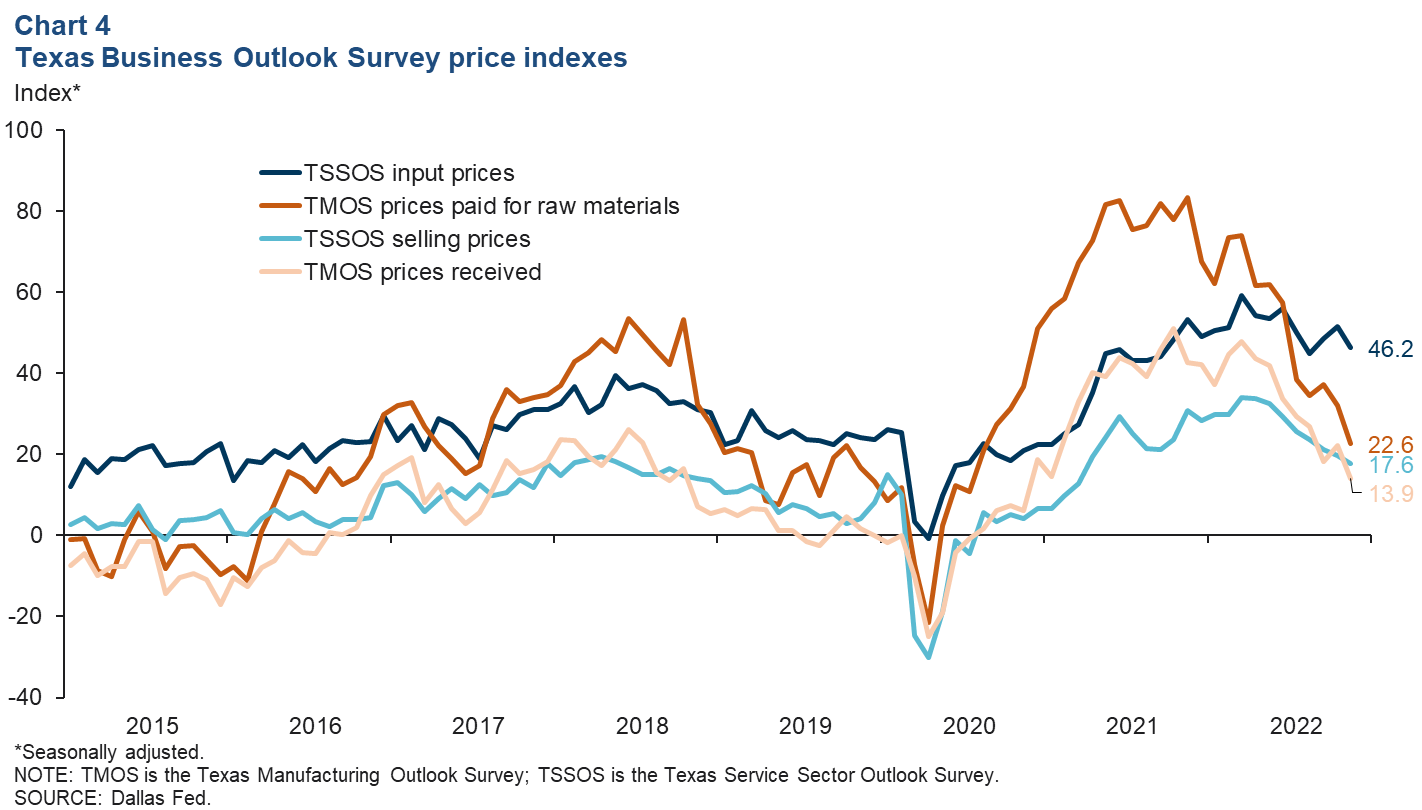
Texas Business Outlook Surveys
The Texas Business Outlook Surveys’ price indexes dipped but remained positive in November, indicating a slower pace of input and selling price growth (Chart 4). The service sector input prices index fell 5.2 points to 46.2, and the service sector selling price index dipped 2.1 points to 17.6. However, both remained above their series averages, suggesting an elevated pace of growth. The manufacturing survey’s index of raw materials prices fell to 22.6, its lowest level since August 2020 and below the series average. The prices received index dropped to 13.9, remaining above its series average. Texas business executives’ expectations for prices six months ahead in the manufacturing and service sectors were positive but the future price indexes dipped from their October readings.
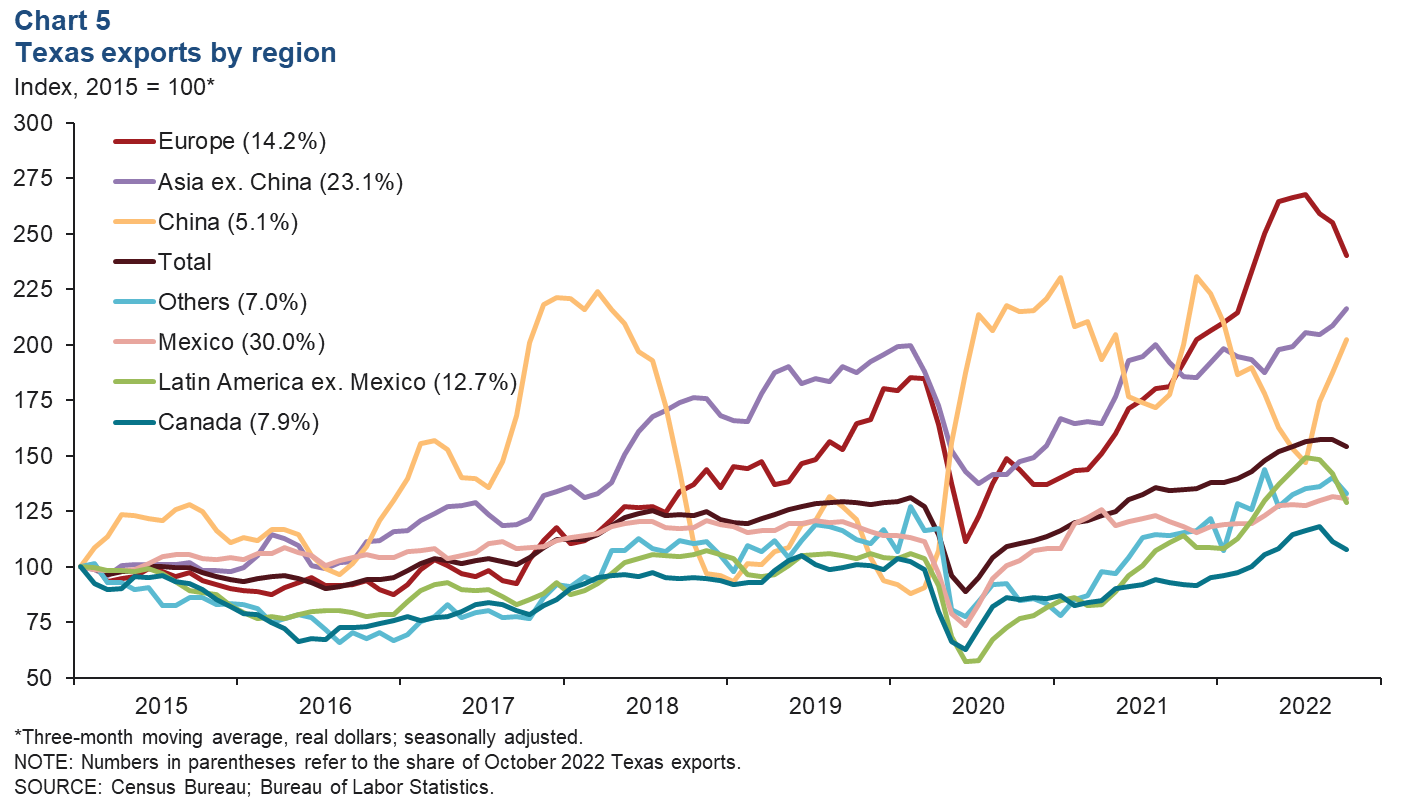
Exports
Texas exports declined 4.5 percent in October, and the three-month moving average fell 1.9 percent. On a smoothed (three-month average) basis, exports to some of Texas’ largest trading partners declined (Chart 5). Exports to Latin America excluding Mexico fell 9.3 percent in October, followed by Europe (-6.0 percent), Canada (-3.2 percent) and Mexico (-0.6 percent). China and the rest of Asia were among areas that saw increases, with Texas exports rising 8.1 percent and 3.8 percent, respectively. Through October, Texas exports were 17.1 percent above the same period last year.
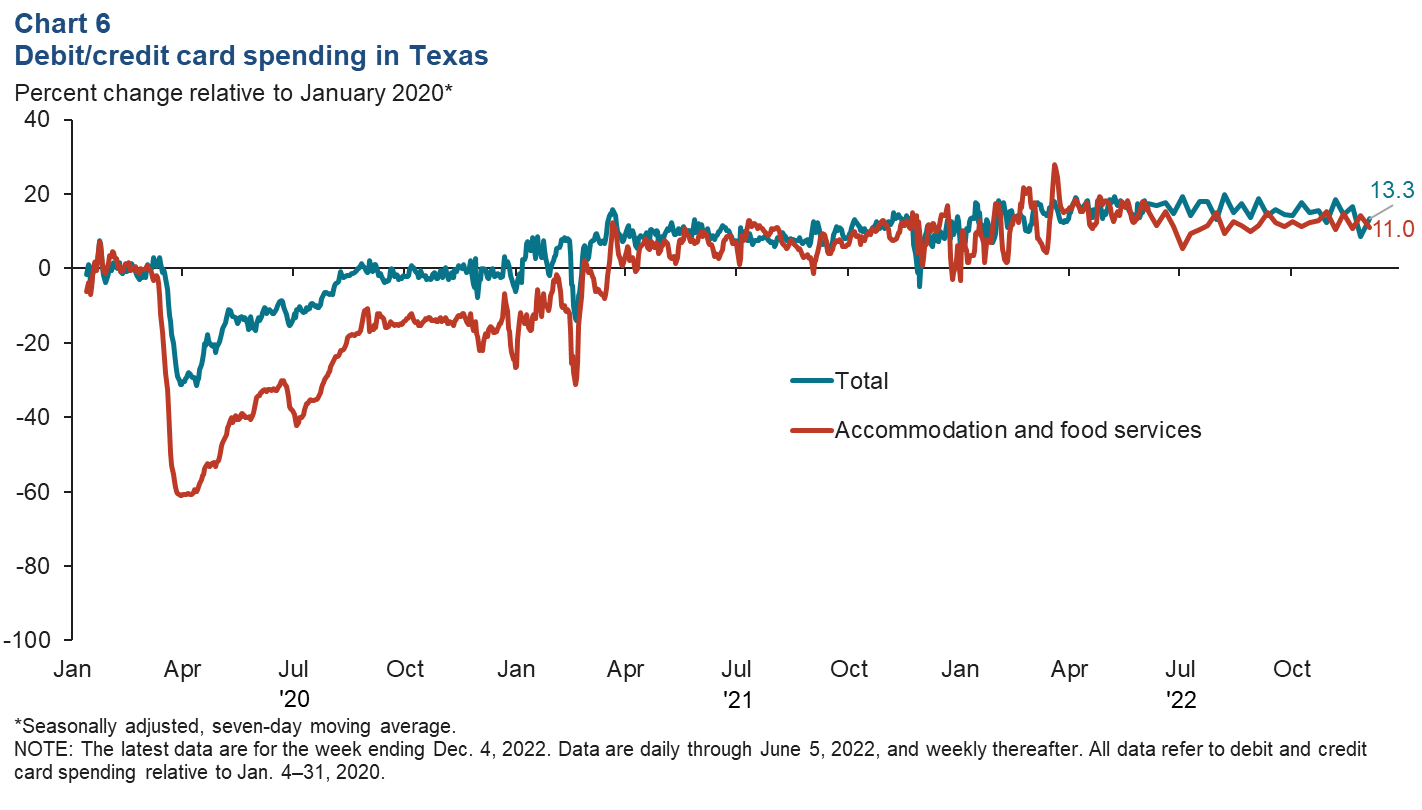
Consumer spending
Total consumer spending in Texas grew in November and early December. As of the week ending Dec. 4, total debit and credit card spending was 13.3 percent above pre-COVID-19 levels in January 2020. Accommodation and food services spending also remained strong at 11.0 percent above January 2020 levels (Chart 6).
NOTE: Data may not match previously published numbers due to revisions.
About Texas Economic Indicators
Questions or suggestions can be addressed to Mytiah Caldwell at Mytiah.Caldwell@dal.frb.org. Texas Economic Indicators is published every month during the week after state and metro employment data are released.