Texas Economic Indicators

March 17, 2023
| Texas economy dashboard (January 2023) | |||
| Job growth (annualized) Oct. '22–Jan. '23 |
Unemployment rate |
Avg. hourly earnings |
Avg. hourly earnings growth y/y |
| 3.7% | 3.9% | $31.14 | 4.0% |
Texas’ economy continues to expand in 2023. Employment gains were broad based in January, with growth in oil and gas outperforming all other major sectors. Existing-home sales and median home prices increased in January. However, the February Texas Business Outlook Surveys (TBOS) indicated continued pessimism among respondents. Texas retail sales fell in February.
Labor Market
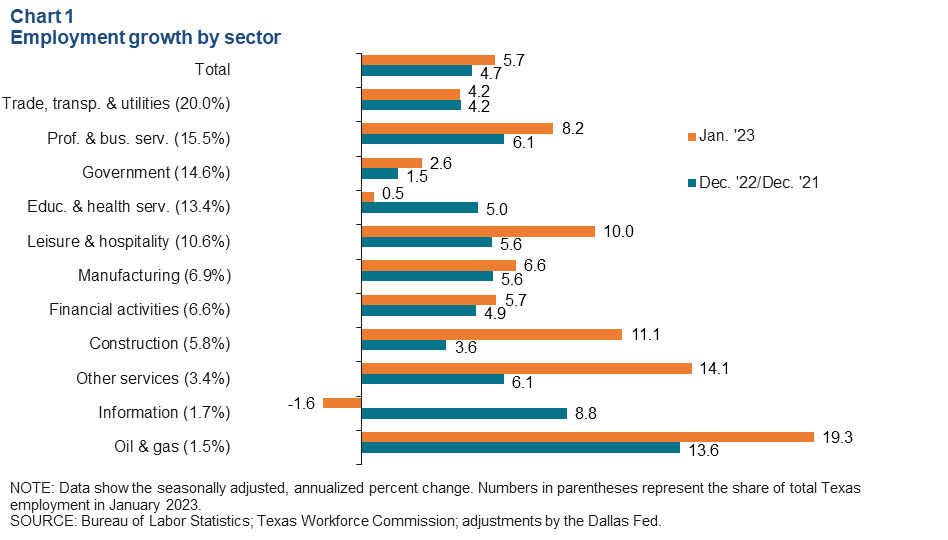
Texas employment gains strong in several sectors
Texas employment expanded an annualized 5.7 percent (63,000 jobs) in January, up from a downwardly revised 2.9 percent in December (Chart 1). January employment growth was robust in several major sectors. Oil and gas posted the strongest growth, rising 19.3 percent (2,900 jobs) and accounting for 4.6 percent of January’s total job gains. Education and health services posted the slowest growth at 0.5 percent (800 jobs), while information employment contracted 1.6 percent (300 jobs). In 2022, Texas payrolls expanded 4.7 percent. The state unemployment rate ticked up to 3.9 percent in January.
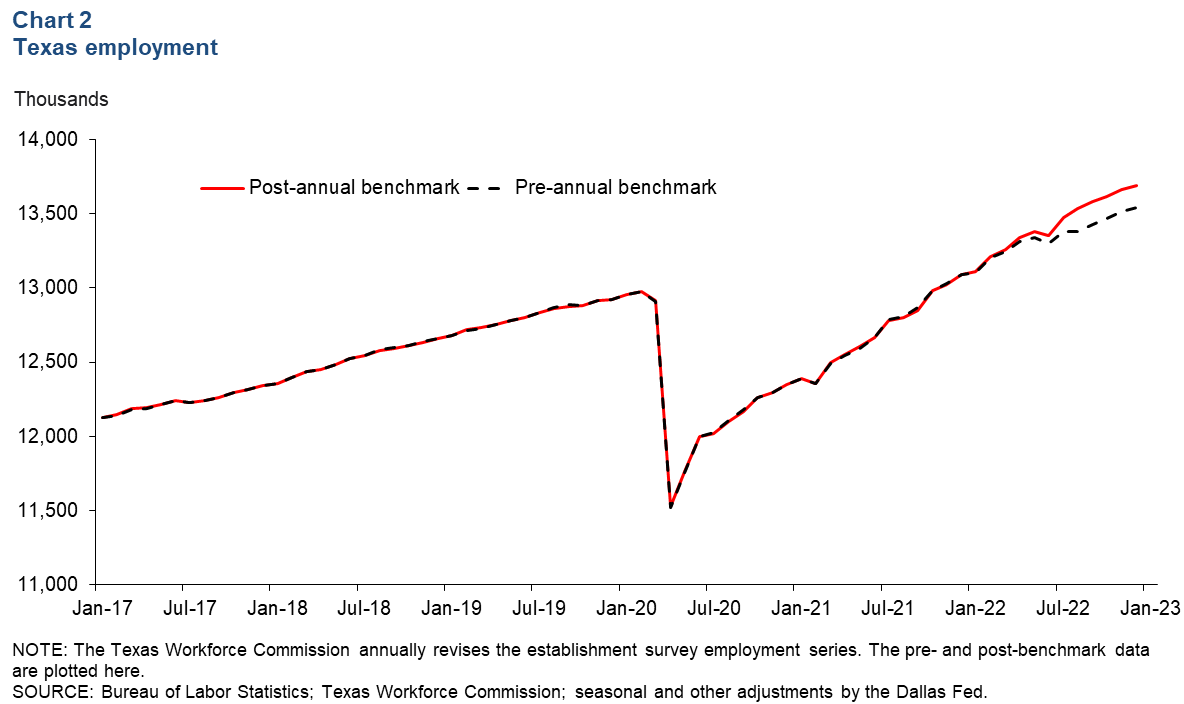
2022 employment revised up with benchmark
Texas employment data were recently revised during the Texas Workforce Commission's (TWC's) annual benchmark process (Chart 2). Once a year, the TWC uses the Quarterly Census of Employment and Wages, which covers over 95 percent of jobs, to update the monthly Current Employment Statistics with more complete data. With these benchmark revisions, Texas payrolls increased 4.7 percent in 2022, up from the Dallas Fed's previous estimate of 3.5 percent. The Dallas Fed’s latest Texas Employment Forecast suggests 2.8 percent job growth in 2023 (December/December), up from its February forecast of 1.4 percent.
Texas Business Outlook Surveys
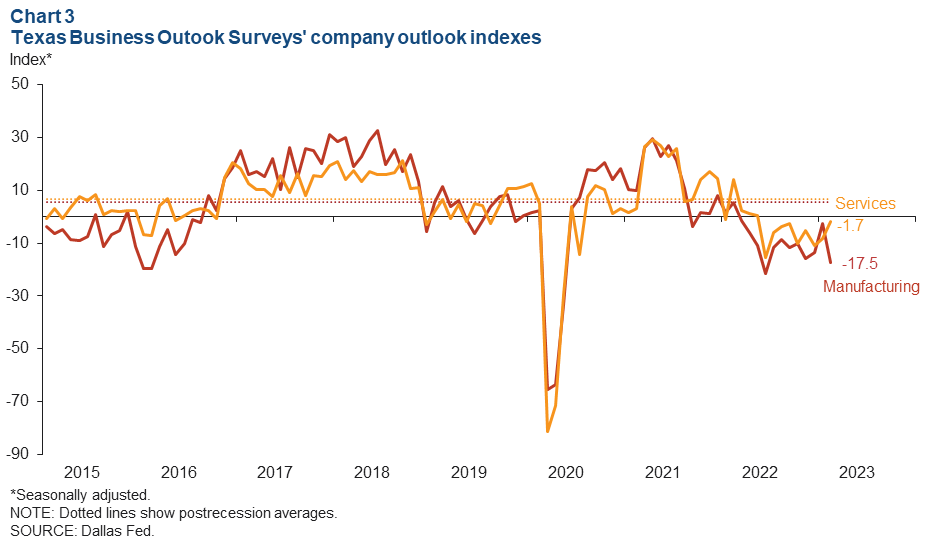
Texas Business Outlook Surveys in February continued to suggest pessimism (Chart 3). In the service sector, the company outlook index rose 6.6 points but stayed negative at -1.7, while the outlook uncertainty index fell 7.1 points but remained positive at 12.9. In the manufacturing sector, the company outlook index remained negative for the 12th consecutive month and plummeted 15 points to -17.5. Furthermore, the manufacturing uncertainty index increased 8.2 points to 25.0.
Housing
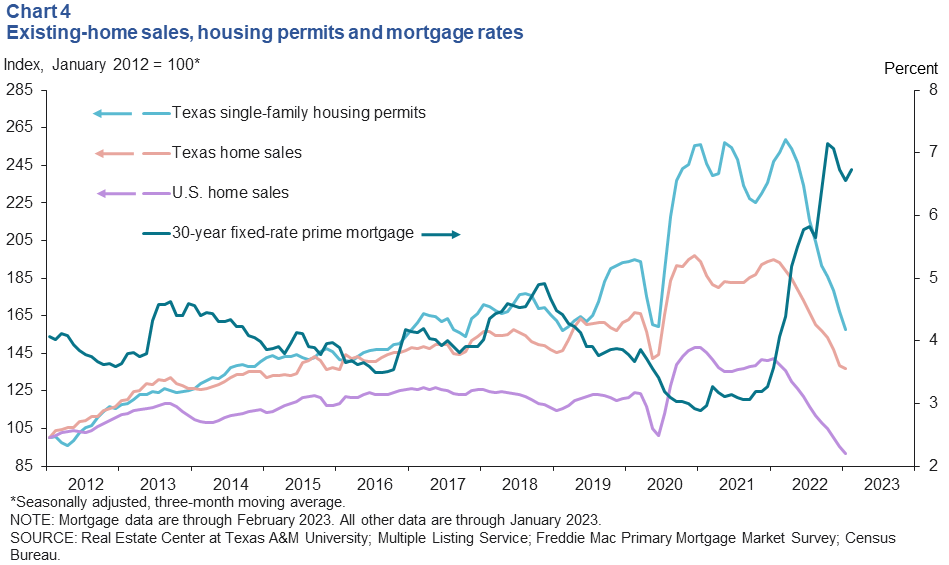
Existing-home sales rise, while permits fall further
Texas existing-home sales increased strongly in January following 10 consecutive months of declines (Chart 4). U.S. home sales fell for a 12th consecutive month, down 0.7 percent in January. High mortgage rates—averaging 6.7 percent in February—have impacted housing affordability and priced many buyers out of the market. Texas single-family housing permits fell 4.4 percent in January—their seventh straight month of decline.
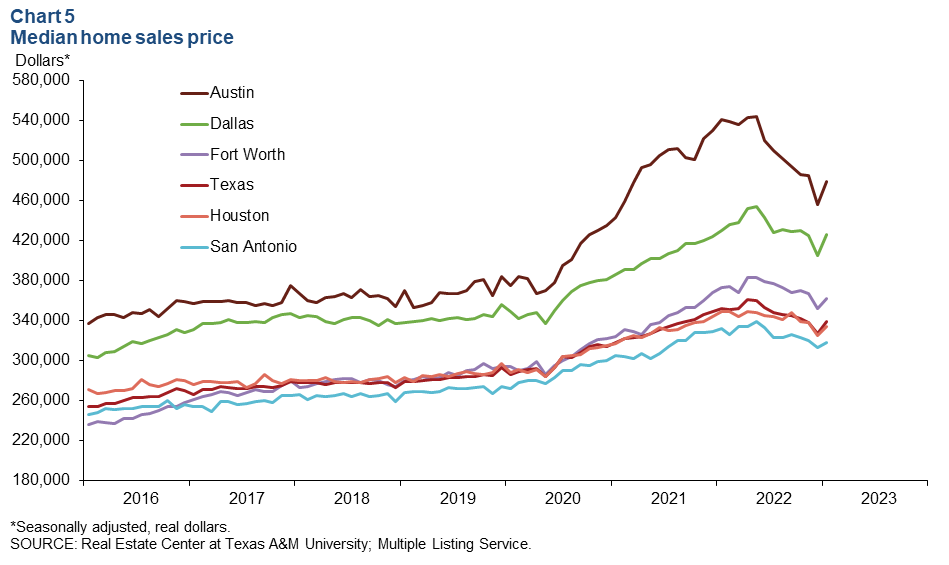
Home prices tick up
With a pickup in sales, the median sales price in Texas rose in January to $338,761—a 3.6 percent increase from December (Chart 5). Among the major Texas metros, Dallas posted the largest increase, with the median price climbing 5.3 percent to $426,249. Statewide median home prices (nominal) were 2.3 percent above year-ago levels.
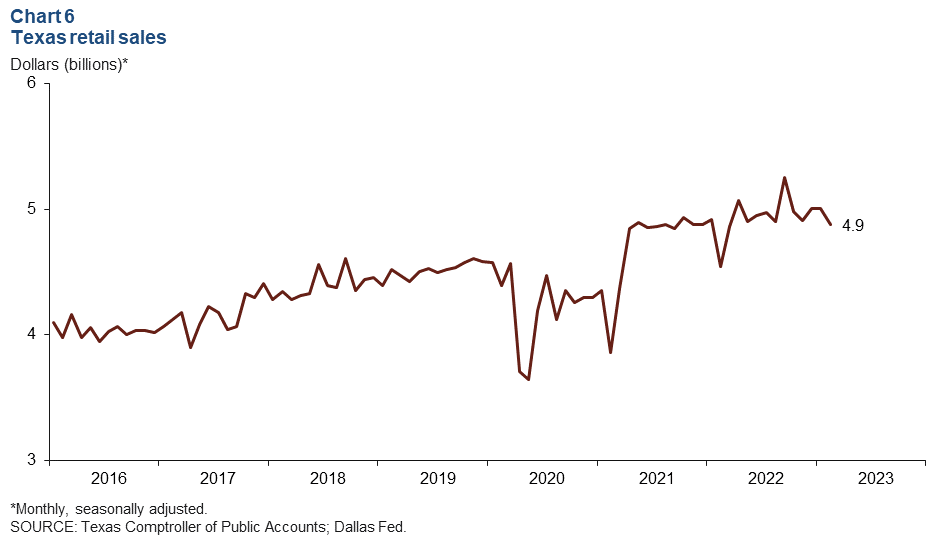
Retail sales
Texas retail sales fell in February to $4.9 billion following two months of gains (Chart 6). Statewide retail spending is 7.1 percent below its peak of $5.2 billion in September 2022 but up 7.3 percent from February 2022 levels.
NOTE: Data may not match previously published numbers due to revisions.
About Texas Economic Indicators
Questions or suggestions can be addressed to Mytiah Caldwell at Mytiah.Caldwell@dal.frb.org. Texas Economic Indicators is published every month during the week after state and metro employment data are released.