Texas Economic Indicators
March 30, 2023
| Texas economy dashboard (January 2023) | |||
| Job growth (annualized) Nov. '22–Feb. '23 |
Unemployment rate |
Avg. hourly earnings |
Avg. hourly earnings growth y/y |
| 4.3% | 4.0% | $30.97 | 6.2% |
Texas’ economy continued to expand in February. Payroll increases were mixed across sectors, and job openings remained elevated in March. Private hourly earnings fell. The Dallas Fed’s Texas Business Outlook Surveys in March indicated a slower pace of price growth for both manufacturing and services. Exports continued to fall in January. The Dallas Fed’s Banking Conditions Survey reported a broad decline in loan volumes in February.
Labor Market
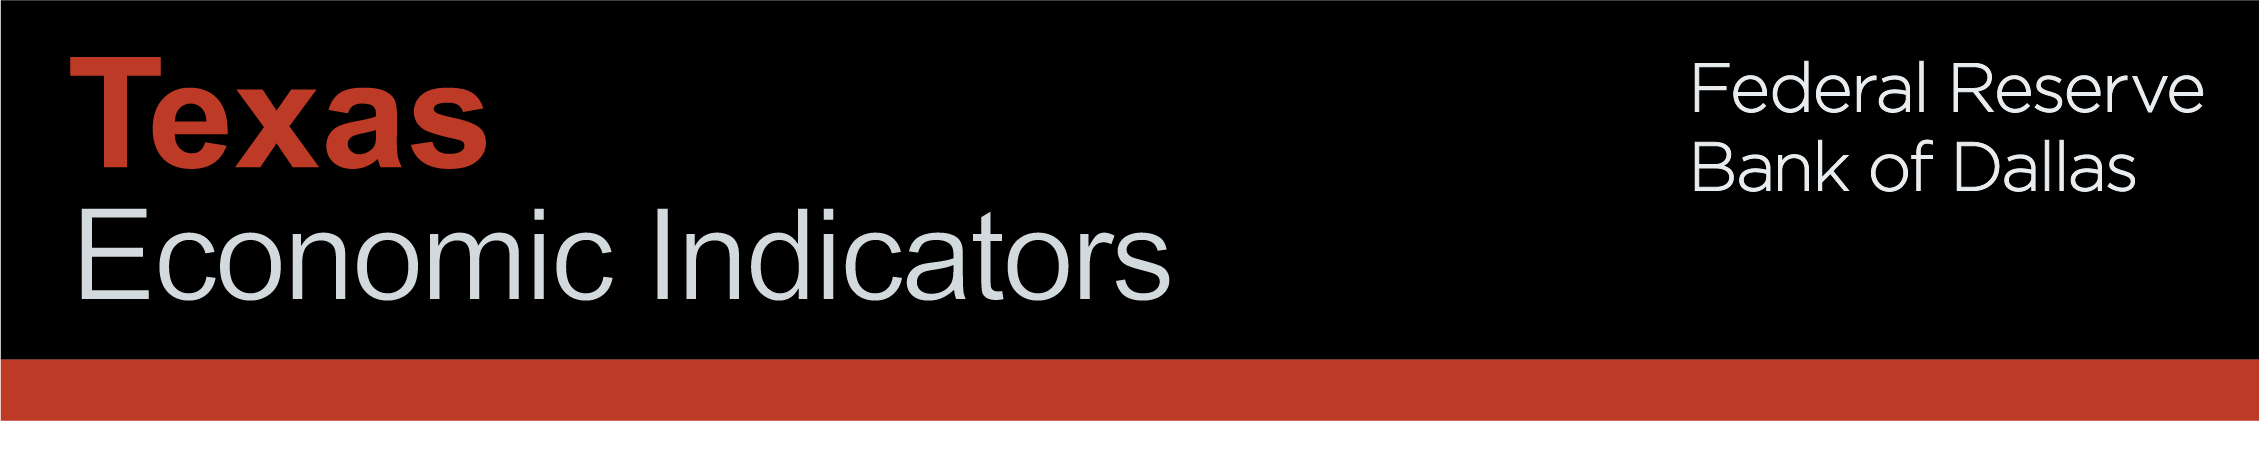
Texas outperforms U.S. in job creation so far in 2023
Texas employment growth was an annualized 4.6 percent in February, slower than 5.5 percent in January. In the first two months this year, Texas’ job growth of 5.1 percent (annualized) outpaced the nation’s 3.2 percent increase (Chart 1). Employment gains were seen in most sectors, with leisure and hospitality leading at 9.5 percent (22,000 jobs). Professional and business services and construction were neck and neck in job growth at 8.5 percent and 8.4 percent, respectively. The only sector posting losses was manufacturing, which contracted 0.5 percent. The Dallas Fed’s Texas Employment Forecast released on March 24 estimated 2.8 percent job growth this year (December/December), unchanged from its previous estimate.
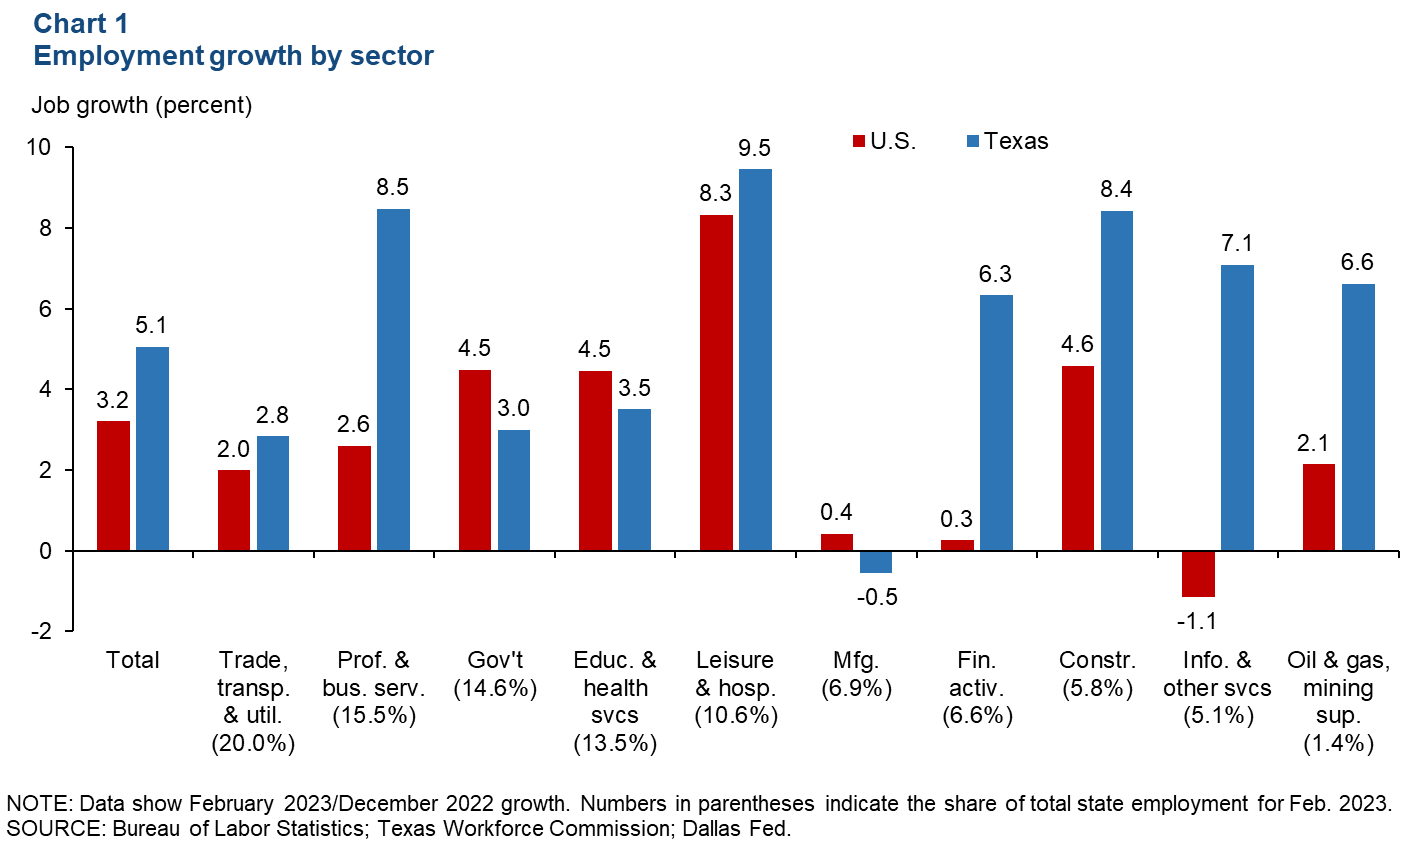
Job openings fall but remain elevated
Job openings in Texas and the U.S. remained elevated through mid-March, though both have been decreasing in recent months (Chart 2). As of March 24, Texas and U.S. job openings were down 2.5 and 2.7 percent, respectively, from the week ending March 17—39.2 percent and 35.4 percent higher than February 2020 levels.
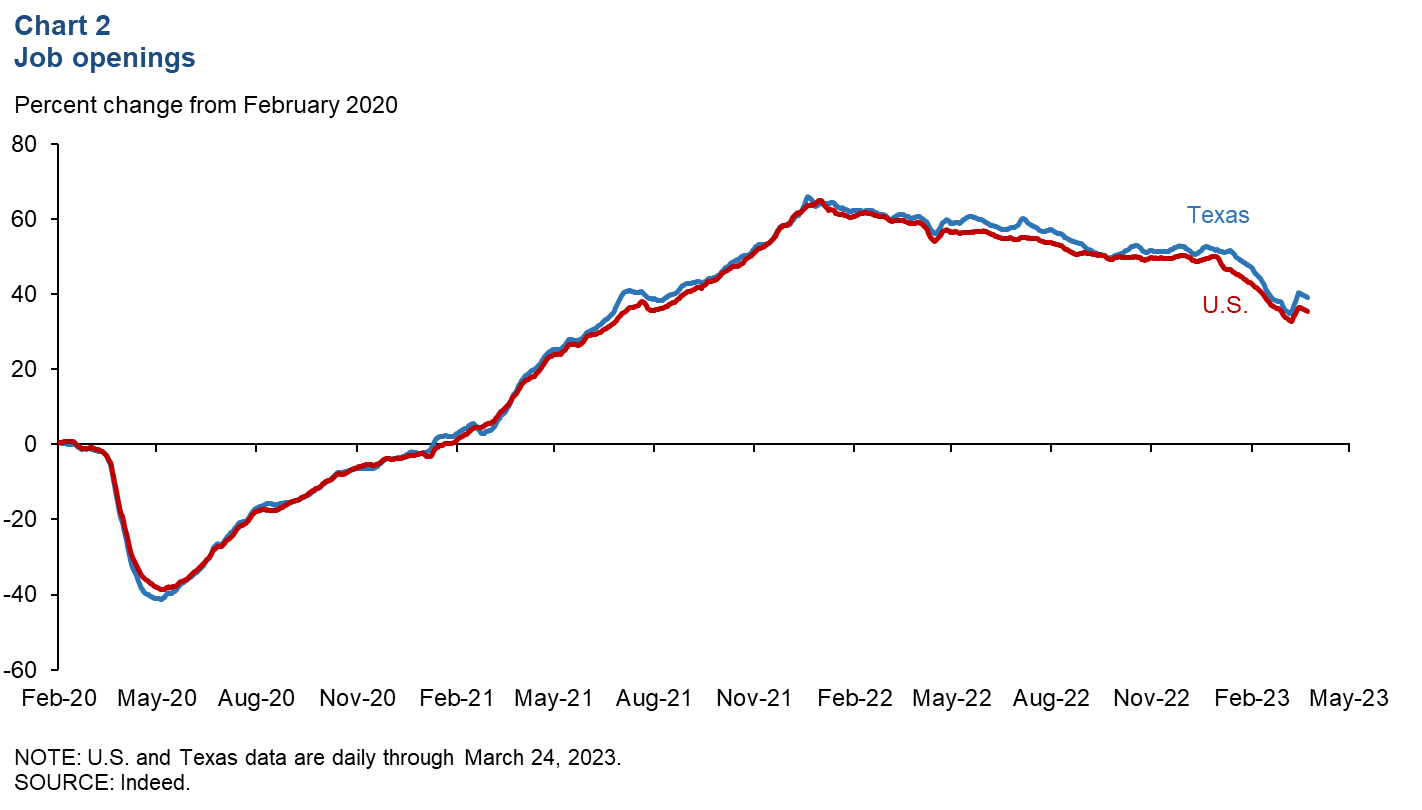
Private earnings decrease
Texas private hourly earnings fell in February to $30.97 (Chart 3). Meanwhile, private hourly earnings in the U.S. rose an annualized 2.9 percent to $33.09. Year over year, Texas’ wages were up 6.2 percent, outpacing the nation’s 4.6 percent increase.
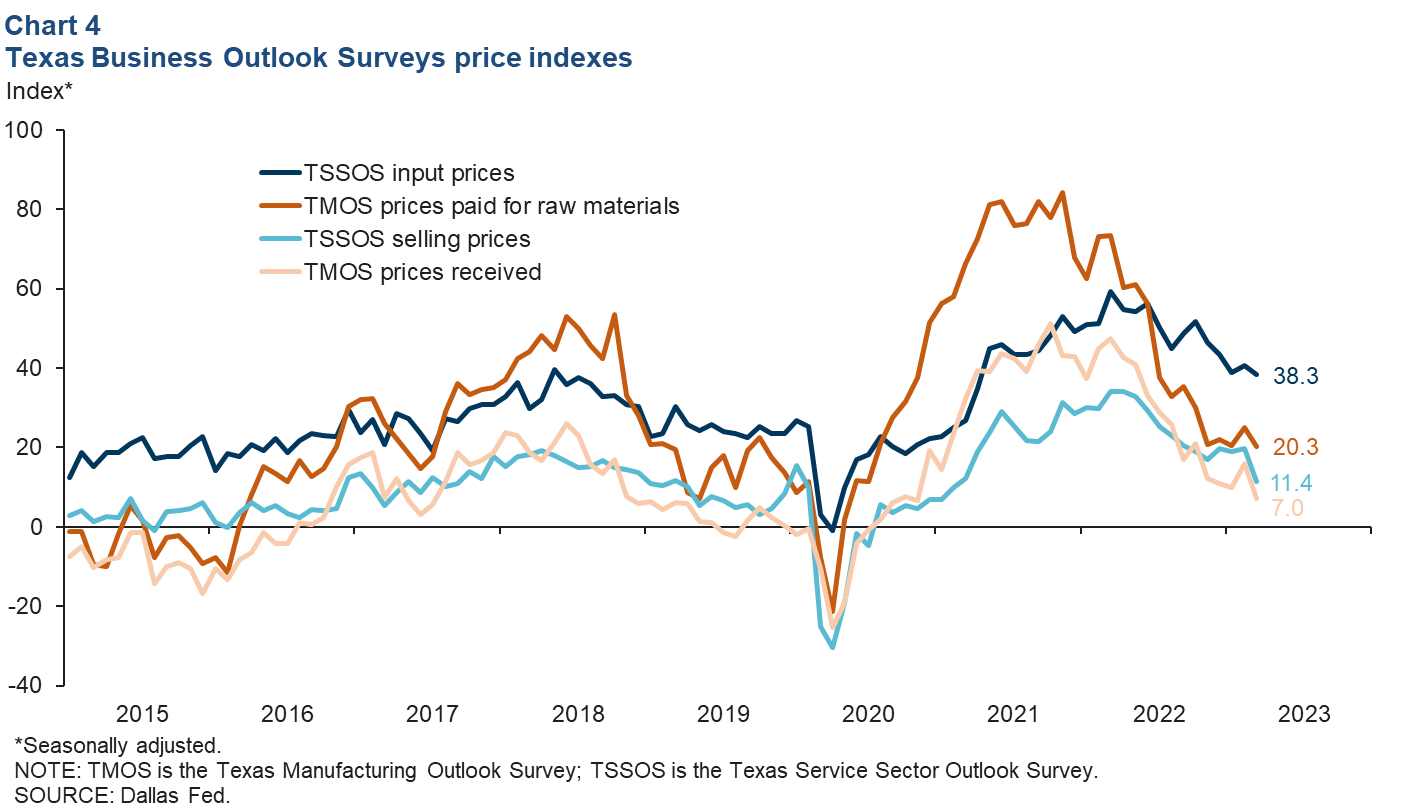
Texas Business Outlook Surveys
The Texas Business Outlook Surveys’ price indexes were positive but decreased in March, indicating slower growth in input and selling prices (Chart 4). The manufacturing survey’s prices paid for raw materials and the prices received indexes fell to 20.3 and 7.0, respectively. The service sector input prices index dropped to 38.3, and the service sector selling prices index fell to 11.4.
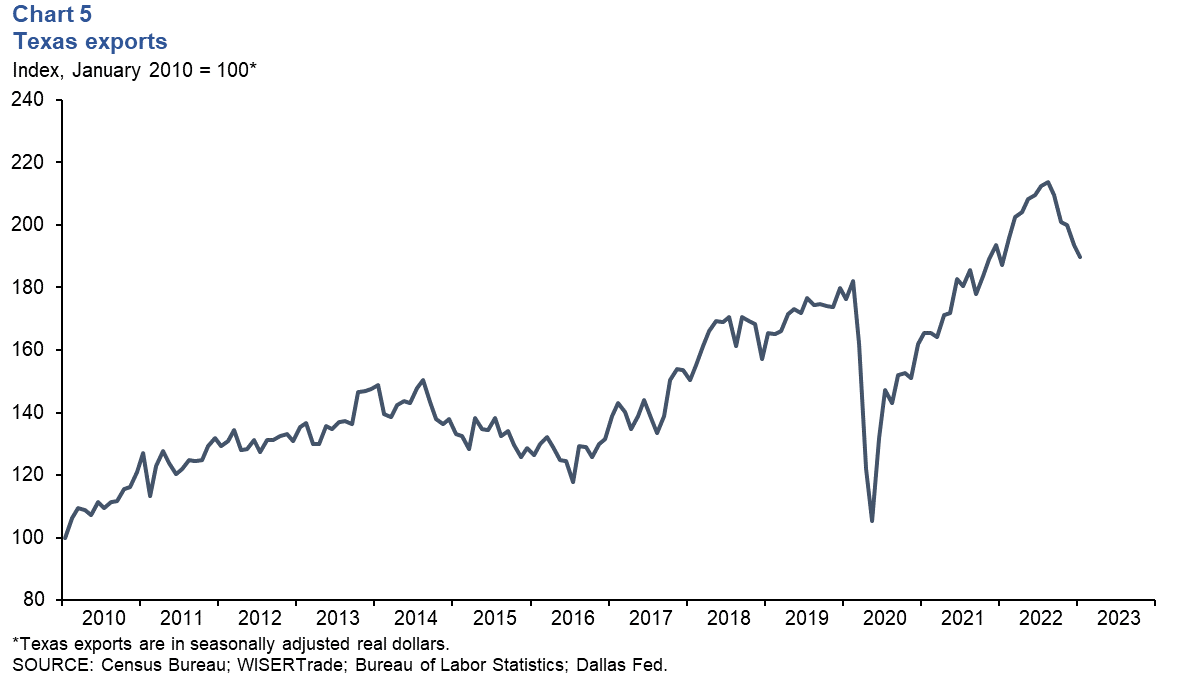
Exports
Texas exports fell for the fifth consecutive month in January (Chart 5). Exports were down 1.8 percent in Texas but increased 2.0 percent in the U.S. Exports to some of Texas’ largest trading partners increased: China (23.7 percent), Mexico (3.5 percent), Latin America excluding Mexico (1.1 percent), Europe (0.6 percent) and Australia (0.3 percent). Exports to the United Kingdom and Asia excluding China declined 40.8 percent and 3.5 percent, respectively.
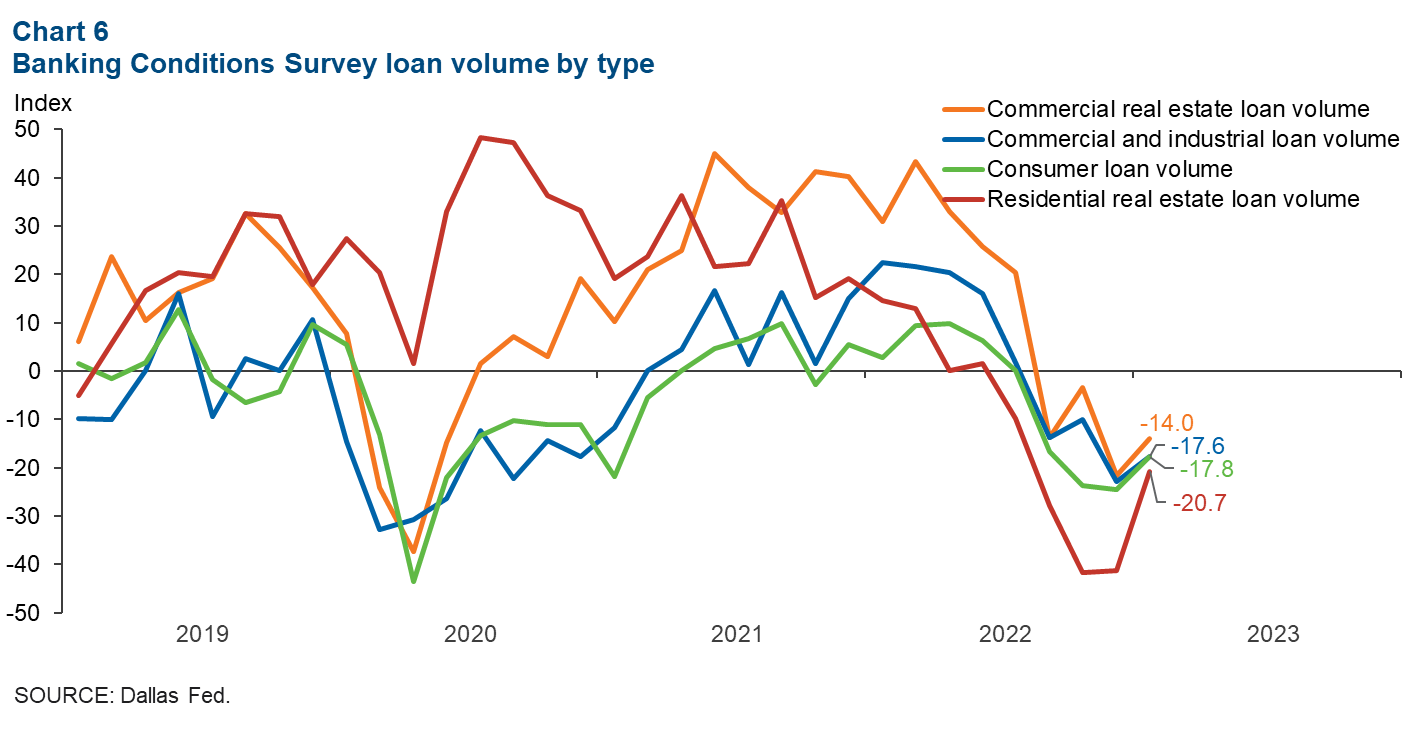
Banking Conditions Survey
The Dallas Fed's Banking Conditions Survey suggested continued decline in loan demand in February. Volumes for all loan types contracted (Chart 6). The commercial real estate loan volume index was in negative territory for the fourth month, although it improved by 7.6 points to -14.0. Similarly, the commercial and industrial and consumer loan volume indexes also posted their fourth consecutive negative readings at -17.6 and -17.8, respectively. The residential real estate loan volume index saw the largest improvement with the index climbing 20.6 points to -20.7. The six-month outlook for loan demand remained pessimistic in part due to concerns surrounding rising interest rates and inflation.
NOTE: Data may not match previously published numbers due to revisions.
About Texas Economic Indicators
Questions or suggestions can be addressed to Mytiah Caldwell at Mytiah.Caldwell@dal.frb.org. Texas Economic Indicators is published every month during the week after state and metro employment data are released.