Texas Economic Indicators

May 1, 2023
| Texas economy dashboard (March 2023) | |||
| Job growth (annualized) Dec. '22–March '23 |
Unemployment rate |
Avg. hourly earnings |
Avg. hourly earnings growth y/y |
| 3.9% | 4.0% | $31.24 | 6.0% |
Texas’ economy continued to expand in March. Employment growth was solid but moderated from earlier in the year. First-quarter job growth was strong, and payroll gains were seen in most major Texas metros. In March, unemployment remained flat for a second month, and the Texas Leading Index rose slightly. Oil prices fell the third week of April, while the rig count edged up. Construction contract values fell for the third straight month in March based on a five-month moving average.
Labor Market
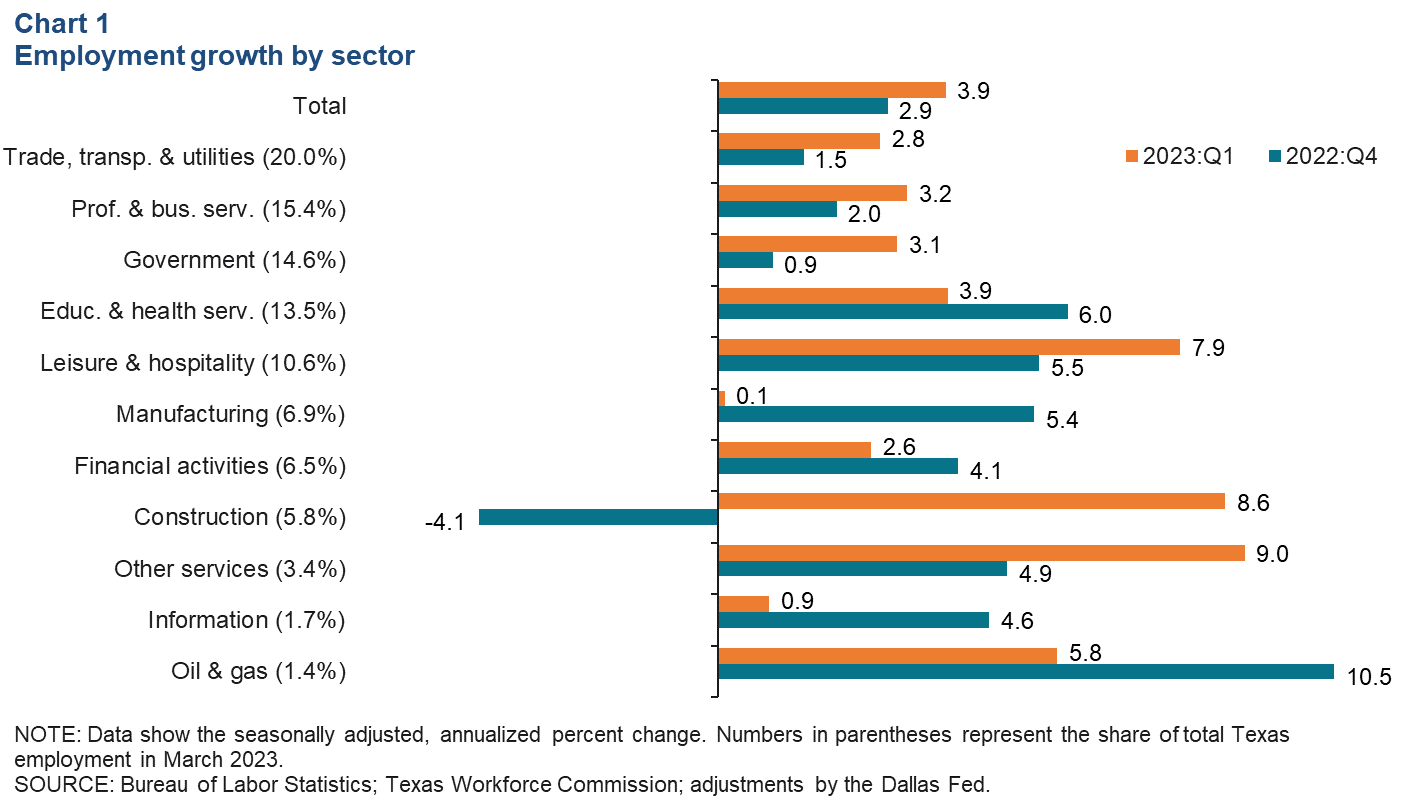
Texas major job sectors mostly see broad-based gains
Texas employment growth expanded an annualized 3.0 percent in March. Job growth was an annualized 3.9 percent (131,000 jobs) in the first quarter—faster gains than the 2.9 percent (97,000) increase in fourth quarter 2022 (Chart 1). First-quarter job growth was generally broad based across sectors, though employment in manufacturing was flat. Financial activities and information employment growth slowed in the first quarter, up 2.6 and 0.9 percent, respectively. Construction and leisure and hospitality saw strong gains, accelerating to 8.6 percent and 7.9 percent, respectively. The Dallas Fed’s Texas Employment Forecast was revised down to 2.4 percent job growth this year (December/December).
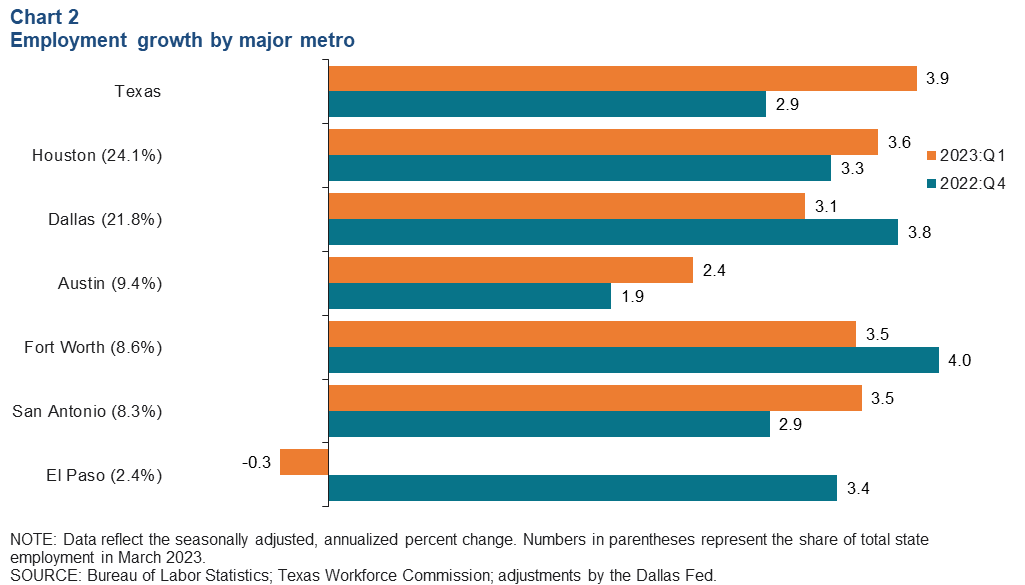
Employment growth increases in most major metros
First-quarter employment growth remained solid across most Texas metros, except for El Paso and Austin (Chart 2). Houston led with annualized job growth of 3.6 percent, followed by Fort Worth and San Antonio both posting an annualized 3.5 percent job expansion. Employment dipped 0.3 percent in El Paso, a slowing from the metro’s 3.4 percent growth in fourth quarter 2022. Growth in Austin was moderate at 2.4 percent.
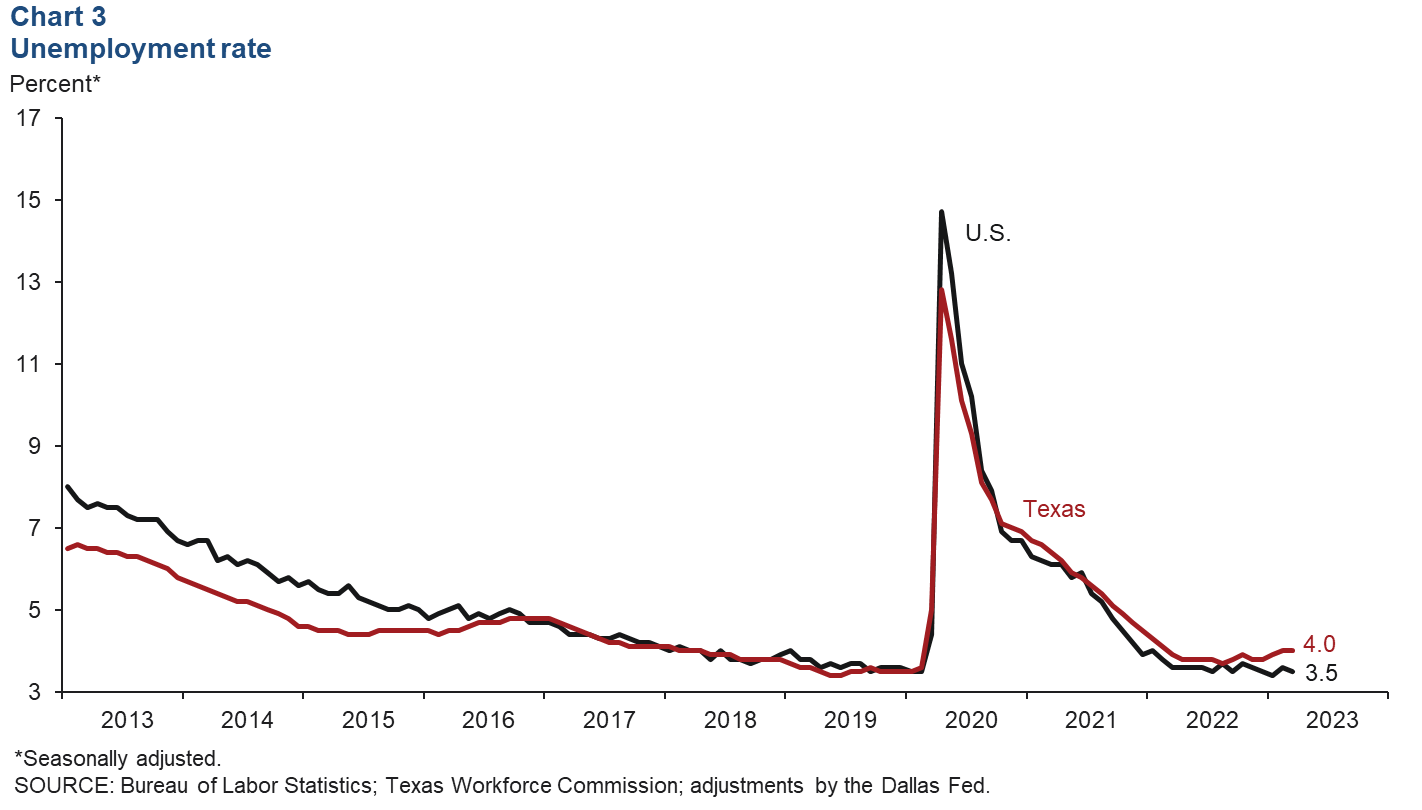
Unemployment remains unchanged
The Texas unemployment rate was 4.0 percent in March for a second month, while the U.S. jobless rate fell from 3.6 percent to 3.5 percent (Chart 3). In March, the unemployment rate was 2.2 percent for whites, 6.3 percent for Hispanics and 6.9 percent for Blacks. Texas’ labor force growth continued in March, expanding an annualized 6.6 percent (79,000 people). Meanwhile, the U.S. labor force rose an annualized 3.5 percent.
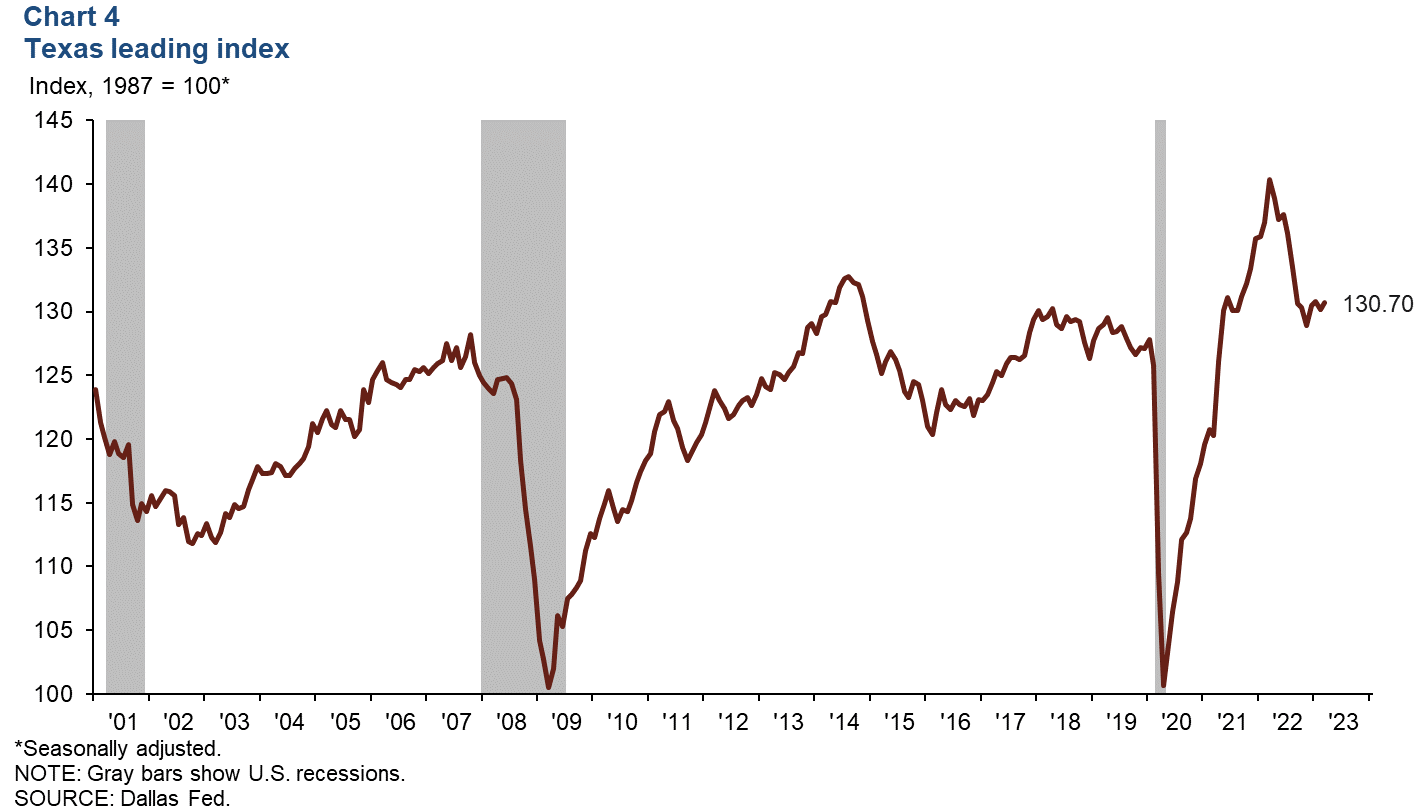
Texas Leading Index
The Texas Leading Index, a composite of eight leading indicators that sheds light on the future of the state’s economy, increased slightly to 130.7 in March (Chart 4). The three-month change was positive due to an increase in average weekly hours and a decrease in new unemployment claims and the Texas value of the dollar (which makes the state’s exports less expensive abroad).
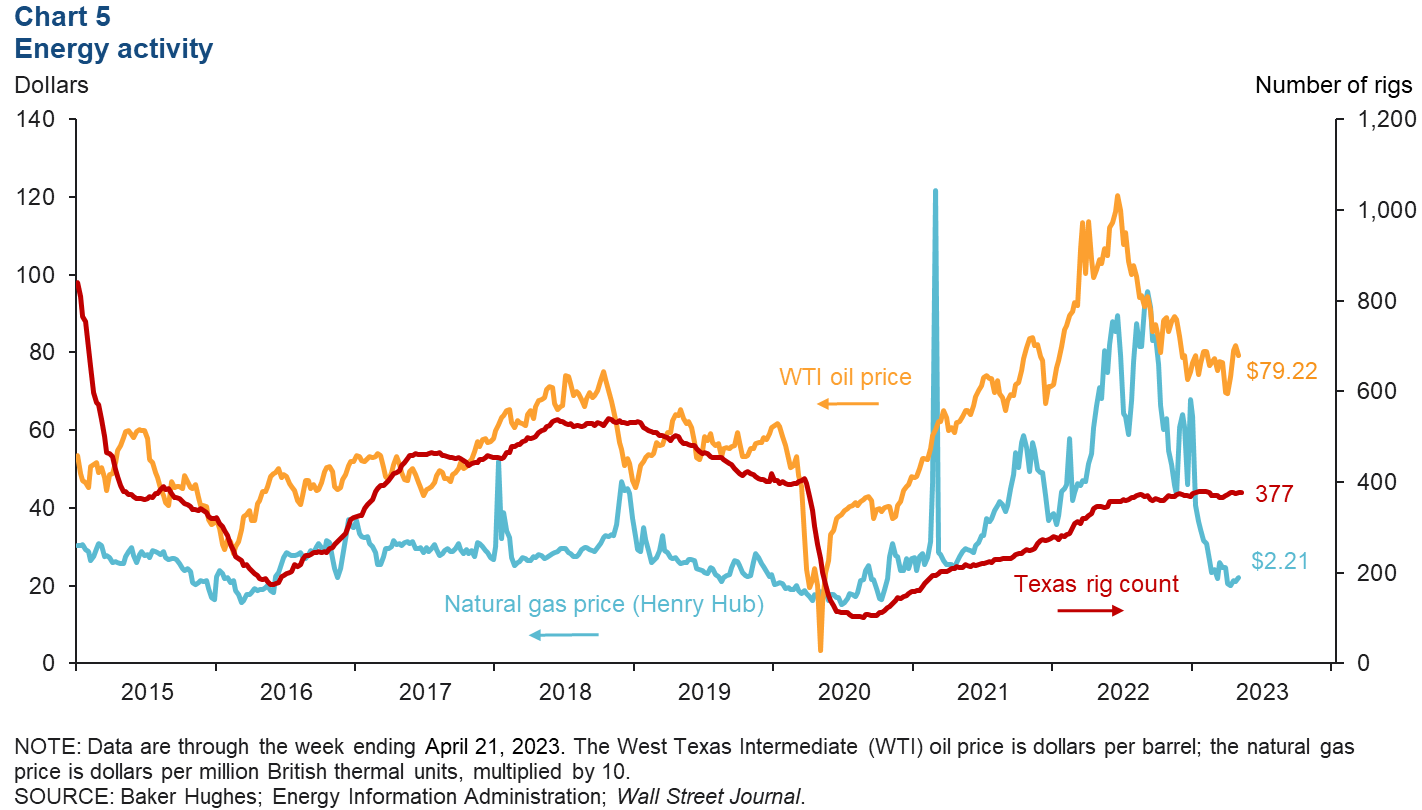
Energy
Oil prices fell in April. As of the week ending April 21, West Texas Intermediate crude was $79.22 per barrel, $2.65 lower than the previous week (Chart 5). Natural gas (Henry Hub) increased 11 cents to $2.21 per million British thermal units. The number of active rigs in Texas was little changed at 377 during the same period.
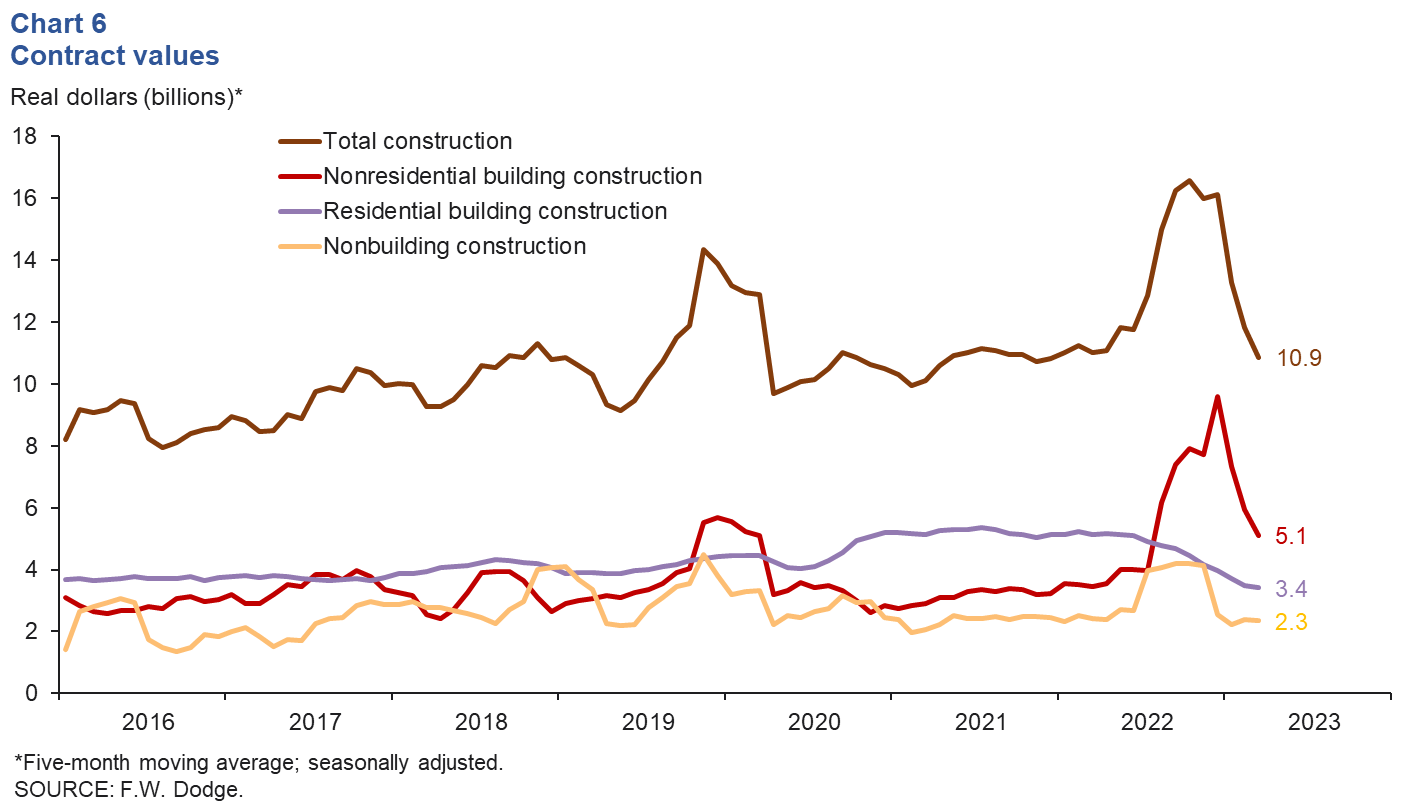
Construction
Construction contract values increased by 11.6 percent in March; however, the five-month moving average dipped for a third straight month—falling 8.0 percent to $10.9 billion (Chart 6). The five-month moving average of nonresidential values dropped for a third consecutive month to $5.1 billion; residential building construction values fell for the 11th consecutive month to $3.4 billion, and nonbuilding construction dipped to $2.3 billion. Year to date through March, total construction contract values were down 22 percent compared with the same period in 2022.
NOTE: Data may not match previously published numbers due to revisions.
About Texas Economic Indicators
Questions or suggestions can be addressed to Mytiah Caldwell at Mytiah.Caldwell@dal.frb.org. Texas Economic Indicators is published every month during the week after state and metro employment data are released.