Texas Economic Indicators
| Texas economy dashboard (November 2023) | |||
| Job growth (annualized) Aug.–Nov. '23 |
Unemployment rate |
Avg. hourly earnings |
Avg. hourly earnings growth y/y |
| 3.8% | 4.1% | $31.89 | 4.8% |
The Texas economy expanded in November. Employment grew faster than in October, while unemployment remained flat. In October, the Texas headline Consumer Price Index turned up for the third month in a row. The Texas Leading Index was relatively flat in November. The December Texas Business Outlook Surveys (TBOS) indicated further moderation in wage growth.
Labor market
Job gains accelerate in November
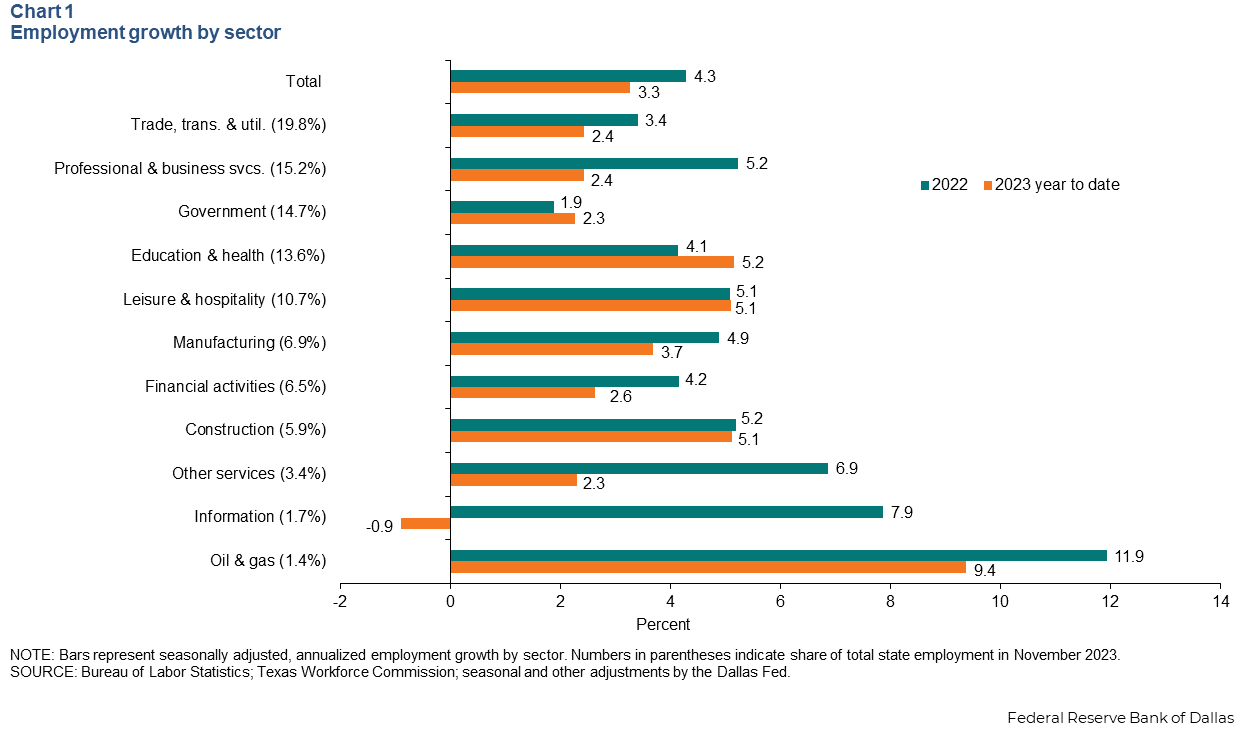
Texas employment expanded 3.1 percent in November while October growth was revised up notably to 2.5 percent. Year to date through November, job gains were largely widespread across major sectors. Employment grew over 5 percent in education and health, leisure and hospitality, and construction. On aggregate, Texas jobs grew 3.3 percent—lower than 2022’s increase of 4.3 percent (Chart 1). The Dallas Fed’s Texas Employment Forecast released Dec. 22, forecasted 3.2 percent job growth through the end of 2023.
Job growth in major metros lags behind 2022
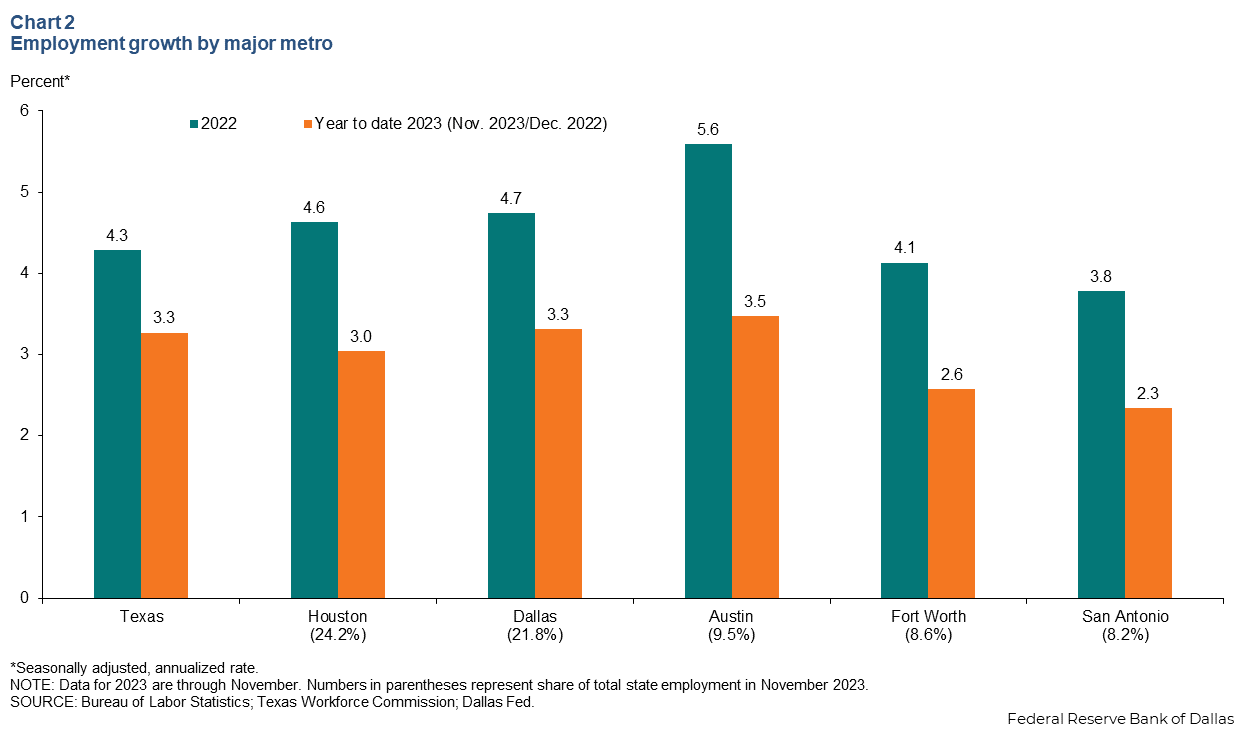
Employment growth in November was mixed across Texas major metros. Austin and San Antonio posted strong gains, but growth was moderate in Houston and Fort Worth. Year to date, Austin led with annualized job growth of 3.5 percent, followed by Dallas at 3.3 percent growth and Houston at 3.0 percent (Chart 2). Fort Worth and San Antonio saw job gains of 2.6 percent and 2.3 percent, respectively, below the state’s 3.3 percent increase.
Unemployment holds steady
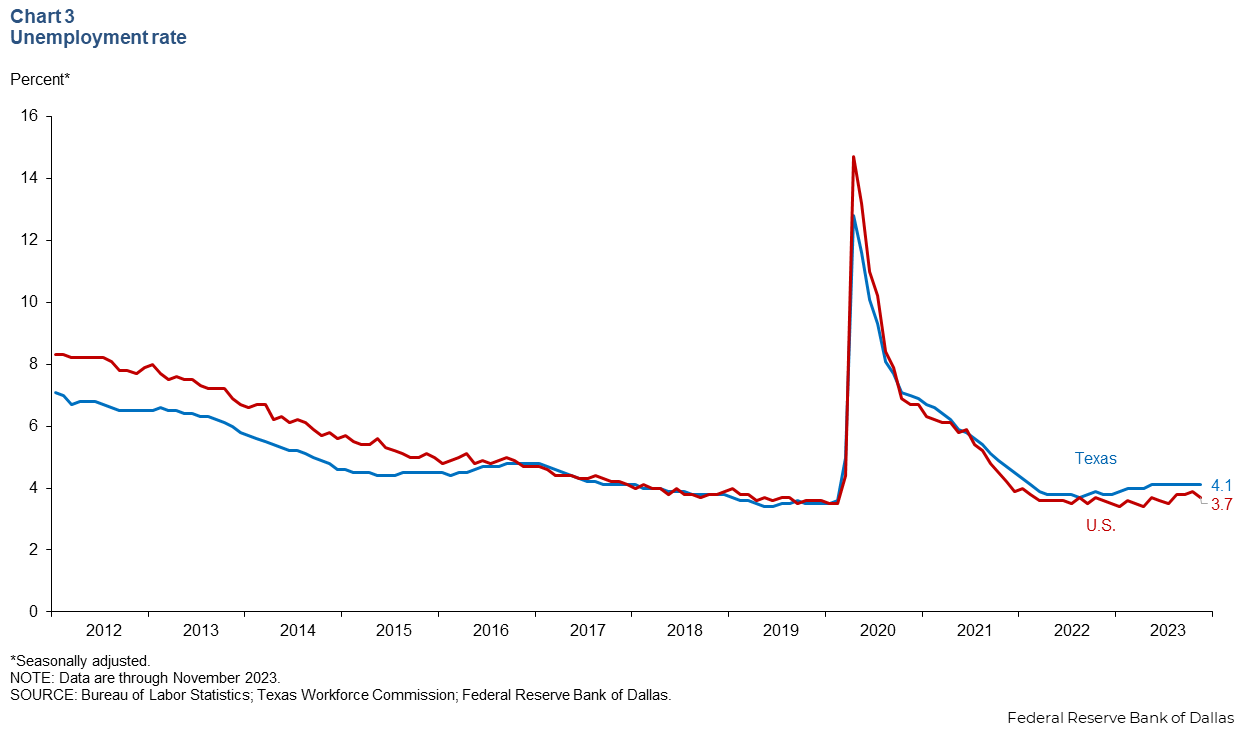
The Texas unemployment rate was 4.1 percent in November for a seventh straight month, while the U.S. jobless rate dipped to 3.7 percent (Chart 3). In November, the unemployment rate in Texas was 4.4 percent for Blacks, 4.3 percent for Hispanics and 1.8 percent for whites.
Consumer prices
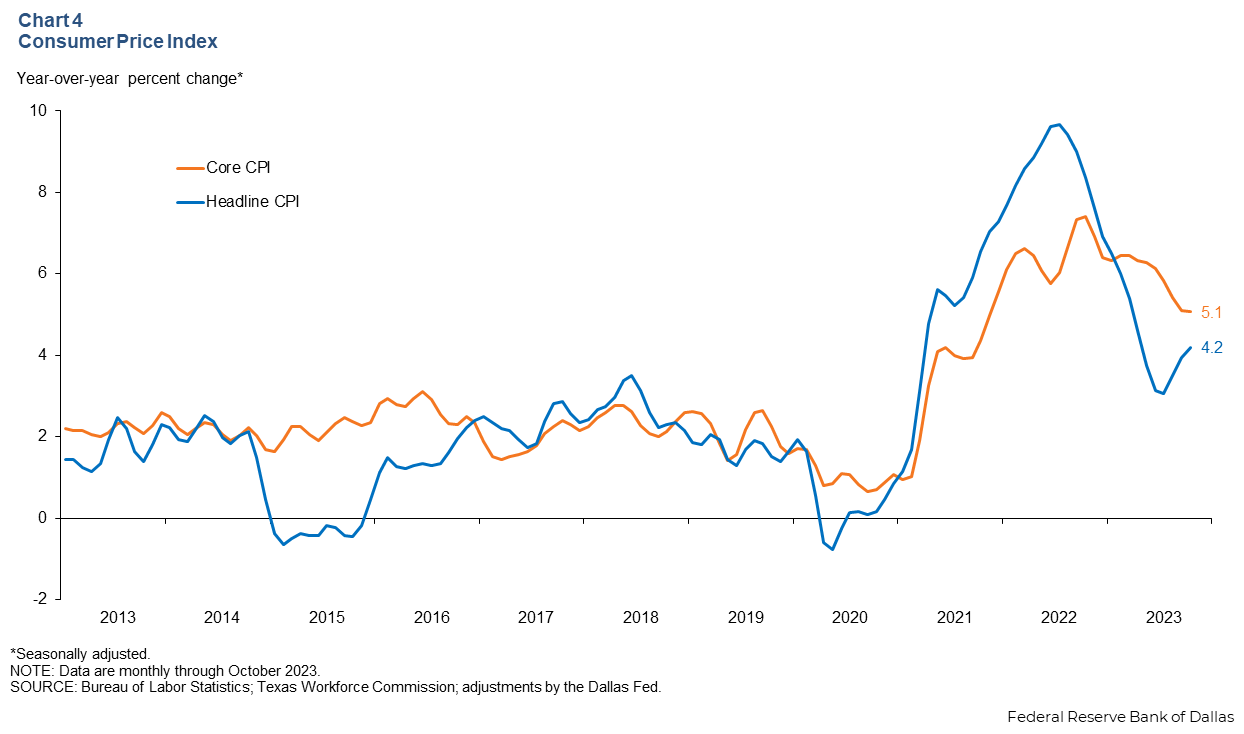
In October, inflation remained elevated, as the 12-month change in the Texas headline CPI ticked up to 4.2 percent (Chart 4). Meanwhile core CPI, which excludes food and energy, held steady at an elevated 5.1 percent over the same period.
Texas Business Outlook Surveys
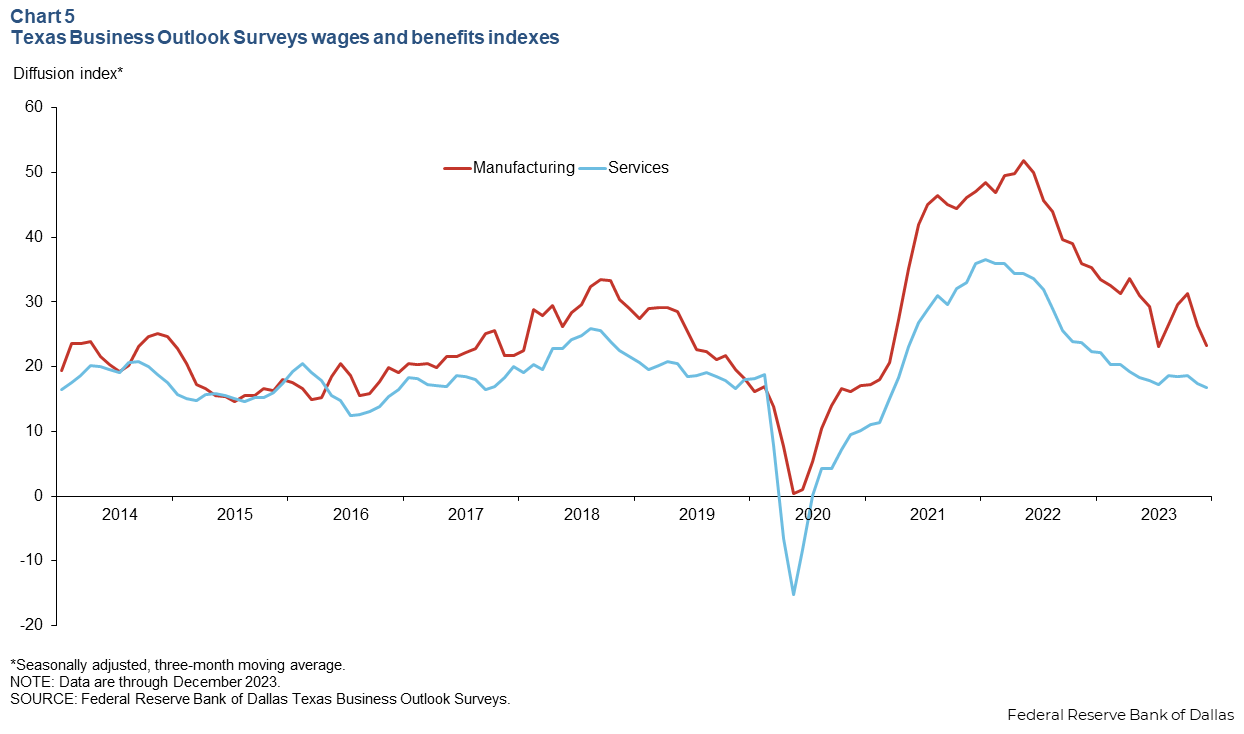
The December Texas Business Outlook Surveys reported further normalization in wage pressures (Chart 5). The three-month moving average of wages and benefits indexes for manufacturing and services dipped but remained in positive territory and in line with historical averages, suggesting moderate wage growth.
Texas Leading Index
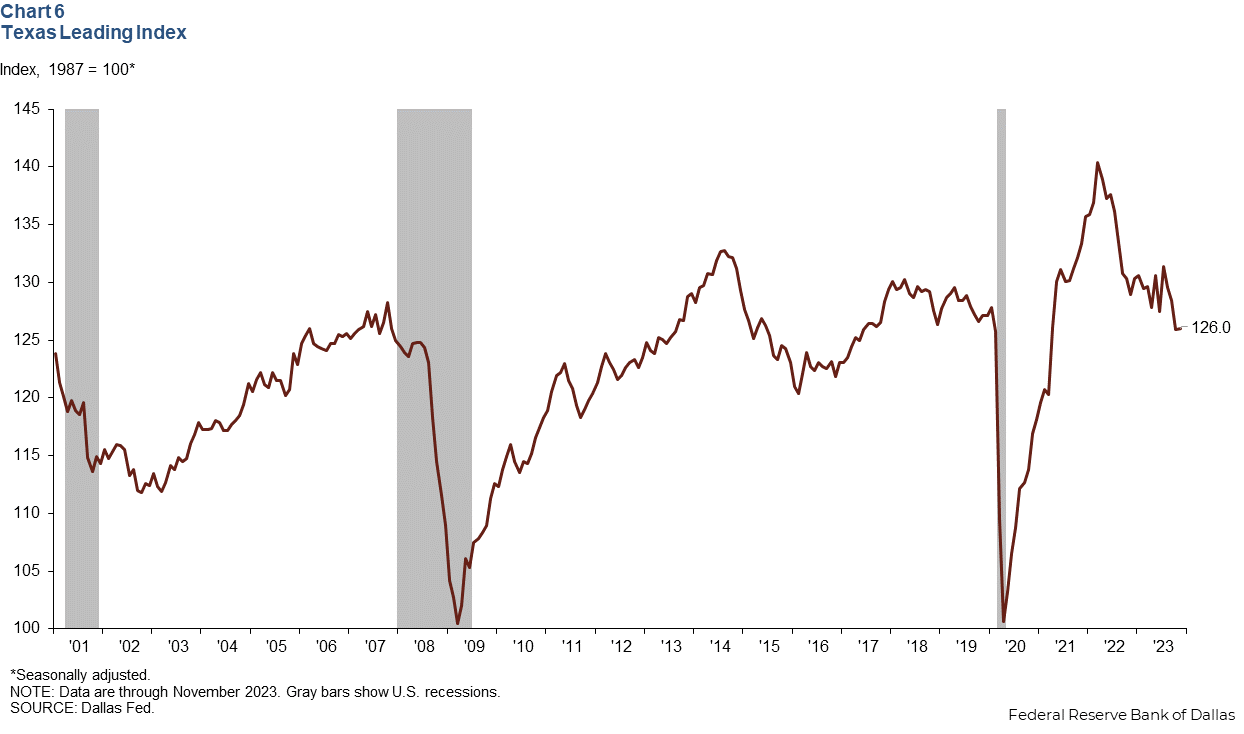
The Texas Leading Index, a composite of eight leading indicators that sheds light on the future of the state’s economy, was little changed in November (Chart 6). The three-month change was negative, however, as most components contributed negatively to the index except for an increase in average hours worked and the Texas Stock Index.
NOTE: Data may not match previously published numbers due to revisions.
About Texas Economic Indicators
Questions or suggestions can be addressed to Diego Morales-Burnett at diego.morales-burnett@dal.frb.org. Texas Economic Indicators is published every month during the week after state and metro employment data are released.