Agricultural Survey

Survey Highlights
Bankers responding to the first-quarter survey reported overall weaker conditions across most regions of the Eleventh District. They noted that dry conditions are straining agricultural production and that inflationary pressures remain an impediment.
“We are experiencing the driest two-year period since the ’50s. For the first time in my life, we have seen native grass pastures blowing,” one survey participant said. “Conditions remain extremely dry. Winds have further hampered, and been frustrating to, the startup of the farming season,” another noted.
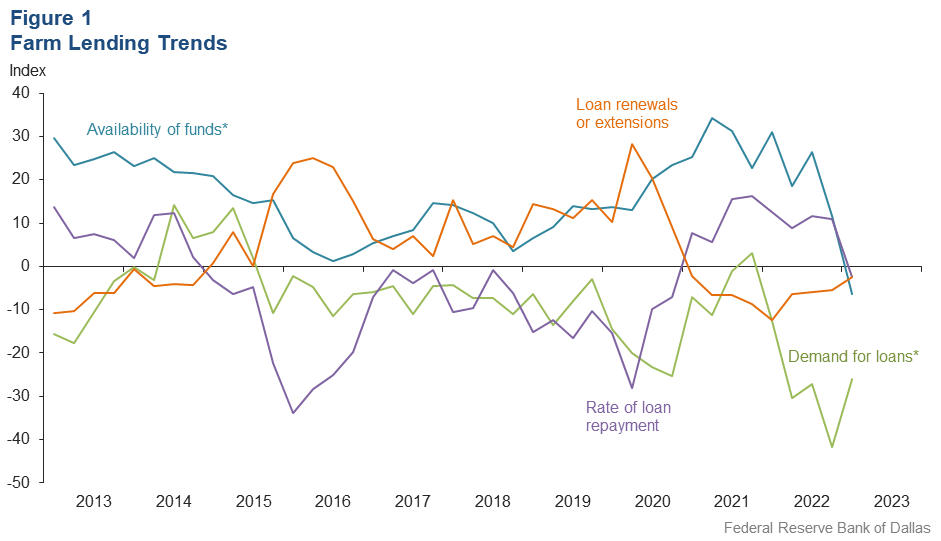
Demand for agricultural loans decreased in the first quarter for the fifth straight quarter. Loan renewals or extensions fell for the ninth quarter in a row, while the rate of loan repayment fell for the first time since 2020. Loan volume decreased for all categories compared with a year ago (Figure 1).
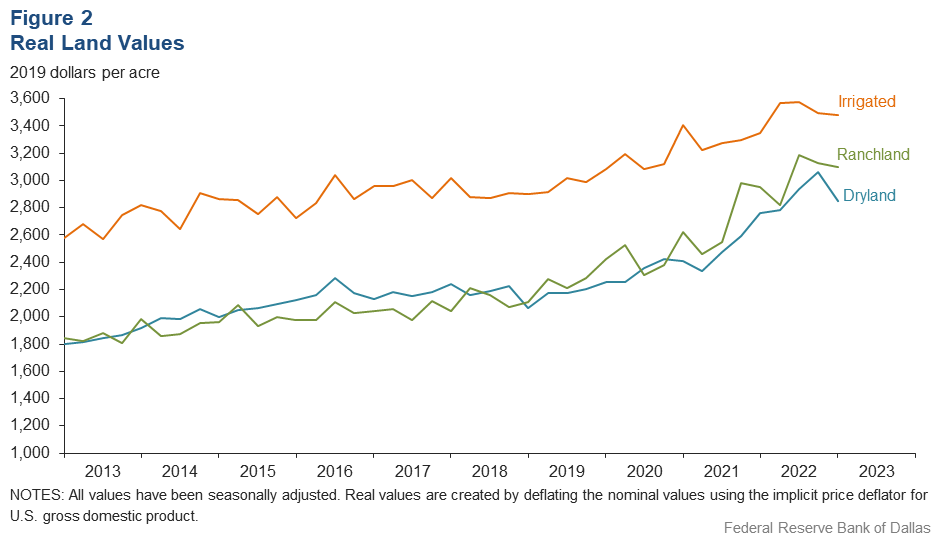
Ranchland, irrigated cropland and dryland values fell this quarter (Figure 2). But according to bankers who responded in both this quarter and first quarter 2022, ranchland, irrigated cropland and dryland values rose at least 8 percent year over year in Texas, with some segments seeing much higher increases (Table 1).
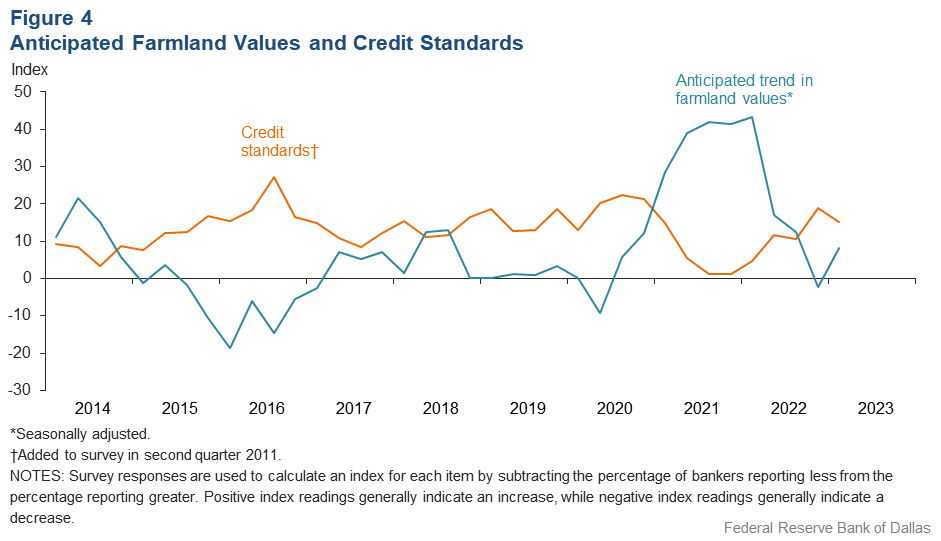
The anticipated trend in farmland values index bounced back into positive territory, suggesting respondents expect farmland values to increase. The credit standards index was positive, indicating a tightening of standards on net (Figure 4).
Next release: June 27, 2023
Agricultural Survey is compiled from a survey of Eleventh District agricultural bankers, and data have been seasonally adjusted as necessary. Data were collected March 7–15, and 89 bankers responded to the survey.
Quarterly Comments

District bankers were asked for additional comments concerning agricultural land values and credit conditions. These comments have been edited for publication.
Region 1—Northern High Plains
- We are experiencing the driest two-year period since the ’50s. For the first time in my life, we have seen native grass pastures blowing. Another wave of cows will likely be liquidated soon. The moisture profile will need to be built up significantly before summer crops are planted. Inflationary pressures are causing operating lines to be much higher this renewal season.
- Conditions remain extremely dry. Winds have further hampered, and been frustrating to, the startup of the farming season. Wheat pasture grazing of cattle was poor, and prospects of summer grass grazing look bleak. Surprisingly with these conditions, farmland and ranchland prices continue to rise, with demand outstripping the limited supply of land available for purchase.
- The persistent drought has been devastating on the farmers and ranchers in our area. Many have sold off calf crops earlier than normal, and some have sold mature cows due to the lack of pasture and hay. This has been seen on a broader scale around the region also. The dryland winter wheat crop looks poor, with many acres being lost. Irrigated wheat acres are likely to be grazed-out; however, there's not many irrigated acres to begin with. The fall crop planting season is about to get started in coming months. Many irrigated farmers have begun prewatering; however, this will limit profitability. Commodity prices have seen some pullback recently, but they are still favorable if yields are high and input costs are managed. The drought insurance from the federal programs has been a nice boost for many livestock producers in the area, but moisture is badly needed. On the banking side, managing interest rate risk and profitability have come center stage with the rising interest rates on deposits.
Region 2—Southern High Plains
- Concern has increased with cotton producers due to the rise in input costs and interest rates, plus continued downward-to-modest movement in the current cotton price.
Region 3—Northern Low Plains
- The area is still experiencing drought conditions. Producers are preparing land for planting. Native pasture conditions are still considered poor, with limited wheat pasture grazing available. The prospects of many dryland acres making it to harvest are slim in this area. Farm cash-flow projections are tight this year with higher interest rates and little relief on input costs.
Region 6—North Central Texas
- Calf prices have increased in the past three months. Input costs have also increased. Hay prices remain elevated with diminished inventories.
Region 7—East Texas
- Dryland farming and stocker cattle are showing interest.
Region 11—Trans-Pecos and Edwards Plateau
- Dry conditions have required many producers to increase feeding more than in normal years. Ag loans continue to perform satisfactorily as a result of good market prices for sheep and goats and reasonable prices in the cattle market. The inflated expenses that producers are experiencing will have an adverse effect on many producers, especially those with minimal or no income outside of their ag operation. Government programs provide a lifeline in these situations.
Historical Data
Historical data can be downloaded dating back to first quarter 2000.
Figures
Farm Lending Trends
What changes occurred in non-real-estate farm loans at your bank in the past three months compared with a year earlier?
| Index | Percent reporting, Q1 | ||||
| 2022:Q4 | 2023:Q1 | Greater | Same | Less | |
Demand for loans* | –41.8 | –25.9 | 4.2 | 65.7 | 30.1 |
Availability of funds* | 11.7 | –6.5 | 9.2 | 75.1 | 15.7 |
Rate of loan repayment | 11.0 | –2.4 | 7.1 | 83.5 | 9.4 |
Loan renewals or extensions | –5.4 | –2.4 | 10.6 | 76.5 | 12.9 |

What changes occurred in the volume of farm loans made by your bank in the past three months compared with a year earlier?
| Index | Percent reporting, Q1 | ||||
| 2022:Q4 | 2023:Q1 | Greater | Same | Less | |
Non–real–estate farm loans | –32.4 | –16.1 | 12.6 | 58.6 | 28.7 |
Feeder cattle loans* | –14.6 | –14.0 | 13.3 | 59.4 | 27.3 |
Dairy loans* | –15.6 | –21.3 | 2.4 | 73.9 | 23.7 |
Crop storage loans* | –12.2 | –17.9 | 9.4 | 63.3 | 27.3 |
Operating loans | –9.9 | –3.5 | 14.1 | 68.2 | 17.7 |
Farm machinery loans* | –25.6 | –21.2 | 7.0 | 64.8 | 28.2 |
Farm real estate loans* | –22.9 | –25.1 | 7.8 | 59.3 | 32.9 |
| *Seasonally adjusted. NOTES: Survey responses are used to calculate an index for each item by subtracting the percentage of bankers reporting less from the percentage reporting greater. Positive index readings generally indicate an increase, while negative index readings generally indicate a decrease. |
|||||
Real Land Values

Real Cash Rents

Anticipated Farmland Values and Credit Standards
What trend in farmland values do you expect in your area in the next three months?
| Index | Percent reporting, Q1 | ||||
| 2022:Q4 | 2023:Q1 | Up | Same | Down | |
| Anticipated trend in farmland values* | –2.4 | 8.1 | 15.7 | 76.7 | 7.6 |
What change occurred in credit standards for agricultural loans at your bank in the past three months compared with a year earlier?†
| 2022:Q4 | 2023:Q1 | Up | Same | Down | |
| Credit standards | 18.9 | 15.1 | 17.4 | 80.2 | 2.3 |

Tables
Rural Real Estate Values—First Quarter 2023
| Banks1 | Average value2 | Percent change in value from previous year3 | ||
Cropland–Dryland | ||||
District* | 66 | 2,921 | 7.8 | |
Texas* | 57 | 2,971 | 8.1 | |
1 | Northern High Plains | 10 | 1,108 | –2.2 |
2 | Southern High Plains | 8 | 1,138 | 7.8 |
3 | Northern Low Plains* | n.a. | n.a. | n.a. |
4 | Southern Low Plains* | 5 | 1,867 | 4.4 |
5 | Cross Timbers | 4 | 3,963 | 0.0 |
6 | North Central Texas | 5 | 5,180 | 14.6 |
7 | East Texas* | n.a. | n.a. | n.a. |
8 | Central Texas | 10 | 7,700 | 6.6 |
9 | Coastal Texas | 5 | 2,640 | 0.0 |
10 | South Texas | n.a. | n.a. | n.a. |
11 | Trans–Pecos and Edwards Plateau | 4 | 3,750 | 0.0 |
12 | Southern New Mexico | 4 | 713 | 0.0 |
13 | Northern Louisiana | 5 | 3,770 | 4.3 |
Cropland–Irrigated | ||||
District* | 57 | 3,570 | 12.2 | |
Texas* | 46 | 3,181 | 12.8 | |
1 | Northern High Plains | 10 | 3,090 | 20.3 |
2 | Southern High Plains | 8 | 2,225 | 5.5 |
3 | Northern Low Plains* | n.a. | n.a. | n.a. |
4 | Southern Low Plains | 5 | 2,540 | 0.0 |
5 | Cross Timbers | 3 | 4,450 | 0.0 |
6 | North Central Texas | 4 | 4,850 | 0.0 |
7 | East Texas | n.a. | n.a. | n.a. |
8 | Central Texas | 6 | 8,583 | 24.3 |
9 | Coastal Texas | n.a. | n.a. | n.a. |
10 | South Texas | n.a. | n.a. | n.a. |
11 | Trans–Pecos and Edwards Plateau | 3 | 4,933 | 0.0 |
12 | Southern New Mexico | 6 | 5,932 | 12.4 |
13 | Northern Louisiana | 5 | 4,990 | 8.7 |
Ranchland | ||||
District* | 73 | 3,175 | 8.0 | |
Texas* | 64 | 3,793 | 8.2 | |
1 | Northern High Plains | 10 | 933 | 1.7 |
2 | Southern High Plains | 7 | 1,043 | 12.2 |
3 | Northern Low Plains | n.a. | n.a. | n.a. |
4 | Southern Low Plains* | 5 | 2,148 | –6.7 |
5 | Cross Timbers | 6 | 4,758 | 28.4 |
6 | North Central Texas | 5 | 6,240 | 18.8 |
7 | East Texas | 6 | 4,483 | 16.8 |
8 | Central Texas | 9 | 9,189 | 2.9 |
9 | Coastal Texas | 5 | 3,020 | 0.0 |
10 | South Texas | 3 | 3,167 | 30.0 |
11 | Trans–Pecos and Edwards Plateau | 6 | 3,792 | 0.0 |
12 | Southern New Mexico | 5 | 500 | 2.2 |
13 | Northern Louisiana | 4 | 2,800 | 3.6 |
| *Seasonally adjusted. 1 Number of banks reporting land values. 2 Prices are dollars per acre, not adjusted for inflation. 3 Not adjusted for inflation and calculated using responses only from those banks reporting in both the past and current quarter. n.a.—Not published due to insufficient responses but included in totals for Texas and district. |
||||
Interest Rates by Loan Type—First Quarter 2023
| Feeder cattle | Other farm operating | Intermediate term | Long-term farm real estate | |
| Fixed (average rate, percent) | ||||
2022:Q1 | 5.69 | 5.62 | 5.54 | 5.30 |
2022:Q2 | 5.97 | 6.00 | 5.81 | 5.45 |
2022:Q3 | 6.80 | 6.75 | 6.66 | 6.35 |
2022:Q4 | 7.97 | 8.00 | 7.87 | 7.47 |
2023:Q1 | 8.57 | 8.56 | 8.44 | 8.08 |
| Variable (average rate, percent) | ||||
2022:Q1 | 5.42 | 5.33 | 5.25 | 4.93 |
2022:Q2 | 5.63 | 5.67 | 5.53 | 5.30 |
2022:Q3 | 6.72 | 6.60 | 6.41 | 6.19 |
2022:Q4 | 8.07 | 8.04 | 7.92 | 7.51 |
2023:Q1 | 8.79 | 8.75 | 8.57 | 8.21 |
For More Information
Questions regarding the Agricultural Survey can be addressed to Jesus Cañas at Jesus.Canas@dal.frb.org.