Agricultural Survey

Survey highlights
Bankers responding to the third-quarter survey reported overall weaker conditions across most regions of the Eleventh District. Extreme dry conditions are putting a strain on agricultural production. They noted good prices for cattle and agricultural land.
“The combination of extreme heat and wind have dried out our area. Cotton, grain sorghum and summer hay are very weak in most of our area. Cattle are doing good considering conditions. Prices are at all-time highs, but liquidations will start soon due to lack of grass and water,” one survey participant said. “Land in our area is selling at $50,000 to $100,000 per acre for 30-to-50-acre tracts … . Conventional agricultural use of land in our county and surrounding counties is on its way out,” another noted.
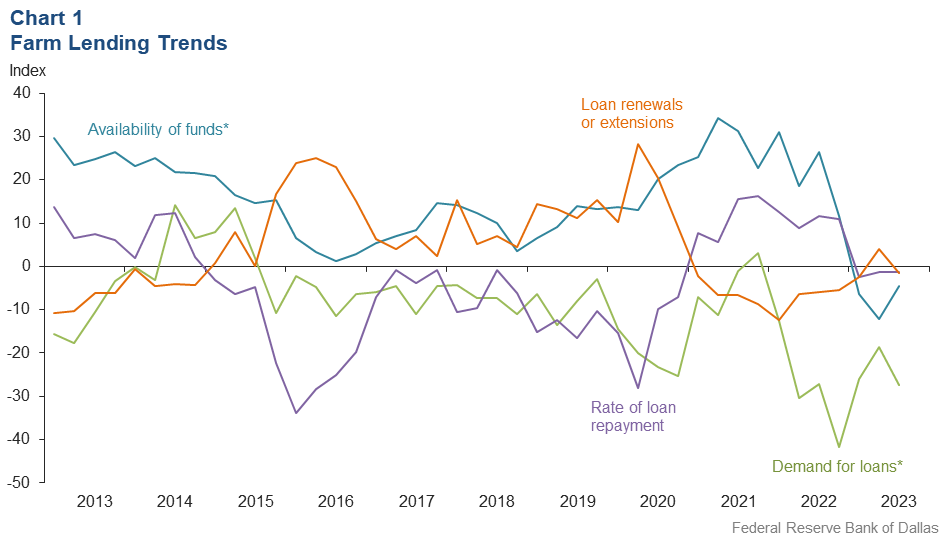
Demand for agricultural loans decreased in the third quarter for the seventh straight quarter. Loan renewals or extensions fell after increasing the previous quarter, while the rate of loan repayment dropped but at a lower rate than the second quarter. Loan volume was down for all categories compared with a year ago (Chart 1).
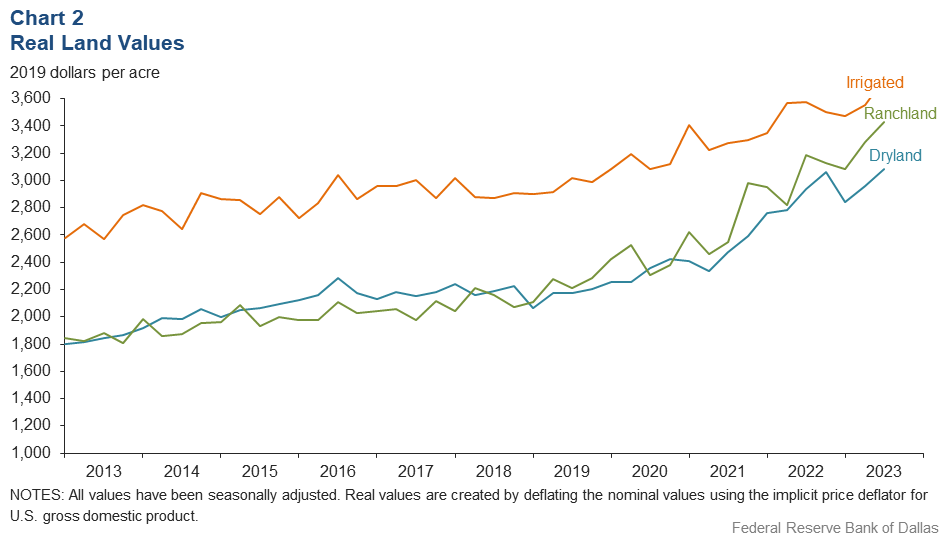
Ranchland, irrigated cropland and dryland values increased this quarter (Chart 2). In third quarter 2023, ranchland, irrigated cropland and dryland values rose at least 13 percent year over year in Texas, with cropland seeing much higher increases (Table 1).
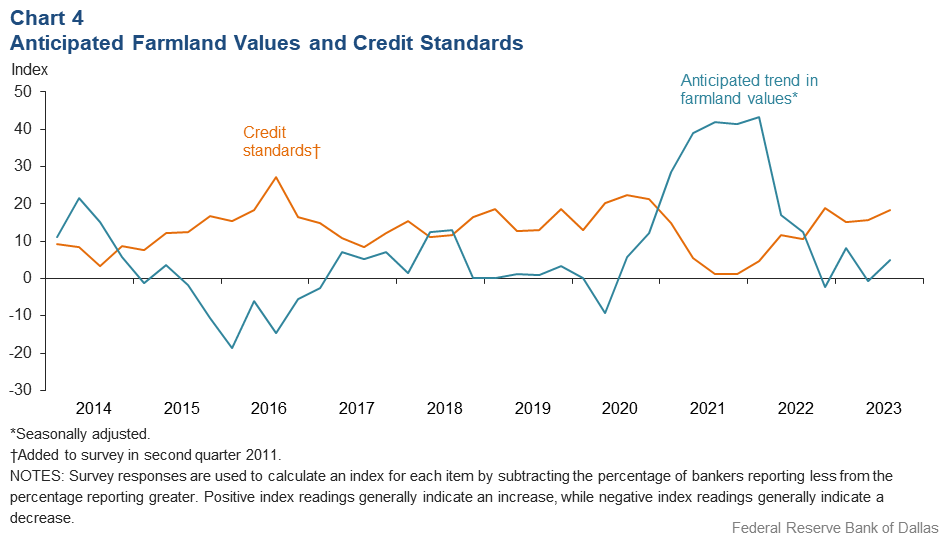
The anticipated trend in farmland values index came back to positive territory, suggesting respondents expect farmland values to increase. The credit standards index was positive, indicating a tightening of standards on net (Chart 4).
Next release: January 2, 2024
Agricultural Survey is compiled from a survey of Eleventh District agricultural bankers, and data have been seasonally adjusted as necessary. Data were collected September 5-13, and 72 bankers responded to the survey.
Quarterly comments

District bankers were asked for additional comments concerning agricultural land values and credit conditions. These comments have been edited for publication.
- Conditions are very dry.
- Loans reported are not typical, but sales are in special cases (family, etc.) There has been almost no activity in the area.
- [There have been] three consecutive years of drought on the South Plains. [It’s been] another terrible crop year. Grazing is short where it even exists. Still, producers have made up for it with good insurance coverage. Land prices are holding up with little land on the market. Cattle prices are finally catching up.
- We have had no rain since mid-July. We are extremely dry. We will have a late start to planting wheat. Stock water is becoming a big concern for cow calf producers.
- The combination of extreme heat and wind have dried out our area. Cotton, grain sorghum and summer hay are very weak in most of our area. Cattle are doing good considering the conditions. Prices are at all-time highs, but liquidations will start soon due to lack of grass and water.
- Land in our area is selling at $50,000 to $100,000 per acre for 30-to-50-acre tracts with plenty of comparables. If you find $20,000 price per acre, it would be a bargain for large tracts. Conventional agricultural use of land in our county and surrounding counties is on its way out.
- Pasture conditions are very dry with very hot conditions for the past couple of months. Calf, lamb and kid goat prices remain very good, especially considering the increasing drought conditions. Decisions on retaining breeding livestock are being made, with most trying to hold on to them, hoping for rains soon. Most agricultural real estate sales are for recreational purposes.
- [It’s been a] very dry summer, resulting in significant drought conditions. Some areas are beginning to see late summer, early fall rains. Growing season is coming to an end. Harvest operations of corn silage, cotton and alfalfa are started and continuing through October. Cattle prices are very good. Many dairies are beefing quality milk cows with remaining life.
Historical data
Historical data can be downloaded dating back to first quarter 2000.
Charts
Farm lending trends
What changes occurred in non-real-estate farm loans at your bank in the past three months compared with a year earlier?
| Index | Percent reporting, Q3 | ||||
| 2023:Q2 | 2023:Q3 | Greater | Same | Less | |
Demand for loans* | –18.7 | –27.5 | 6.9 | 58.7 | 34.4 |
Availability of funds* | –12.1 | –4.6 | 8.7 | 78.0 | 13.3 |
Rate of loan repayment | –1.3 | –1.4 | 4.3 | 90.0 | 5.7 |
Loan renewals or extensions | 3.9 | –1.5 | 4.4 | 89.9 | 5.8 |
| *Seasonally adjusted. | |||||

What changes occurred in the volume of farm loans made by your bank in the past three months compared with a year earlier?
| Index | Percent reporting, Q3 | ||||
| 2023:Q2 | 2023:Q3 | Greater | Same | Less | |
Non–real–estate farm loans | –16.0 | –24.3 | 7.1 | 61.4 | 31.4 |
Feeder cattle loans* | –12.9 | –19.0 | 11.1 | 58.8 | 30.1 |
Dairy loans* | –15.4 | –24.0 | 3.0 | 70.0 | 27.0 |
Crop storage loans* | –17.1 | –24.3 | 0.6 | 74.5 | 24.9 |
Operating loans | 2.8 | –7.4 | 13.2 | 66.2 | 20.6 |
Farm machinery loans* | –24.1 | –27.4 | 6.2 | 60.2 | 33.6 |
Farm real estate loans* | –25.1 | –35.3 | 3.2 | 58.3 | 38.5 |
| *Seasonally adjusted. NOTES: Survey responses are used to calculate an index for each item by subtracting the percentage of bankers reporting less from the percentage reporting greater. Positive index readings generally indicate an increase, while negative index readings generally indicate a decrease. |
|||||
Real land values

Real cash rents

Anticipated farmland values and credit standards
What trend in farmland values do you expect in your area in the next three months?
| Index | Percent reporting, Q3 | ||||
| 2023:Q2 | 2023:Q3 | Up | Same | Down | |
| Anticipated trend in farmland values* | –0.6 | 4.9 | 9.9 | 85.1 | 5.0 |
| *Seasonally adjusted. | |||||
What change occurred in credit standards for agricultural loans at your bank in the past three months compared with a year earlier?
| 2023:Q2 | 2023:Q3 | Tightened | Same | Loosened | |
| Credit standards | 15.8 | 18.3 | 19.7 | 78.9 | 1.4 |

Tables
Rural real estate values—third quarter 2023
| Banks1 | Average value2 | Percent change in value from previous year3 | ||
Cropland–Dryland | ||||
District* | 56 | 3,207 | 15.8 | |
Texas* | 47 | 3,289 | 16.9 | |
1 | Northern High Plains | 6 | 1,150 | 7.8 |
2 | Southern High Plains | 6 | 1,325 | 13.2 |
3 | Northern Low Plains* | n.a. | n.a. | n.a. |
4 | Southern Low Plains* | 3 | 2,180 | 0.0 |
5 | Cross Timbers | n.a. | n.a. | n.a. |
6 | North Central Texas | 4 | 5,875 | 4.4 |
7 | East Texas* | 3 | 4,027 | 35.3 |
8 | Central Texas | 10 | 8,825 | 13.9 |
9 | Coastal Texas | 3 | 2,700 | 0.0 |
10 | South Texas | n.a. | n.a. | n.a. |
11 | Trans–Pecos and Edwards Plateau | 7 | 4,700 | 30.6 |
12 | Southern New Mexico | 3 | 600 | –5.0 |
13 | Northern Louisiana | 6 | 3,633 | –1.1 |
Cropland–Irrigated | ||||
District* | 47 | 3,897 | 14.1 | |
Texas* | 37 | 3,347 | 21.6 | |
1 | Northern High Plains | 6 | 2,817 | 31.0 |
2 | Southern High Plains | 6 | 2,617 | 27.2 |
3 | Northern Low Plains* | n.a. | n.a. | n.a. |
4 | Southern Low Plains | 3 | 2,567 | 0.0 |
5 | Cross Timbers | n.a. | n.a. | n.a. |
6 | North Central Texas | 3 | 6,333 | 15.1 |
7 | East Texas | 3 | 4,883 | 21.7 |
8 | Central Texas | 5 | 11,050 | 26.4 |
9 | Coastal Texas | n.a. | n.a. | n.a. |
10 | South Texas | n.a. | n.a. | n.a. |
11 | Trans–Pecos and Edwards Plateau | 6 | 4,883 | 3.4 |
12 | Southern New Mexico | 4 | 7,815 | 2.6 |
13 | Northern Louisiana | 6 | 5,283 | –1.3 |
Ranchland | ||||
District* | 62 | 3,568 | 14.0 | |
Texas* | 50 | 4,258 | 13.3 | |
1 | Northern High Plains | 6 | 1,183 | 25.1 |
2 | Southern High Plains | 5 | 1,160 | 5.5 |
3 | Northern Low Plains | n.a. | n.a. | n.a. |
4 | Southern Low Plains* | 3 | 2,480 | 0.0 |
5 | Cross Timbers | 3 | 5,667 | 100.0 |
6 | North Central Texas | 4 | 6,250 | –10.7 |
7 | East Texas | 5 | 4,750 | 43.8 |
8 | Central Texas | 10 | 11,700 | 18.3 |
9 | Coastal Texas | 3 | 3,067 | 4.0 |
10 | South Texas | n.a. | n.a. | n.a. |
11 | Trans–Pecos and Edwards Plateau | 8 | 4,450 | 5.2 |
12 | Southern New Mexico | 6 | 590 | 42.4 |
13 | Northern Louisiana | 6 | 2,967 | 9.6 |
| *Seasonally adjusted. 1 Number of banks reporting land values. 2 Prices are dollars per acre, not adjusted for inflation. 3 Not adjusted for inflation and calculated using responses only from those banks reporting in both the past and current quarter. n.a.—Not published due to insufficient responses but included in totals for Texas and district. |
||||
Interest rates by loan type—third quarter 2023
| Feeder cattle | Other farm operating | Intermediate term | Long-term farm real estate | |
| Fixed (average rate, percent) | ||||
2022:Q3 | 6.80 | 6.75 | 6.66 | 6.35 |
2022:Q4 | 7.97 | 8.00 | 7.87 | 7.47 |
2023:Q1 | 8.57 | 8.56 | 8.44 | 8.08 |
2023:Q2 | 9.16 | 9.14 | 8.88 | 8.41 |
2023:Q3 | 9.26 | 9.22 | 8.98 | 8.66 |
| Variable (average rate, percent) | ||||
2022:Q3 | 6.72 | 6.60 | 6.41 | 6.19 |
2022:Q4 | 8.07 | 8.04 | 7.92 | 7.51 |
2023:Q1 | 8.79 | 8.75 | 8.57 | 8.21 |
2023:Q2 | 9.28 | 9.31 | 9.00 | 8.59 |
2023:Q3 | 9.39 | 9.38 | 9.09 | 8.83 |
For More Information
Questions regarding the Agricultural Survey can be addressed to Jesus Cañas at Jesus.Canas@dal.frb.org.