Agricultural Survey

Survey highlights
Bankers responding to the fourth-quarter survey reported overall weaker conditions across most regions of the Eleventh District. Extremely dry conditions continue to put a strain on agricultural production. Due to low yields, farmers relied on crop insurance to pay back loans.
“Crop yields were considerably lower than normal due to drought and excessive heat throughout the summer,” replied one survey participant. “Commodity input prices have moderated some but continue to squeeze margins,” stated another. Many participants noted the necessity of crop insurance; one respondent said, “The importance of crop insurance cannot be overstated.”
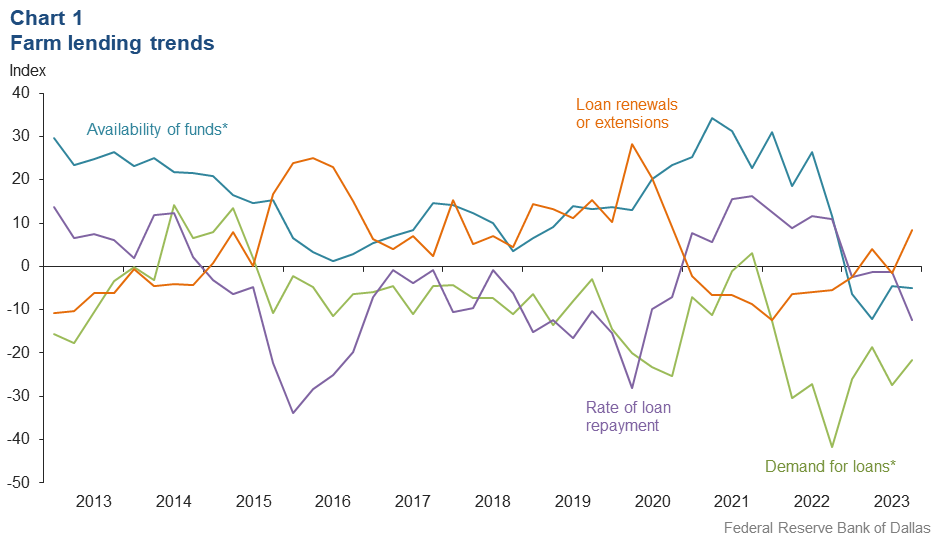
Demand for agricultural loans decreased in the fourth quarter for the eighth straight quarter. Loan renewals or extensions picked back up after falling in the previous quarter. The rate of loan repayment declined at the fastest pace since 2019. Except for operating loans, loan volume was down for all remaining categories compared with a year ago (Chart 1).
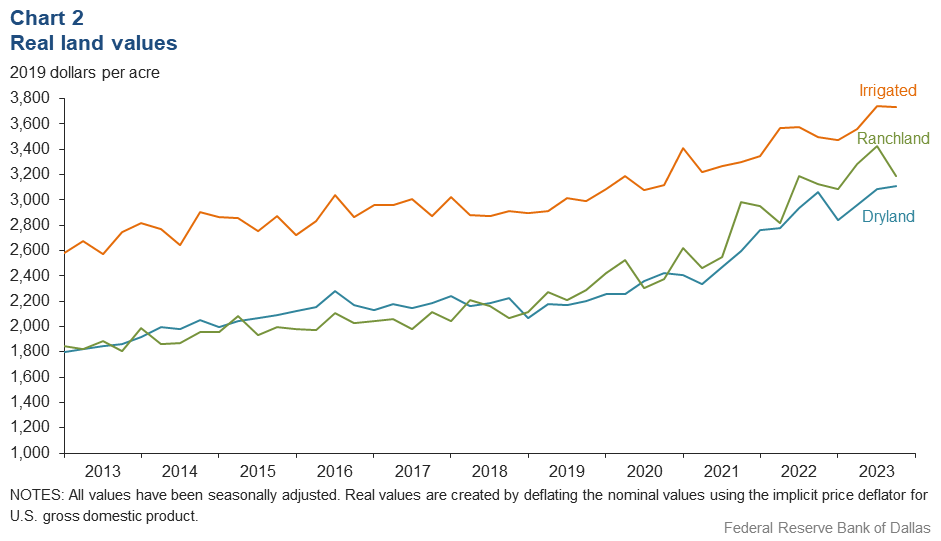
Dryland values increased slightly this quarter, while values for irrigated land and ranchland declined (Chart 2). In the fourth quarter of 2023, ranchland, irrigated cropland and dryland values rose at least 7 percent year over year in Texas, with dryland seeing the smallest increase (Table 1).
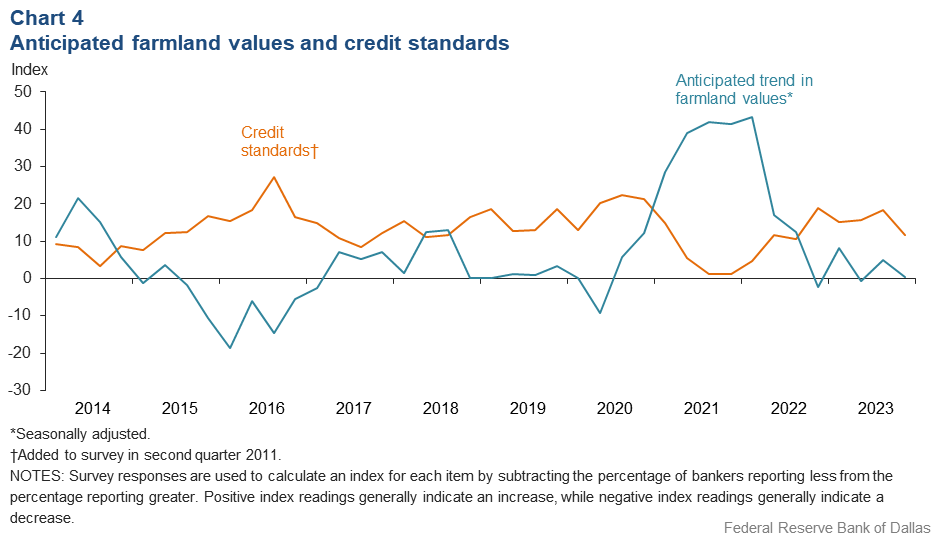
The anticipated trend in the farmland values index dropped close to zero, suggesting respondents expect farmland values to remain flat. The credit standards index was positive, indicating a tightening of standards on net, but at a slower pace than the third quarter (Chart 4).
Next release: March 25, 2024
Agricultural Survey is compiled from a survey of Eleventh District agricultural bankers, and data have been seasonally adjusted as necessary. Data were collected December 5-13, and 75 bankers responded to the survey.
Quarterly comments

District bankers were asked for additional comments concerning agricultural land values and credit conditions. These comments have been edited for publication.
- Agricultural profitability in 2023 will vary greatly among producers. Yields were much more dependent upon weather. More specifically, those that did not receive hail damage yielded pretty well. Prices received also are widely spread. Those that marketed portions of their crops early were the clear winners. Those that simply sold across the scale left quite a bit of money on the table. Wheat pasture potential is the best it has been in years, but we need another good rain to get the dryland tied down. Salvage prices on cull cows is high enough to keep aggressive culling in play this fall, and we are not seeing any real heifer retention yet, so it doesn’t look like we will be rebuilding the depleted cow herd in our area.
- There are dry conditions presently, and we are in need of rain. Wheat planting conditions were above average at the time of planting.
- The importance of crop insurance cannot be overstated. Without both multi-peril insurance and the stacked income protection plan (STAX), many farmers would not be able to pay operating loans in full. Prices have definitely not stayed up with input cost.
- Dry conditions have limited irrigated wheat pasture. We have very little dryland wheat pasture or volunteer wheat. Our area needs winter moisture to start building a profile for next spring’s crops.
- All crops are great disappointments after we had good moisture and prospects up to early August. After extreme heat, winds and a lack of rain during the months of June and July, dryland crops completely shut down and irrigated crops were greatly affected. It appears at this time dryland crops will be at 20 percent of normal production and irrigated crops will be at 55 percent of normal. Crop insurance and STAX government payments will be a major factor in repaying farm loans again this year.
- Another crop failure this cycle for our county. Crop insurance was down and inputs through planting increased. After insurance proceeds, most producers were at breakeven or lost $10-$20 per acre.
- Harvest is 90 percent complete. Crop yields were considerably lower than normal due to drought and excessive heat throughout the summer. Winter grazing and cover crops are in need of moisture soon to survive. The 2023 crop year has been a year of high input and supply costs and limited income due to lower prices and lower yields. The cow-calf producer is the only one seeming to do well because of the unprecedented high prices for calves.
- The drought conditions of late have played a significant role in the decline of production across all commodities in our region. This coupled with the declining export caused by the strength of the U.S. dollar and Brazil’s increased crop yields of late have caused the commodity market to take a hit as well. We are hoping to be entering into an EL Niño weather pattern soon as many weather experts believe, which will help our commodity yields in this region. The cattle market has continued to show strength, and so our customers have been diversifying into cattle which has improved their cash flow.
- Some interest rate reductions would be really good; our cost of funds is starting to hurt.
- There have not been many real estate transactions lately.
- Most ag real estate sales are for recreational purposes, with sales prices remaining stable. Some moisture has been received, though grass is dry and short for the most part. Beneficial weed growth has been good as a result of the moisture. Calf, lamb and kid goat prices remain very good, especially considering the recent dry conditions that occurred earlier in the year. Decisions on retaining breeding livestock remain in play. Hunting income remains very important to most ranchers.
- We’ve had very dry climate conditions. We need winter moisture in order to jump-start spring ground moisture levels. Commodity input prices have moderated some but continue to squeeze margins. Cattle prices have come off since late summer and early fall. Forward contracted calves did well; non-contracted felt the impact. The dairy industry continues to struggle with higher break-even levels because of elevated commodity prices. There were multiple dairy liquidations in 2023, and we anticipate more in 2024.
- Cost of funds is 2.35 percent, cost of interest-bearing funds is 3.66 percent, cost of deposits is 2.36 percent (excludes borrowings).
Historical data
Historical data can be downloaded dating back to first quarter 2000.
Charts
Farm lending trends
What changes occurred in non-real-estate farm loans at your bank in the past three months compared with a year earlier?
| Index | Percent reporting, Q4 | ||||
| 2023:Q3 | 2023:Q4 | Greater | Same | Less | |
Demand for loans* | –27.5 | –21.7 | 3.8 | 70.7 | 25.5 |
Availability of funds* | –4.6 | –4.9 | 5.2 | 84.7 | 10.1 |
Rate of loan repayment | –1.4 | –12.3 | 1.4 | 84.9 | 13.7 |
Loan renewals or extensions | –1.5 | 8.3 | 12.5 | 83.3 | 4.2 |
| *Seasonally adjusted. | |||||

What changes occurred in the volume of farm loans made by your bank in the past three months compared with a year earlier?
| Index | Percent reporting, Q4 | ||||
| 2023:Q3 | 2023:Q4 | Greater | Same | Less | |
Non–real–estate farm loans | –24.3 | –21.1 | 9.9 | 59.2 | 31.0 |
Feeder cattle loans* | –19.0 | –8.4 | 15.6 | 60.4 | 24.0 |
Dairy loans* | –24.0 | –16.2 | 0.0 | 83.8 | 16.2 |
Crop storage loans* | –24.3 | –19.4 | 4.8 | 71.0 | 24.2 |
Operating loans | –7.4 | 11.3 | 23.9 | 63.4 | 12.7 |
Farm machinery loans* | –27.4 | –24.2 | 6.4 | 63.0 | 30.6 |
Farm real estate loans* | –35.3 | –21.5 | 8.5 | 61.5 | 30.0 |
| *Seasonally adjusted. NOTES: Survey responses are used to calculate an index for each item by subtracting the percentage of bankers reporting less from the percentage reporting greater. Positive index readings generally indicate an increase, while negative index readings generally indicate a decrease. |
|||||
Real land values

Real cash rents

Anticipated farmland values and credit standards
What trend in farmland values do you expect in your area in the next three months?
| Index | Percent reporting, Q4 | ||||
| 2023:Q3 | 2023:Q4 | Up | Same | Down | |
| Anticipated trend in farmland values* | 4.9 | 0.5 | 10.3 | 79.9 | 9.8 |
| *Seasonally adjusted. | |||||
What change occurred in credit standards for agricultural loans at your bank in the past three months compared with a year earlier?
| 2023:Q3 | 2023:Q4 | Tightened | Same | Loosened | |
| Credit standards | 18.3 | 11.6 | 13.0 | 85.5 | 1.5 |

Tables
Rural real estate values—fourth quarter 2023
| Banks1 | Average value2 | Percent change in value from previous year3 | ||
Cropland–Dryland | ||||
District* | 59 | 3,258 | 6.7 | |
Texas* | 49 | 3,341 | 7.4 | |
1 | Northern High Plains | 10 | 1,245 | 16.0 |
2 | Southern High Plains | 7 | 1,186 | 6.6 |
3 | Northern Low Plains* | n.a. | n.a. | n.a. |
4 | Southern Low Plains* | 4 | 2,222 | –1.6 |
5 | Cross Timbers | n.a. | n.a. | n.a. |
6 | North Central Texas | 4 | 5,250 | –18.0 |
7 | East Texas* | 3 | 5,870 | 75.0 |
8 | Central Texas | 8 | 8,906 | 7.6 |
9 | Coastal Texas | 3 | 2,800 | 10.2 |
10 | South Texas | n.a. | n.a. | n.a. |
11 | Trans–Pecos and Edwards Plateau | 5 | 4,320 | 0.0 |
12 | Southern New Mexico | 4 | 600 | –22.5 |
13 | Northern Louisiana | 6 | 3,717 | –2.6 |
Cropland–Irrigated | ||||
District* | 50 | 3,916 | 12.9 | |
Texas* | 39 | 3,408 | 17.8 | |
1 | Northern High Plains | 10 | 3,030 | 26.1 |
2 | Southern High Plains | 7 | 2,321 | 6.6 |
3 | Northern Low Plains* | n.a. | n.a. | n.a. |
4 | Southern Low Plains | 3 | 2,667 | 4.2 |
5 | Cross Timbers | n.a. | n.a. | n.a. |
6 | North Central Texas | n.a. | n.a. | n.a. |
7 | East Texas | 3 | 7,000 | 61.6 |
8 | Central Texas | 5 | 10,500 | 23.9 |
9 | Coastal Texas | n.a. | n.a. | n.a. |
10 | South Texas | n.a. | n.a. | n.a. |
11 | Trans–Pecos and Edwards Plateau | 4 | 4,775 | 2.0 |
12 | Southern New Mexico | 5 | 7,052 | 8.1 |
13 | Northern Louisiana | 6 | 5,375 | –1.8 |
Ranchland | ||||
District* | 67 | 3,345 | 11.6 | |
Texas* | 56 | 3,973 | 10.6 | |
1 | Northern High Plains | 10 | 1,100 | 18.3 |
2 | Southern High Plains | 7 | 1,057 | 5.9 |
3 | Northern Low Plains | n.a. | n.a. | n.a. |
4 | Southern Low Plains* | 4 | 2,490 | 14.4 |
5 | Cross Timbers | 4 | 4,875 | 50.0 |
6 | North Central Texas | 4 | 6,125 | –19.6 |
7 | East Texas | 6 | 5,583 | 76.8 |
8 | Central Texas | 8 | 11,500 | 8.3 |
9 | Coastal Texas | 3 | 3,000 | 4.2 |
10 | South Texas | n.a. | n.a. | n.a. |
11 | Trans–Pecos and Edwards Plateau | 7 | 3,564 | 6.0 |
12 | Southern New Mexico | 5 | 630 | 48.4 |
13 | Northern Louisiana | 6 | 2,900 | 2.1 |
| *Seasonally adjusted. 1 Number of banks reporting land values. 2 Prices are dollars per acre, not adjusted for inflation. 3 Not adjusted for inflation and calculated using responses only from those banks reporting in both the past and current quarter. n.a.—Not published due to insufficient responses but included in totals for Texas and district. |
||||
Interest rates by loan type—fourth quarter 2023
| Feeder cattle | Other farm operating | Intermediate term | Long-term farm real estate | |
| Fixed (average rate, percent) | ||||
2022:Q4 | 7.97 | 8.00 | 7.87 | 7.47 |
2023:Q1 | 8.57 | 8.56 | 8.44 | 8.08 |
2023:Q2 | 9.16 | 9.14 | 8.88 | 8.41 |
2023:Q3 | 9.26 | 9.22 | 8.98 | 8.66 |
2023:Q4 | 9.43 | 9.35 | 9.23 | 8.76 |
| Variable (average rate, percent) | ||||
2022:Q4 | 8.07 | 8.04 | 7.92 | 7.51 |
2023:Q1 | 8.79 | 8.75 | 8.57 | 8.21 |
2023:Q2 | 9.28 | 9.31 | 9.00 | 8.59 |
2023:Q3 | 9.39 | 9.38 | 9.09 | 8.83 |
2023:Q4 | 9.53 | 9.48 | 9.32 | 8.89 |
For More Information
Questions regarding the Agricultural Survey can be addressed to Mariam Yousuf at Mariam.Yousuf@dal.frb.org.