Banking Conditions Survey

For this survey, Eleventh District banking executives were asked supplemental questions on outlook concerns, deposits and commercial real estate lending. Read the special questions results.
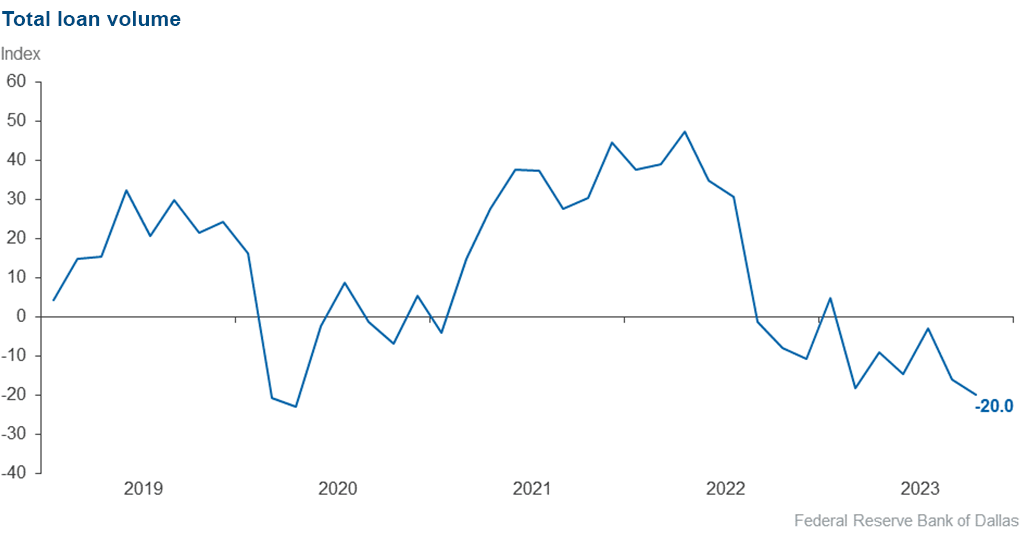
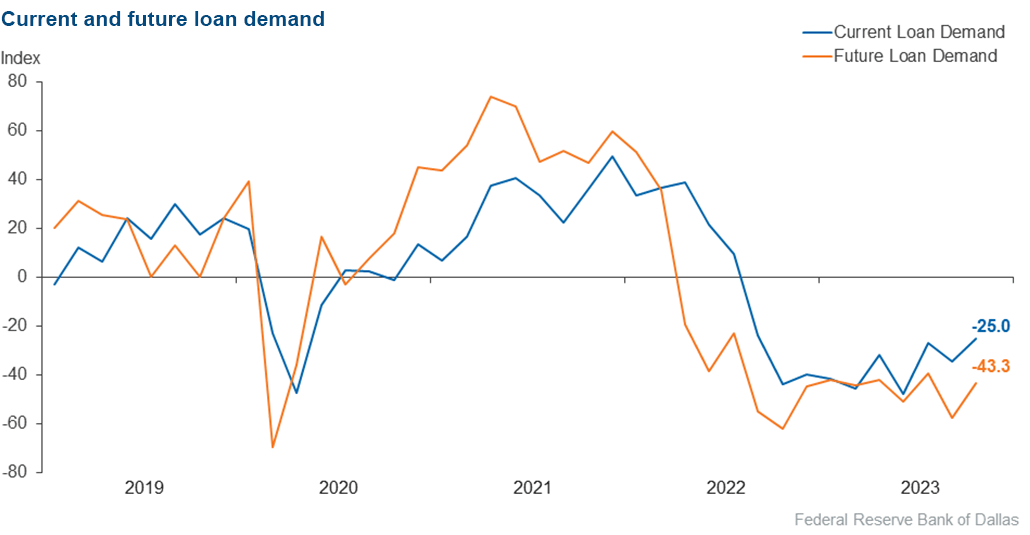
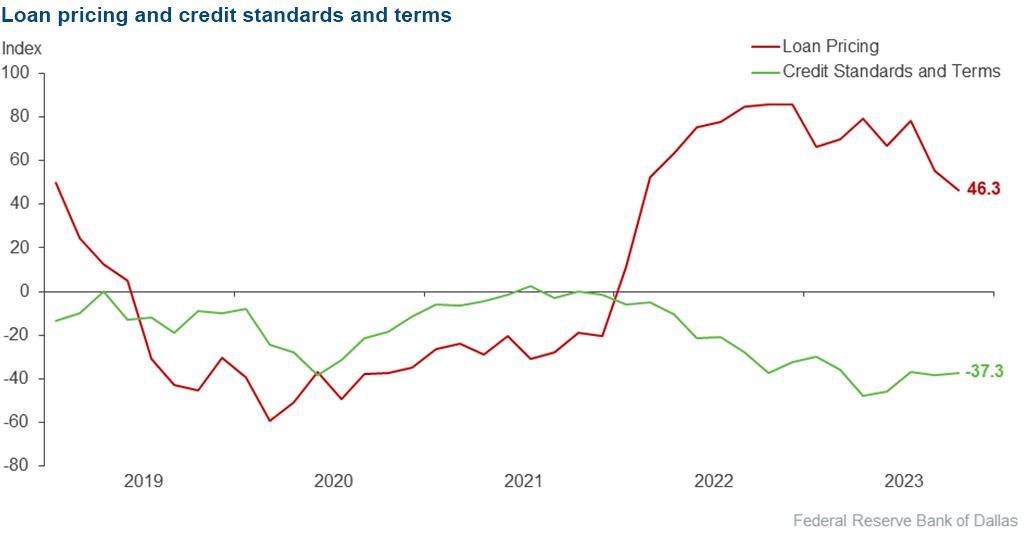
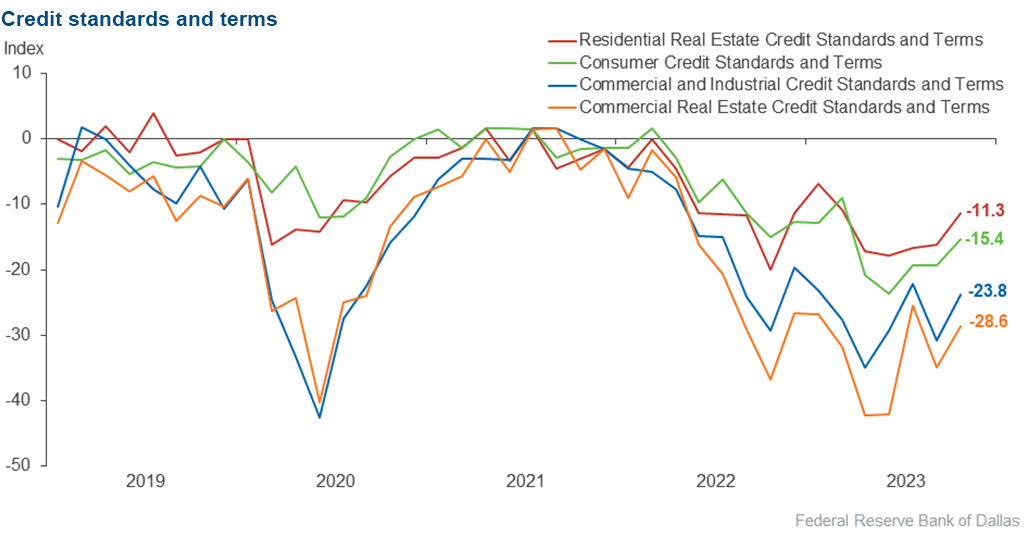
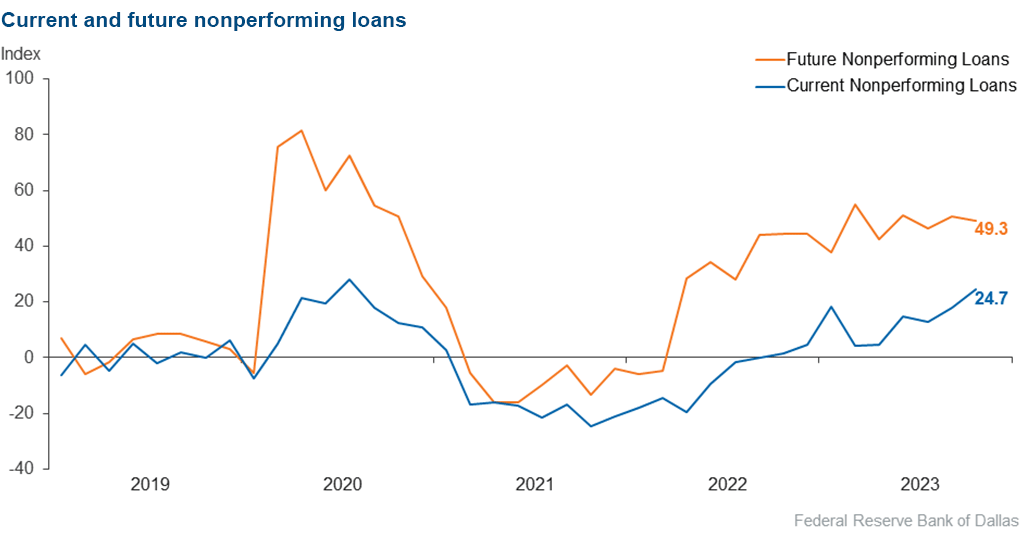
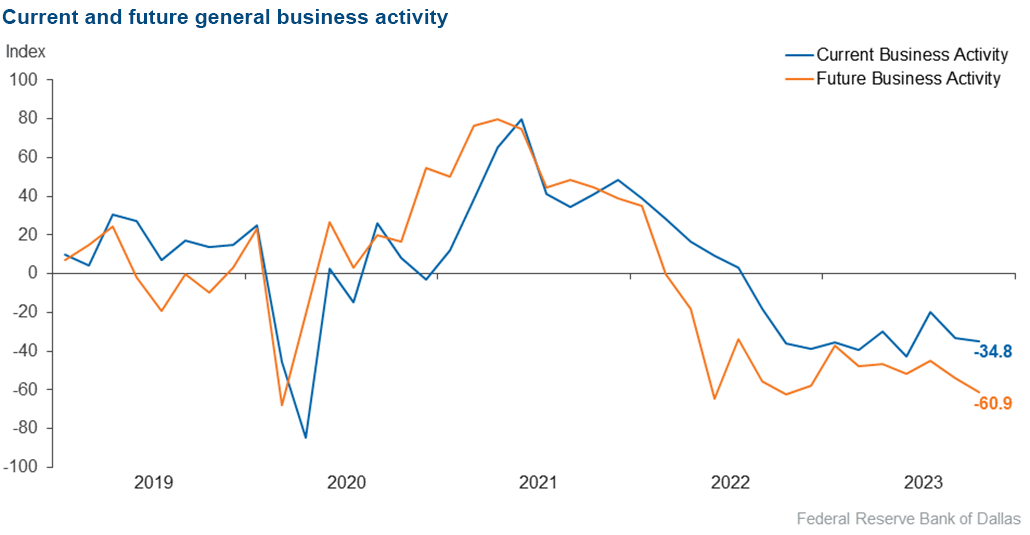
Credit standards continued to tighten, and loan pricing continued to rise at an above-average pace this period. Loan demand has been declining for over a year, though the pace of decline has eased. Overall loan volume declined at a faster pace over the past six weeks, led by a sharp decline in residential real estate lending. Driven by a marked increase in consumer loan delinquency, overall loan nonperformance rose at its highest rate since 2020. Bankers remained pessimistic, with expectations of further increases in loan nonperformance, declining loan demand and worsening business activity over the next six months.
Next release: January 2, 2024
Data were collected October 31–November 8, and 70 financial institutions responded to the survey. The Federal Reserve Bank of Dallas conducts the Banking Conditions Survey twice each quarter to obtain a timely assessment of activity at banks and credit unions headquartered in the Eleventh Federal Reserve District. CEOs or senior loan officers of financial institutions report on how conditions have changed for indicators such as loan volume, nonperforming loans and loan pricing. Respondents are also asked to report on their banking outlook and their evaluation of general business activity.
Survey responses are used to calculate an index for each indicator. Each index is calculated by subtracting the percentage of respondents reporting a decrease (or tightening) from the percentage reporting an increase (or easing). When the share of respondents reporting an increase exceeds the share reporting a decrease, the index will be greater than zero, suggesting the indicator has increased over the prior reporting period. If the share of respondents reporting a decrease exceeds the share reporting an increase, the index will be below zero, suggesting the indicator has decreased over the prior reporting period. An index will be zero when the number of respondents reporting an increase is equal to the number reporting a decrease.
Results Summary
Historical data are available from March 2017.
| Total Loans: Over the past six weeks, how have the following changed? | |||||
| Indicator | Current Index | Previous Index | % Reporting Increase | % Reporting No Change | % Reporting Decrease |
Loan volume | –20.0 | –15.9 | 24.3 | 31.4 | 44.3 |
Loan demand | –25.0 | –34.4 | 16.2 | 42.6 | 41.2 |
Nonperforming loans | 24.7 | 17.9 | 29.0 | 66.7 | 4.3 |
Loan pricing | 46.3 | 55.2 | 47.8 | 50.7 | 1.5 |
| Indicator | Current Index | Previous Index | % Reporting Eased | % Reporting No Change | % Reporting Tightened |
Credit standards and terms | –37.3 | –38.2 | 0.0 | 62.7 | 37.3 |
| Commercial and Industrial Loans: Over the past six weeks, how have the following changed? | |||||
| Indicator | Current Index | Previous Index | % Reporting Increase | % Reporting No Change | % Reporting Decrease |
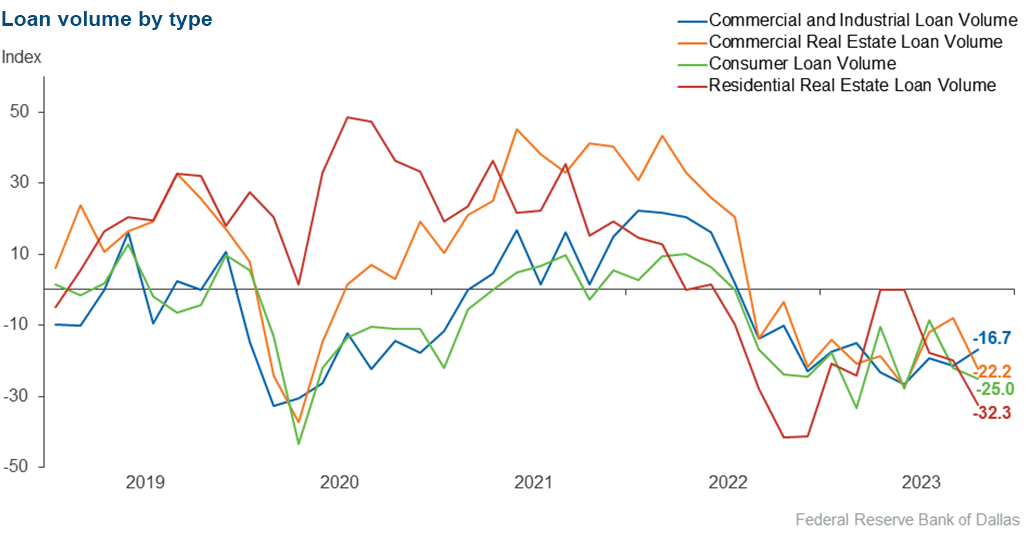
Loan volume | –16.7 | –21.5 | 9.1 | 65.2 | 25.8 |
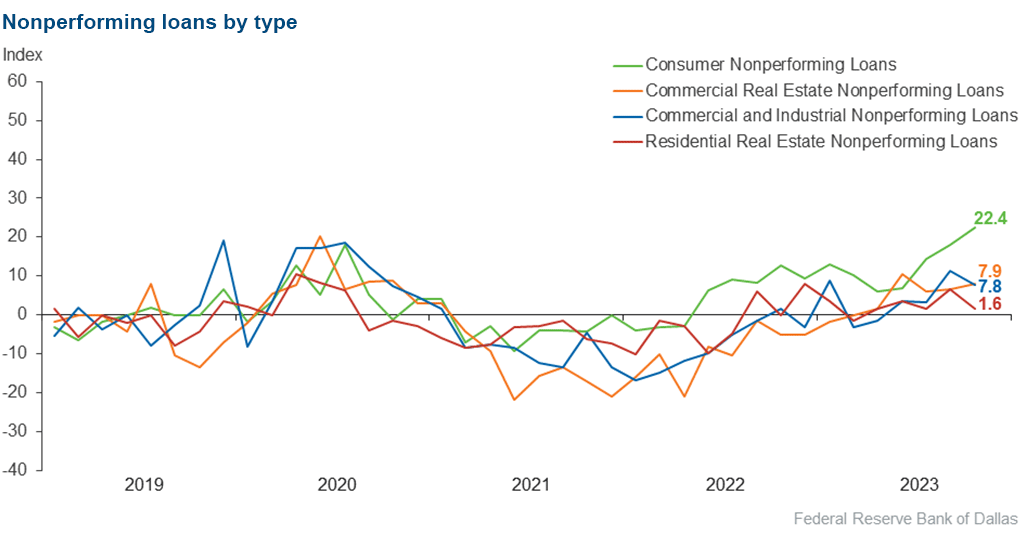
Nonperforming loans | 7.8 | 11.3 | 9.4 | 89.1 | 1.6 |
| Indicator | Current Index | Previous Index | % Reporting Eased | % Reporting No Change | % Reporting Tightened |
Credit standards and terms | –23.8 | –30.7 | 1.6 | 73.0 | 25.4 |
| Commercial Real Estate Loans: Over the past six weeks, how have the following changed? | |||||
| Indicator | Current Index | Previous Index | % Reporting Increase | % Reporting No Change | % Reporting Decrease |
Loan volume | –22.2 | –8.0 | 17.5 | 42.9 | 39.7 |
Nonperforming loans | 7.9 | 6.5 | 9.5 | 88.9 | 1.6 |
| Indicator | Current Index | Previous Index | % Reporting Eased | % Reporting No Change | % Reporting Tightened |
Credit standards and terms | –28.6 | –35.0 | 1.6 | 68.3 | 30.2 |
| Residential Real Estate Loans: Over the past six weeks, how have the following changed? | |||||
| Indicator | Current Index | Previous Index | % Reporting Increase | % Reporting No Change | % Reporting Decrease |
Loan volume | –32.3 | –20.0 | 10.8 | 46.2 | 43.1 |
Nonperforming loans | 1.6 | 6.5 | 4.7 | 92.2 | 3.1 |
| Indicator | Current Index | Previous Index | % Reporting Eased | % Reporting No Change | % Reporting Tightened |
Credit standards and terms | –11.3 | –16.1 | 0.0 | 88.7 | 11.3 |
| Consumer Loans: Over the past six weeks, how have the following changed? | |||||
| Indicator | Current Index | Previous Index | % Reporting Increase | % Reporting No Change | % Reporting Decrease |
Loan volume | –25.0 | –22.1 | 13.2 | 48.5 | 38.2 |
Nonperforming loans | 22.4 | 17.9 | 23.9 | 74.6 | 1.5 |
| Indicator | Current Index | Previous Index | % Reporting Eased | % Reporting No Change | % Reporting Tightened |
Credit standards and terms | –15.4 | –19.4 | 0.0 | 84.6 | 15.4 |
| Banking Outlook: What is your expectation for the following items six months from now? | |||||
| Indicator | Current Index | Previous Index | % Reporting Increase | % Reporting No Change | % Reporting Decrease |
Total loan demand | –43.3 | –57.4 | 14.9 | 26.9 | 58.2 |
Nonperforming loans | 49.3 | 50.7 | 53.6 | 42.0 | 4.3 |
| General Business Activity: What is your evaluation of the level of activity? | |||||
| Indicator | Current Index | Previous Index | % Reporting Better | % Reporting No Change | % Reporting Worse |
Over the past six weeks | –34.8 | –33.3 | 7.2 | 50.7 | 42.0 |
Six months from now | –60.9 | –53.7 | 7.2 | 24.6 | 68.1 |
Respondents were given an opportunity to comment on any issues that may be affecting their business.
These comments are from respondents’ completed surveys and have been edited for publication.
- The macro impacts of higher-for-longer interest rates are slamming the brakes on our economy.
- The overhang from higher rates is hurting smaller businesses more than larger ones. We are watching the unemployment rate closely as the key indicator for consumer credit quality.
- The only industry that has worked in the U.S. over the last 20 years has been the real estate sector. [And now] high rates have killed this industry.
- Cash flows from the bond portfolio are not enough to cover loan growth and customer deposit outflows. The level of bond unrealized losses remains a deterrent to selling bonds for liquidity. Funding continues to be a challenge and expensive with higher customer deposit costs and brokered deposit rates.
- Loans inside the bank’s portfolio are beginning to reprice, and the full effect of the rate increases is being felt.
- The level of uncertainty continues to increase with increasing regulatory burden benefiting the largest banks and merchants while adversely impacting consumers and community financial institutions. Interest rate and geopolitical challenges are adding to the difficulties of forecasting for 2024 planning purposes, in addition to the possibility of another government shutdown weeks way.
- The residential mortgage market has changed to a buyer’s market. Realtors and online lenders are now pushing seller-paid discount points to buy down loan rates. We are looking at residential appraisals very closely to make sure that appraisers are noting this change in market conditions and the effect on actual values of properties being sold with seller-paid concessions.
- Continued higher interest rates make business models harder to work, particularly if they have no relief on the values financed or the revenues received. The Federal Reserve needs to stop raising rates before it's too late.
Historical data can be downloaded dating back to March 2017. For the definitions, see data definitions.
NOTE: The following series were discontinued in May 2020: volume of core deposits, cost of funds, non-interest income and net interest margin.
Questions regarding the Banking Conditions Survey can be addressed to Emily Kerr at emily.kerr@dal.frb.org.
Sign up for our email alert to be automatically notified as soon as the latest Banking Conditions Survey is released on the web.