Banking Conditions Survey

For this survey, Eleventh District banking executives were asked supplemental questions on deposits, credit standards, commercial real estate lending and liquidity. Read the special questions results.
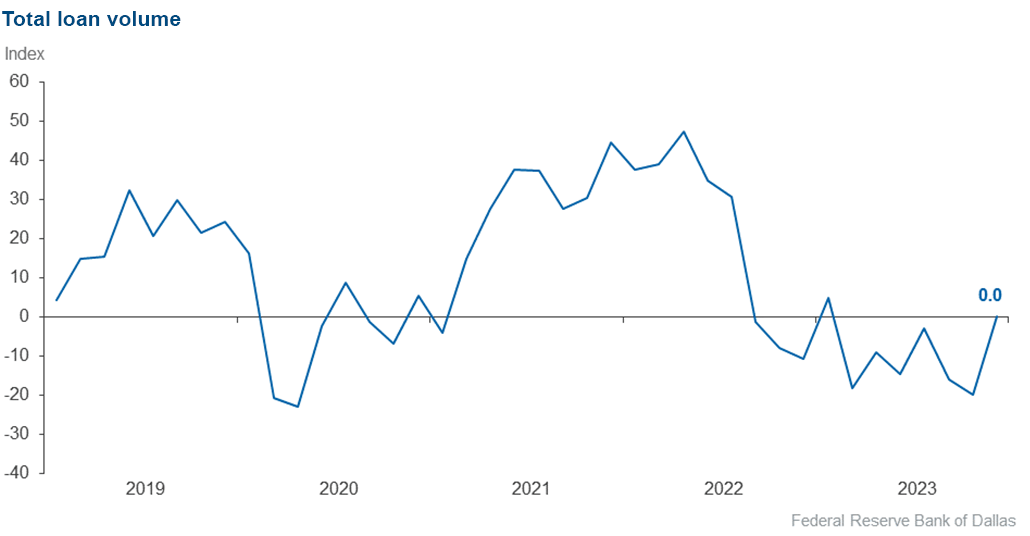
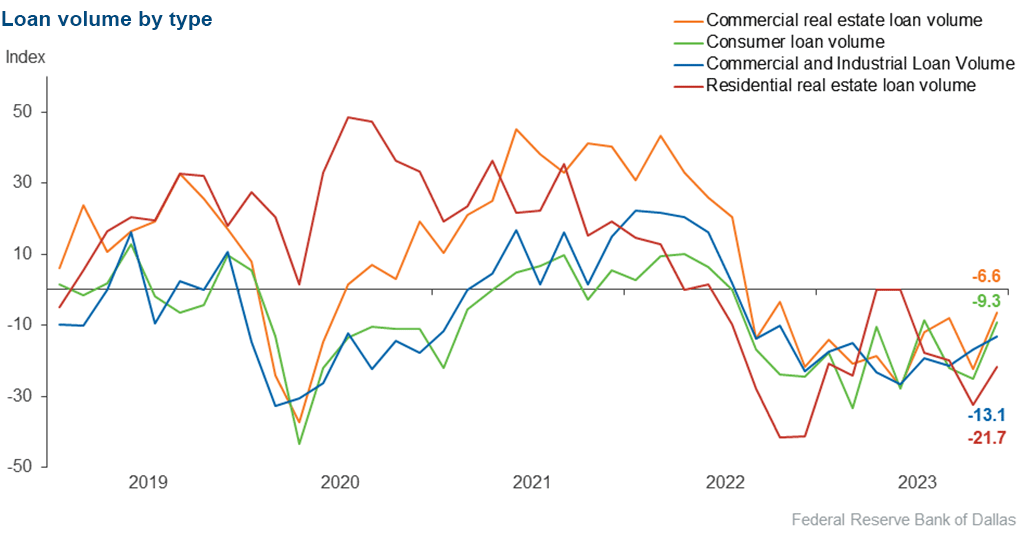
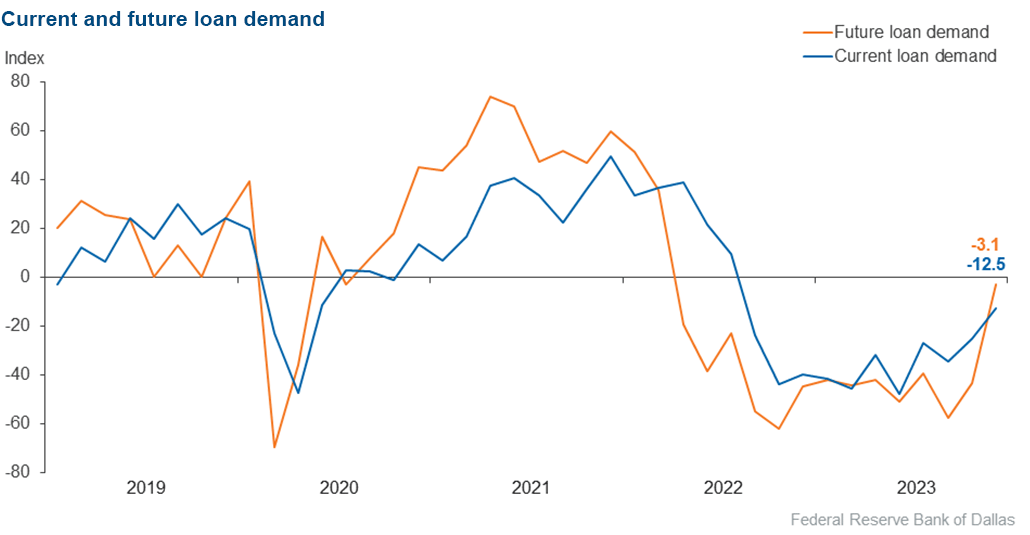
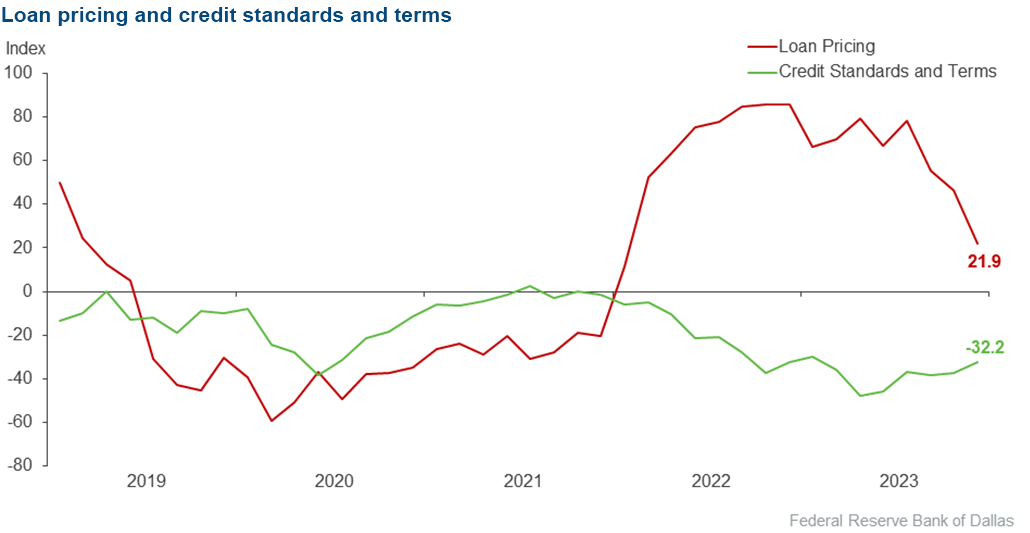
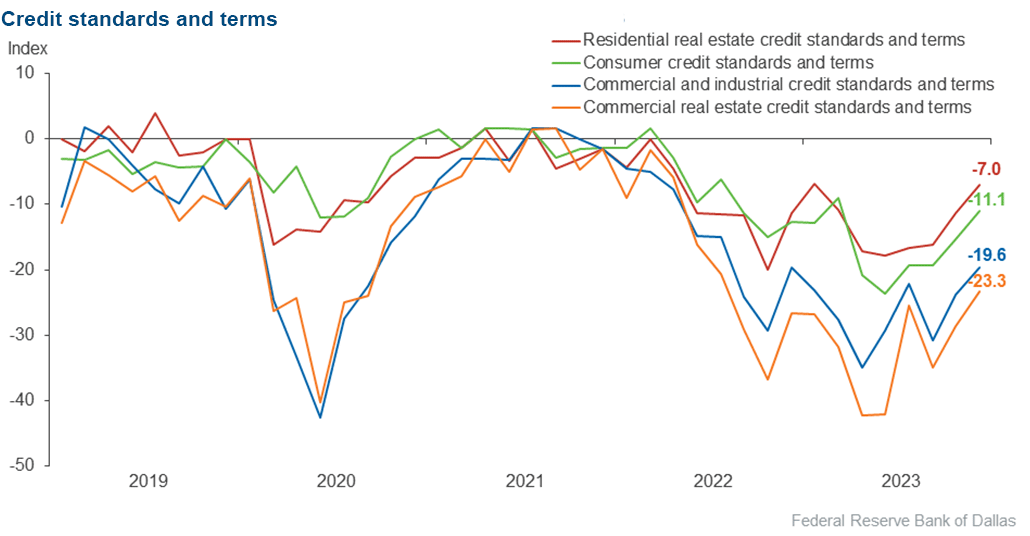
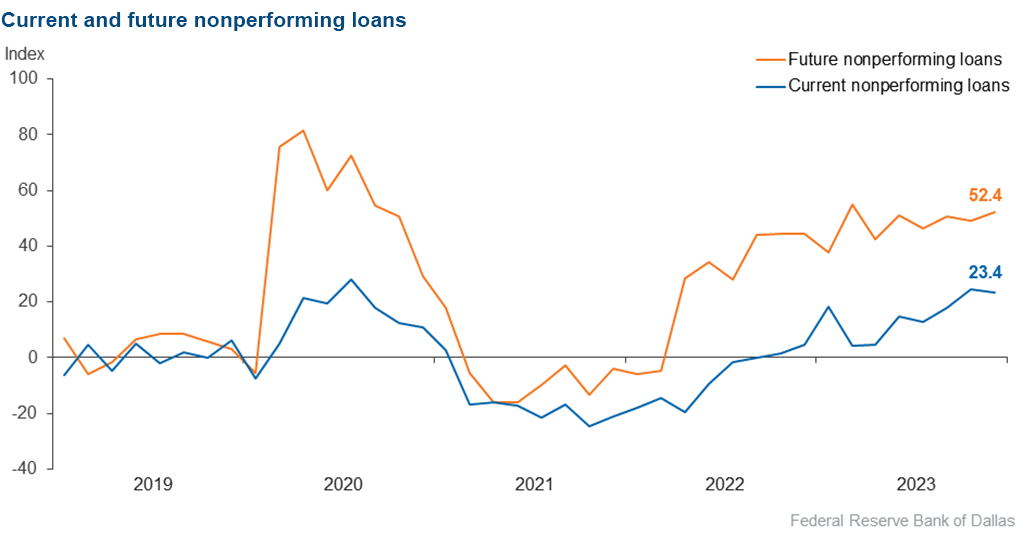
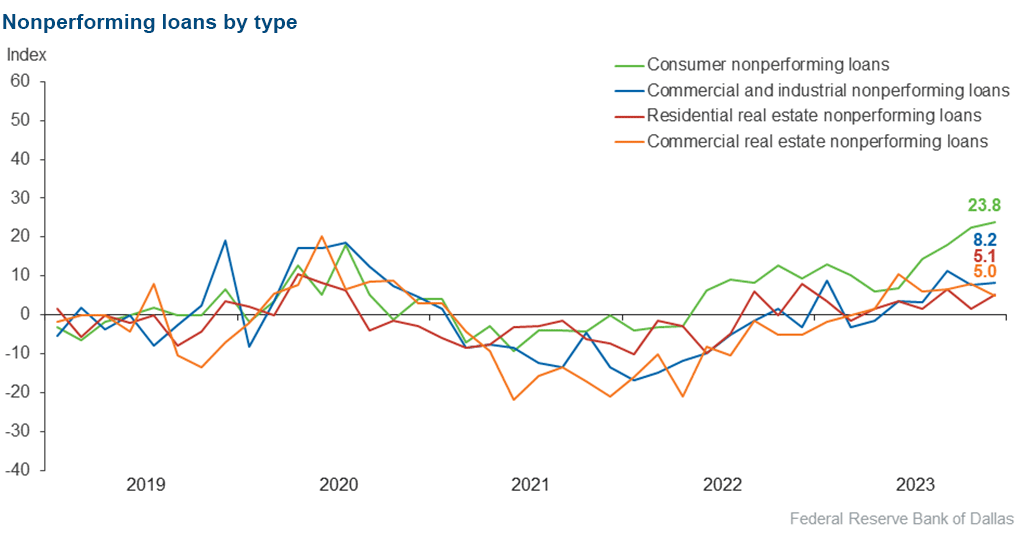
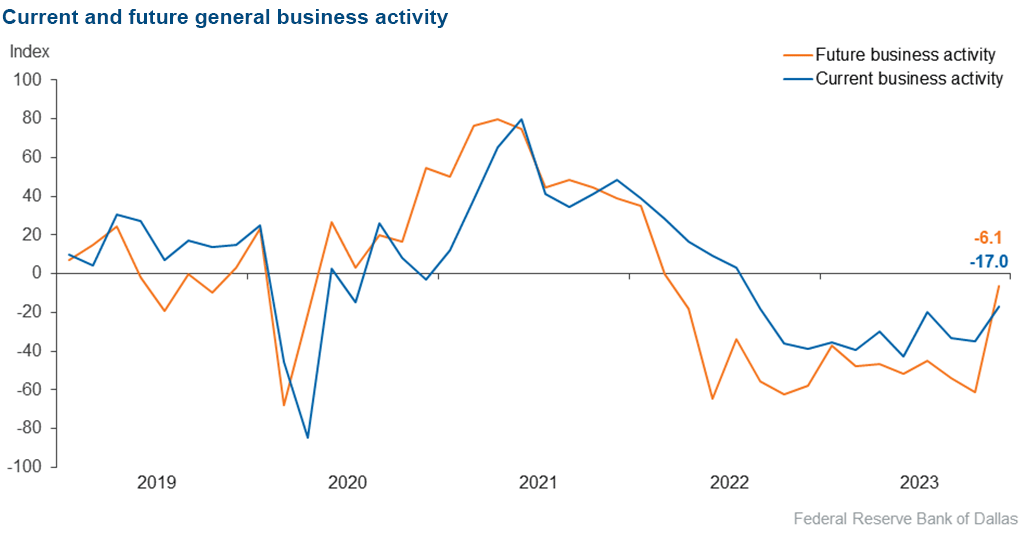
Credit standards tightened at a slower pace across all loan types. Loan demand continued to decline, though at the slowest pace since the end of 2022. The decline in loan volume eased across all loan types, with the greatest stabilization in commercial real estate and consumer loans. Loan nonperformance rose again, driven by consumer loans. Loan pricing continued to increase but at a slower rate. Although bankers remain pessimistic and expect future business activity and loan demand to decline, the slowdown is anticipated to be milder than prior expectations. Survey respondents do, however, expect loan nonperformance to continue increasing at a slightly faster rate over the next six months.
Next release: February 20, 2024
Data were collected December 19–27, and 65 financial institutions responded to the survey. The Federal Reserve Bank of Dallas conducts the Banking Conditions Survey twice each quarter to obtain a timely assessment of activity at banks and credit unions headquartered in the Eleventh Federal Reserve District. CEOs or senior loan officers of financial institutions report on how conditions have changed for indicators such as loan volume, nonperforming loans and loan pricing. Respondents are also asked to report on their banking outlook and their evaluation of general business activity.
Survey responses are used to calculate an index for each indicator. Each index is calculated by subtracting the percentage of respondents reporting a decrease (or tightening) from the percentage reporting an increase (or easing). When the share of respondents reporting an increase exceeds the share reporting a decrease, the index will be greater than zero, suggesting the indicator has increased over the prior reporting period. If the share of respondents reporting a decrease exceeds the share reporting an increase, the index will be below zero, suggesting the indicator has decreased over the prior reporting period. An index will be zero when the number of respondents reporting an increase is equal to the number reporting a decrease.
Results Summary
Historical data are available from March 2017.
| Total Loans: Over the past six weeks, how have the following changed? | |||||
| Indicator | Current Index | Previous Index | % Reporting Increase | % Reporting No Change | % Reporting Decrease |
Loan volume | 0.0 | –20.0 | 32.3 | 35.4 | 32.3 |
Loan demand | –12.5 | –25.0 | 23.4 | 40.6 | 35.9 |
Nonperforming loans | 23.4 | 24.7 | 32.8 | 57.8 | 9.4 |
Loan pricing | 21.9 | 46.3 | 26.6 | 68.8 | 4.7 |
| Indicator | Current Index | Previous Index | % Reporting Eased | % Reporting No Change | % Reporting Tightened |
Credit standards and terms | –32.2 | –37.3 | 0.0 | 67.8 | 32.2 |
| Commercial and Industrial Loans: Over the past six weeks, how have the following changed? | |||||
| Indicator | Current Index | Previous Index | % Reporting Increase | % Reporting No Change | % Reporting Decrease |
Loan volume | –13.1 | –16.7 | 11.5 | 63.9 | 24.6 |
Nonperforming loans | 8.2 | 7.8 | 14.8 | 78.7 | 6.6 |
| Indicator | Current Index | Previous Index | % Reporting Eased | % Reporting No Change | % Reporting Tightened |
Credit standards and terms | –19.6 | –23.8 | 0.0 | 80.4 | 19.6 |
| Commercial Real Estate Loans: Over the past six weeks, how have the following changed? | |||||
| Indicator | Current Index | Previous Index | % Reporting Increase | % Reporting No Change | % Reporting Decrease |
Loan volume | –6.6 | –22.2 | 21.3 | 50.8 | 27.9 |
Nonperforming loans | 5.0 | 7.9 | 10.0 | 85.0 | 5.0 |
| Indicator | Current Index | Previous Index | % Reporting Eased | % Reporting No Change | % Reporting Tightened |
Credit standards and terms | –23.3 | –28.6 | 0.0 | 76.7 | 23.3 |
| Residential Real Estate Loans: Over the past six weeks, how have the following changed? | |||||
| Indicator | Current Index | Previous Index | % Reporting Increase | % Reporting No Change | % Reporting Decrease |
Loan volume | –21.7 | –32.3 | 13.3 | 51.7 | 35.0 |
Nonperforming loans | 5.1 | 1.6 | 10.2 | 84.7 | 5.1 |
| Indicator | Current Index | Previous Index | % Reporting Eased | % Reporting No Change | % Reporting Tightened |
Credit standards and terms | –7.0 | –11.3 | 0.0 | 93.0 | 7.0 |
| Consumer Loans: Over the past six weeks, how have the following changed? | |||||
| Indicator | Current Index | Previous Index | % Reporting Increase | % Reporting No Change | % Reporting Decrease |
Loan volume | –9.3 | –25.0 | 18.8 | 53.1 | 28.1 |
Nonperforming loans | 23.8 | 22.4 | 27.0 | 69.8 | 3.2 |
| Indicator | Current Index | Previous Index | % Reporting Eased | % Reporting No Change | % Reporting Tightened |
Credit standards and terms | –11.1 | –15.4 | 0.0 | 88.9 | 11.1 |
| Banking Outlook: What is your expectation for the following items six months from now? | |||||
| Indicator | Current Index | Previous Index | % Reporting Increase | % Reporting No Change | % Reporting Decrease |
Total loan demand | –3.1 | –43.3 | 34.4 | 28.1 | 37.5 |
Nonperforming loans | 52.4 | 49.3 | 55.6 | 41.3 | 3.2 |
| General Business Activity: What is your evaluation of the level of activity? | |||||
| Indicator | Current Index | Previous Index | % Reporting Better | % Reporting No Change | % Reporting Worse |
Over the past six weeks | –17.0 | –34.8 | 13.8 | 55.4 | 30.8 |
Six months from now | –6.1 | –60.9 | 27.7 | 38.5 | 33.8 |
Respondents were given an opportunity to comment on any issues that may be affecting their business.
These comments are from respondents’ completed surveys and have been edited for publication.
- Commercial real estate loans are renewing at higher rates when balloon [loans] mature.
- There may be an explanation for why the U.S. economy has been remarkably resilient, despite high inflation and interest rates. Maybe it isn’t so resilient after all, as reflected in both business and consumer sentiment and political polls. The GDP-GDI divergence has reached extreme levels. The total level of gross domestic income is 2.5% below that of gross domestic product, the largest gap since 1993. Could recent GDP data be overstating the true extent of the U.S. economic growth?
- We continue to experience a heightened level of uncertainty from an economic standpoint. What hasn't changed is the unprecedented increase in regulatory activity including regulation by press release at the federal level. Thus the situation is placing an unsustainable burden on community financial institutions and a disproportional burden versus under- and unregulated fintech and non-traditional sources of credit.
- Loan demand should increase if the Federal Reserve lowers interest rates.
- [2024 is an] election year and [we will have to face] all that encompasses. With consumers aware that the Federal Reserve intends to lower rates in 2024, how soon will they be willing to borrow, or will they postpone loans for a little while longer? Finally, rate increases incurred on deposits in 2023 will result in higher cost of funds in 2023.
- The cost of goods and services is outpacing the cost-of-living adjustments, and this is going to be a major concern as we move into 2024.
- Rate pressures seem to have eased with anticipation of Federal Reserve [interest rate] cuts. Deposit rates seem to have leveled out, and we will see who has first mover's status in lowering rates versus consumer expectations. That may be the '24 battle.
Historical data can be downloaded dating back to March 2017. For the definitions, see data definitions.
NOTE: The following series were discontinued in May 2020: volume of core deposits, cost of funds, non-interest income and net interest margin.
Questions regarding the Banking Conditions Survey can be addressed to Emily Kerr at emily.kerr@dal.frb.org.
Sign up for our email alert to be automatically notified as soon as the latest Banking Conditions Survey is released on the web.