Texas Manufacturing Outlook Survey

Texas manufacturing activity flat in December
For this month’s survey, Texas business executives were asked supplemental questions on wages, prices and outlook concerns. Results for these questions from the Texas Manufacturing Outlook Survey, Texas Service Sector Outlook Survey and Texas Retail Outlook Survey have been released together. Read the special questions results.
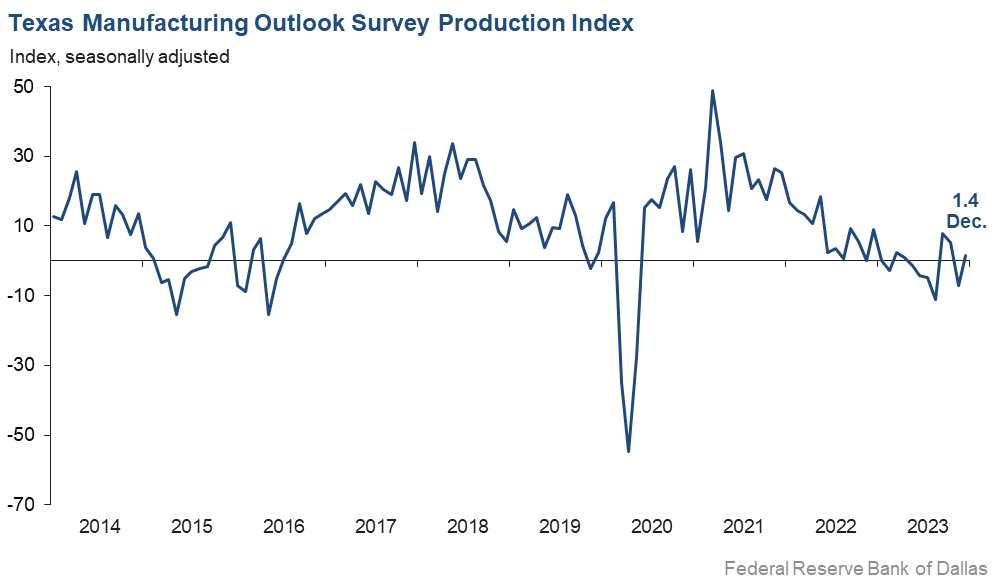
Texas factory activity stabilized in December after contracting in November, according to business executives responding to the Texas Manufacturing Outlook Survey. The production index, a key measure of state manufacturing conditions, pushed up nine points to 1.4, with the near-zero reading indicating little change in manufacturing output from November.
Most other measures of manufacturing activity indicated continued contraction this month, with the exception of the capacity utilization index, which rebounded from -10.1 to 1.3. The new orders index remained negative but moved up from -20.5 to -10.9 in December. The shipments index posted a 12th consecutive negative reading but rose four points to -5.3.
Perceptions of broader business conditions continued to worsen in December, though sentiment was less negative than in recent months. The general business activity index pushed up 11 points to -9.3, and the company outlook index rose from -18.8 to -11.0. The outlook uncertainty index inched down to 18.3, roughly in line with its average reading.
Labor market measures suggested slight employment declines and stable workweeks in December. The employment index slipped seven points to -1.6, posting its first negative reading in 10 months. Sixteen percent of firms noted net hiring, while 18 percent noted net layoffs. The hours worked index came in near zero after two months of slightly negative readings.
Wage and price growth increased this month. The wages and benefits index rose from 20.0 to 25.5. The raw materials prices index moved up five points to 17.8, a reading below average and indicative of more modest cost growth than usual. The finished goods prices index rebounded from -6.2 to 6.8, its highest reading since April.
Expectations regarding future manufacturing activity remained mixed in December. The future production index was largely unchanged at 12.4, while the future general business activity index remained negative but pushed up from -13.4 to -8.7. Most other measures of future manufacturing activity remained in positive territory this month.
Next release: Monday, January 29
Data were collected Dec. 12–20, and 94 Texas manufacturers responded to the survey. The Dallas Fed conducts the Texas Manufacturing Outlook Survey monthly to obtain a timely assessment of the state’s factory activity. Firms are asked whether output, employment, orders, prices and other indicators increased, decreased or remained unchanged over the previous month.
Survey responses are used to calculate an index for each indicator. Each index is calculated by subtracting the percentage of respondents reporting a decrease from the percentage reporting an increase. When the share of firms reporting an increase exceeds the share reporting a decrease, the index will be greater than zero, suggesting the indicator has increased over the prior month. If the share of firms reporting a decrease exceeds the share reporting an increase, the index will be below zero, suggesting the indicator has decreased over the prior month. An index will be zero when the number of firms reporting an increase is equal to the number of firms reporting a decrease. Data have been seasonally adjusted as necessary.
Results summary
Historical data are available from June 2004 to the most current release month.
| Business Indicators Relating to Facilities and Products in Texas Current (versus previous month) | ||||||||
| Indicator | Dec Index | Nov Index | Change | Series Average | Trend* | % Reporting Increase | % Reporting No Change | % Reporting Decrease |
Production | 1.4 | –7.2 | +8.6 | 10.2 | 1(+) | 30.3 | 40.9 | 28.9 |
Capacity Utilization | 1.3 | –10.1 | +11.4 | 8.2 | 1(+) | 28.8 | 43.8 | 27.5 |
New Orders | –10.9 | –20.5 | +9.6 | 5.4 | 19(–) | 27.6 | 33.9 | 38.5 |
Growth Rate of Orders | –22.2 | –25.4 | +3.2 | –0.4 | 20(–) | 19.3 | 39.2 | 41.5 |
Unfilled Orders | –9.7 | –18.1 | +8.4 | –1.9 | 3(–) | 9.9 | 70.5 | 19.6 |
Shipments | –5.3 | –9.5 | +4.2 | 8.6 | 12(–) | 30.7 | 33.2 | 36.0 |
Delivery Time | –2.8 | –8.1 | +5.3 | 1.1 | 9(–) | 9.4 | 78.4 | 12.2 |
Finished Goods Inventories | –5.4 | –2.2 | –3.2 | –3.2 | 7(–) | 18.5 | 57.6 | 23.9 |
Prices Paid for Raw Materials | 17.8 | 12.6 | +5.2 | 27.4 | 44(+) | 26.4 | 65.0 | 8.6 |
Prices Received for Finished Goods | 6.8 | –6.2 | +13.0 | 8.7 | 1(+) | 14.6 | 77.6 | 7.8 |
Wages and Benefits | 25.5 | 20.0 | +5.5 | 21.2 | 44(+) | 27.6 | 70.3 | 2.1 |
Employment | –1.6 | 5.0 | –6.6 | 7.8 | 1(–) | 16.3 | 65.8 | 17.9 |
Hours Worked | 0.3 | –5.5 | +5.8 | 3.6 | 1(+) | 17.3 | 65.7 | 17.0 |
Capital Expenditures | 3.0 | 4.2 | –1.2 | 6.6 | 3(+) | 19.0 | 64.9 | 16.0 |
| General Business Conditions Current (versus previous month) | ||||||||
| Indicator | Dec Index | Nov Index | Change | Series Average | Trend** | % Reporting Improved | % Reporting No Change | % Reporting Worsened |
Company Outlook | –11.0 | –18.8 | +7.8 | 5.0 | 22(–) | 14.8 | 59.4 | 25.8 |
General Business Activity | –9.3 | –19.9 | +10.6 | 1.3 | 20(–) | 15.9 | 58.9 | 25.2 |
| Indicator | Dec Index | Nov Index | Change | Series Average | Trend* | % Reporting Increase | % Reporting No Change | % Reporting Decrease |
Outlook Uncertainty | 18.3 | 20.3 | –2.0 | 17.1 | 32(+) | 26.9 | 64.5 | 8.6 |
| Business Indicators Relating to Facilities and Products in Texas Future (six months ahead) | ||||||||
| Indicator | Dec Index | Nov Index | Change | Series Average | Trend* | % Reporting Increase | % Reporting No Change | % Reporting Decrease |
Production | 12.4 | 13.7 | –1.3 | 36.6 | 44(+) | 31.1 | 50.2 | 18.7 |
Capacity Utilization | 12.5 | 12.7 | –0.2 | 33.5 | 44(+) | 29.2 | 54.1 | 16.7 |
New Orders | 13.6 | 8.4 | +5.2 | 33.9 | 14(+) | 31.4 | 50.8 | 17.8 |
Growth Rate of Orders | 5.6 | 6.8 | –1.2 | 25.1 | 7(+) | 23.3 | 59.0 | 17.7 |
Unfilled Orders | –6.6 | –6.3 | –0.3 | 2.9 | 2(–) | 6.3 | 80.8 | 12.9 |
Shipments | 14.0 | 19.2 | –5.2 | 35.0 | 44(+) | 31.8 | 50.4 | 17.8 |
Delivery Time | –0.8 | –4.0 | +3.2 | –1.5 | 9(–) | 6.3 | 86.6 | 7.1 |
Finished Goods Inventories | –3.4 | –10.3 | +6.9 | 0.0 | 8(–) | 14.4 | 67.8 | 17.8 |
Prices Paid for Raw Materials | 25.7 | 27.9 | –2.2 | 33.6 | 45(+) | 33.1 | 59.5 | 7.4 |
Prices Received for Finished Goods | 27.0 | 24.2 | +2.8 | 20.8 | 44(+) | 31.5 | 64.0 | 4.5 |
Wages and Benefits | 34.5 | 38.9 | –4.4 | 39.4 | 44(+) | 36.0 | 62.5 | 1.5 |
Employment | 8.0 | 12.0 | –4.0 | 23.0 | 43(+) | 19.8 | 68.4 | 11.8 |
Hours Worked | 4.3 | –0.1 | +4.4 | 8.9 | 1(+) | 13.8 | 76.7 | 9.5 |
Capital Expenditures | 10.8 | 12.9 | –2.1 | 19.5 | 43(+) | 24.4 | 62.0 | 13.6 |
| General Business Conditions Future (six months ahead) | ||||||||
| Indicator | Dec Index | Nov Index | Change | Series Average | Trend** | % Reporting Increase | % Reporting No Change | % Reporting Worsened |
Company Outlook | 1.4 | –7.4 | +8.8 | 18.4 | 1(+) | 19.4 | 62.6 | 18.0 |
General Business Activity | –8.7 | –13.4 | +4.7 | 12.5 | 5(–) | 13.3 | 64.7 | 22.0 |
*Shown is the number of consecutive months of expansion or contraction in the underlying indicator. Expansion is indicated by a positive index reading and denoted by a (+) in the table. Contraction is indicated by a negative index reading and denoted by a (–) in the table.
**Shown is the number of consecutive months of improvement or worsening in the underlying indicator. Improvement is indicated by a positive index reading and denoted by a (+) in the table. Worsening is indicated by a negative index reading and denoted by a (–) in the table.
Data have been seasonally adjusted as necessary.
Production index
Comments from survey respondents
These comments are from respondents’ completed surveys and have been edited for publication.
- [The Federal Reserve] please announce interest rate cuts for the next 12 months and start ASAP. The capital equipment industry is suffering tremendously. This is hurting the backbone of this country.
- Visibility of 2024 customer volumes shows flat year over year. We are poised to pick up competitor business and growth in new customers. It appears some companies are not operating optimally in a slower economy.
- We continue to make significant capital investments to increase capacity and in-source production. Almost all of our customers are manufacturers, and despite the doom and gloom in the news, our business continues to grow. We are seeing more customers look for alternative suppliers, sometimes changing long-standing relationships, as they seek better pricing and service. We see this as an opportunity more than a challenge.
- I believe we are nearing a cyclical bottom. Inventory correction has begun across all markets except automotive. We are still expecting automotive to correct, but it continues to be resilient for now.
- There is uncertainty about our line of credit renewal coming up in February 2024.
- Business is great for 2023 and [also what is] projected for 2024.
- We are starting to see orders from customers increase or get back to normal levels. Finding the right fit of employees still is a challenge.
- [Issues affecting our business include] volatility of commodity prices, federal funding and the politicization of economic decisions.
- Business activity has picked up a bit as we approach year-end after a slow October/November.
- Over the past several months, we have cut costs across our business to better position ourselves for a recession. Fortunately, our business is still strong, and we are growing market share. This has positively impacted our December forecast. We still believe that there are challenges with high prices in the food sector for consumers, and we are keeping a conservative outlook for 2024.
- Recent developments indicate declining inflation. Consumer spending has not declined, raising consumer debt to record highs. So, it is a mixed bag. We still think in 2024 these conditions will continue. Declining inflation leading to the Fed reducing interest rates will encourage consumers to continue spending.
- Business has slowed down significantly. We hope to see some type of an increase in business after the holidays. If we do not see an uptick in January, we are prepared for a very slow 2024.
- This next year is coming with higher uncertainty. The elections are creating customer hesitation, which we can see translating into order delays or even cancellations. If Biden is reelected, the oil industry will pull back in its spending temporarily, which will affect our business.
- 2024 is anticipated to be the worst year on record for this little 75-year-old company.
- We seem to be in a slug of paralysis. There's great concern about the upcoming election year. There's a heightened fear of war-related impact from overseas, but there's encouragement for a soft landing and potential rate decreases. The ole Magic 8 Ball is perhaps the best prognosticator we have at the present.
- A slight but measurable increase in orders is expected for first quarter 2024.
- In six months, we anticipate growth through the addition of new product being added to our portfolio. This is also the reason we will increase capital expenditures. The growth of our core legacy business is not expected to improve.
- A coalition of companies in our industry filed charges against 15 countries, including Mexico, for dumping and [receiving] subsidies from their respective governments. Preliminary rulings agreed that our industry has been severely hurt by these unfair trade practices. Our industry segment is hopeful the upcoming final rulings and determinations will prevent several in our industry from having to face significant shutdowns and closures.
- December will have more billing than November, and hopefully the winter months will bring us robust activity—something that doesn't happen very often. We believe we will be very busy next spring and fall based on jobs that are already being talked about.
- We have had a very strong fourth quarter relative to prior years in terms of gross sales, number of orders and production. That said, uncertainty is still high, and I'm not confident as to how the next six months will be with general concerns about the economy.
- Our typical seasonal drop for November and December was much greater than anticipated. This is echoed by other suppliers in our space.
- The increasing cost of credit is making any plans for construction and capital investments difficult to justify. Even at the slower growth rate in both 2022 and 2023, we will need to figure out a way to expand our facilities and buy new equipment in 2024—don’t know how we will be able to afford it. The continued and escalating competition from China is making it difficult to maintain much less grow market share in the United States.
Historical Data
Historical data can be downloaded dating back to June 2004.
Indexes
Download indexes for all indicators. For the definitions of all variables, see Data Definitions.
| Unadjusted |
| Seasonally adjusted |
All Data
Download indexes and components of the indexes (percentage of respondents reporting increase, decrease, or no change). For the definitions of all variables, see Data Definitions.
| Unadjusted |
| Seasonally adjusted |
Questions regarding the Texas Business Outlook Surveys can be addressed to Emily Kerr at emily.kerr@dal.frb.org.
Sign up for our email alert to be automatically notified as soon as the latest Texas Manufacturing Outlook Survey is released on the web.