Texas Manufacturing Outlook Survey

Texas manufacturing activity weakens in March
For this month’s survey, Texas business executives were asked supplemental questions on wages, prices and outlook concerns. Results for these questions from the Texas Manufacturing Outlook Survey, Texas Service Sector Outlook Survey and Texas Retail Outlook Survey have been released together. Read the special questions results.
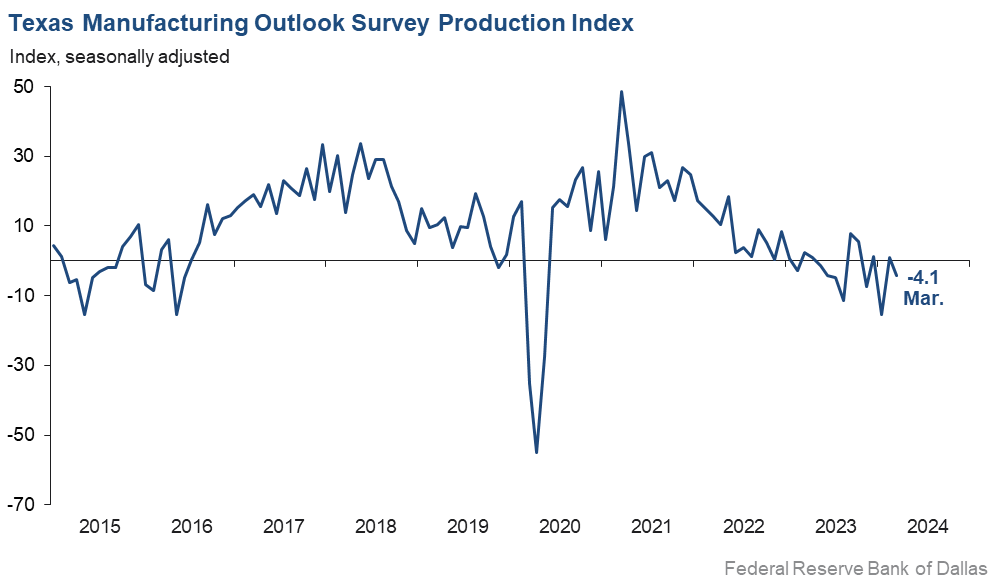
Texas factory activity weakened in March after stabilizing in February, according to business executives responding to the Texas Manufacturing Outlook Survey. The production index, a key measure of state manufacturing conditions, fell five points to -4.1, a reading that suggests a slight decline in output month over month.
Other measures of manufacturing activity also indicated declines this month. The new orders index—a key measure of demand—dropped 17 points to -11.8 after briefly turning positive last month. The capacity utilization index edged down five points to -5.7, and the shipments index plunged from 0.1 to -15.4.
Perceptions of broader business conditions continued to worsen in March. The general business activity index edged down from -11.3 to -14.4, and the company outlook index slipped from -8.5 to -16.2. The outlook uncertainty index moved up 12 points to 23.0, a six-month high.
Labor market measures suggested slower job growth and shorter workweeks this month. The employment index remained positive for a second month in a row but fell four points to 1.5. Fifteen percent of firms noted net hiring, while 13 percent noted net layoffs. The hours worked index remained negative for a sixth month in a row and held fairly steady at -7.9.
Wage and prices increased this month. The wages and benefits index held steady at a near-average reading of 20.4. The raw materials prices index remained below average but moved up from 15.4 to 21.1. The finished goods prices index climbed to 11.0 after two near-zero readings, suggesting a resumption in selling price growth.
Expectations regarding future manufacturing activity generally improved in March. The future production index pushed up 10 points to 32.3, and the future general business activity index remained slightly positive, at 1.3. Several other measures of future manufacturing activity edged further positive this month.
Next release: Monday, April 29
Data were collected March 12–20, and 87 of the 126 Texas manufacturers surveyed submitted a response. The Dallas Fed conducts the Texas Manufacturing Outlook Survey monthly to obtain a timely assessment of the state’s factory activity. Firms are asked whether output, employment, orders, prices and other indicators increased, decreased or remained unchanged over the previous month.
Survey responses are used to calculate an index for each indicator. Each index is calculated by subtracting the percentage of respondents reporting a decrease from the percentage reporting an increase. When the share of firms reporting an increase exceeds the share reporting a decrease, the index will be greater than zero, suggesting the indicator has increased over the prior month. If the share of firms reporting a decrease exceeds the share reporting an increase, the index will be below zero, suggesting the indicator has decreased over the prior month. An index will be zero when the number of firms reporting an increase is equal to the number of firms reporting a decrease. Data have been seasonally adjusted as necessary.
Results summary
Historical data are available from June 2004 to the most current release month.
| Business Indicators Relating to Facilities and Products in Texas Current (versus previous month) | ||||||||
| Indicator | Mar Index | Feb Index | Change | Series Average | Trend* | % Reporting Increase | % Reporting No Change | % Reporting Decrease |
Production | –4.1 | 1.0 | –5.1 | 9.9 | 1(–) | 20.5 | 54.9 | 24.6 |
Capacity Utilization | –5.7 | –1.0 | –4.7 | 8.0 | 3(–) | 17.7 | 58.9 | 23.4 |
New Orders | –11.8 | 5.2 | –17.0 | 5.3 | 1(–) | 19.5 | 49.2 | 31.3 |
Growth Rate of Orders | –19.8 | –5.5 | –14.3 | –0.6 | 23(–) | 10.4 | 59.4 | 30.2 |
Unfilled Orders | –16.6 | –13.7 | –2.9 | –2.1 | 6(–) | 5.8 | 71.8 | 22.4 |
Shipments | –15.4 | 0.1 | –15.5 | 8.3 | 1(–) | 15.1 | 54.4 | 30.5 |
Delivery Time | –6.1 | –8.0 | +1.9 | 1.0 | 12(–) | 13.3 | 67.3 | 19.4 |
Finished Goods Inventories | 4.7 | 1.1 | +3.6 | –3.2 | 2(+) | 22.1 | 60.5 | 17.4 |
Prices Paid for Raw Materials | 21.1 | 15.4 | +5.7 | 27.3 | 47(+) | 28.5 | 64.1 | 7.4 |
Prices Received for Finished Goods | 11.0 | 0.8 | +10.2 | 8.6 | 4(+) | 20.3 | 70.4 | 9.3 |
Wages and Benefits | 20.4 | 20.1 | +0.3 | 21.2 | 47(+) | 23.8 | 72.8 | 3.4 |
Employment | 1.5 | 5.9 | –4.4 | 7.7 | 2(+) | 14.6 | 72.3 | 13.1 |
Hours Worked | –7.9 | –7.0 | –0.9 | 3.4 | 6(–) | 6.6 | 78.9 | 14.5 |
Capital Expenditures | 1.8 | 5.0 | –3.2 | 6.5 | 6(+) | 17.6 | 66.6 | 15.8 |
| General Business Conditions Current (versus previous month) | ||||||||
| Indicator | Mar Index | Feb Index | Change | Series Average | Trend** | % Reporting Improved | % Reporting No Change | % Reporting Worsened |
Company Outlook | –16.2 | –8.5 | –7.7 | 4.8 | 25(–) | 11.1 | 61.6 | 27.3 |
General Business Activity | –14.4 | –11.3 | –3.1 | 1.0 | 23(–) | 11.1 | 63.4 | 25.5 |
| Indicator | Mar Index | Feb Index | Change | Series Average | Trend* | % Reporting Increase | % Reporting No Change | % Reporting Decrease |
Outlook Uncertainty | 23.0 | 11.0 | +12.0 | 17.2 | 35(+) | 31.0 | 60.9 | 8.0 |
| Business Indicators Relating to Facilities and Products in Texas Future (six months ahead) | ||||||||
| Indicator | Mar Index | Feb Index | Change | Series Average | Trend* | % Reporting Increase | % Reporting No Change | % Reporting Decrease |
Production | 32.3 | 22.4 | +9.9 | 36.4 | 47(+) | 46.7 | 38.9 | 14.4 |
Capacity Utilization | 25.1 | 20.2 | +4.9 | 33.3 | 47(+) | 40.4 | 44.3 | 15.3 |
New Orders | 23.7 | 24.2 | –0.5 | 33.8 | 17(+) | 38.6 | 46.4 | 14.9 |
Growth Rate of Orders | 18.6 | 17.7 | +0.9 | 24.9 | 10(+) | 30.2 | 58.2 | 11.6 |
Unfilled Orders | –0.2 | 3.9 | –4.1 | 2.9 | 1(–) | 11.4 | 77.0 | 11.6 |
Shipments | 21.5 | 24.4 | –2.9 | 34.8 | 47(+) | 39.6 | 42.4 | 18.1 |
Delivery Time | 0.3 | –3.1 | +3.4 | –1.5 | 1(+) | 10.4 | 79.5 | 10.1 |
Finished Goods Inventories | –9.9 | –3.5 | –6.4 | 0.0 | 2(–) | 14.8 | 60.5 | 24.7 |
Prices Paid for Raw Materials | 27.2 | 20.9 | +6.3 | 33.5 | 48(+) | 35.0 | 57.2 | 7.8 |
Prices Received for Finished Goods | 17.3 | 22.7 | –5.4 | 20.8 | 47(+) | 24.7 | 67.9 | 7.4 |
Wages and Benefits | 41.6 | 34.9 | +6.7 | 39.3 | 238(+) | 44.0 | 53.6 | 2.4 |
Employment | 17.9 | 15.6 | +2.3 | 22.9 | 46(+) | 27.8 | 62.3 | 9.9 |
Hours Worked | –0.5 | 4.4 | –4.9 | 8.8 | 1(–) | 12.9 | 73.7 | 13.4 |
Capital Expenditures | 12.7 | 17.7 | –5.0 | 19.5 | 46(+) | 25.4 | 61.9 | 12.7 |
| General Business Conditions Future (six months ahead) | ||||||||
| Indicator | Mar Index | Feb Index | Change | Series Average | Trend** | % Reporting Increase | % Reporting No Change | % Reporting Worsened |
Company Outlook | 12.5 | 11.8 | +0.7 | 18.3 | 4(+) | 25.8 | 60.9 | 13.3 |
General Business Activity | 1.3 | 6.2 | –4.9 | 12.3 | 2(+) | 18.3 | 64.7 | 17.0 |
*Shown is the number of consecutive months of expansion or contraction in the underlying indicator. Expansion is indicated by a positive index reading and denoted by a (+) in the table. Contraction is indicated by a negative index reading and denoted by a (–) in the table.
**Shown is the number of consecutive months of improvement or worsening in the underlying indicator. Improvement is indicated by a positive index reading and denoted by a (+) in the table. Worsening is indicated by a negative index reading and denoted by a (–) in the table.
Data have been seasonally adjusted as necessary.
Production index
Comments from survey respondents
These comments are from respondents’ completed surveys and have been edited for publication.
- Will the consumer continue to spend enough to promote growth? This is the question I cannot answer confidently. As a food manufacturer, I need consumers to maintain their food/lifestyle choices to continue to grow. It has been a very slow start to the year.
- Uncertainty about federal funding and donor/purchasing fatigue via private-label customers [are issues affecting our business].
- We are working on several new growth opportunities that are promising for late 2024. We are leaning into data-driven processes and automation to improve the efficiency of this additional business. This includes AI [artificial intelligence] and API [application programming interface] programs.
- Beef prices and availability are hurting margins and making it difficult to run product profitably. Chicken prices are also on the rise.
- We have been on a “hooray” roll regarding incoming orders, with a current huge uptick compared with the prior year to date. We are benefiting from a few diverse customer bases that need our services, plus we are coming up on our very busy time of the year, with growth forecast for that period as well. If not for these unique and somewhat isolated customer needs, I believe it would be very slow for us right now. Instead, we are adding workers in both the plant and office to handle the volume of work.
- The bad weather in January and February nationwide caused a downturn in new orders. This, coupled with the slight increase in interest rates (and no further decreases in mortgage rates), are not a good direction for homebuilding and remodeling and will cause us to miss our first-quarter expectation.
- Many good things may happen, but the actual occurrence remains to be seen.
- Business is still lackluster overall, but the Commerce Department has announced preliminary countervailing duties on aluminum extrusions from Mexico, Tukey, China and Indonesia. Aluminum extrusion companies based in those countries were being subsidized by their respective governments to ship products into the U.S. In addition, dumping charges have been filed on these four countries plus 10 others, with the Commerce Department already ruling dumping has occurred. Duties on the dumping are expected to be announced in May 2024.
- Capital expenditures are increasing to add new capabilities and new products. This is why our outlook is improved. Legacy business is declining sharply.
- A business is only as good as its customers’ business and is completely dependent upon its customers' demand—and demand is weak. It's a far stronger, deeper recession than publicized. Whether a lack of customer economic confidence, post-COVID caution, interest rates, inflation or a combination of all, it has stopped demand beyond the essential spending of deferred maintenance and repairs that buyers cannot defer any longer. Even with "competition retraction," businesses are serving the same and similar market segments, closing permanently or ceasing operations. Order volume remains unimproved.
- We kept thinking orders would pick up in the first quarter, but they have not. In fact, they've gotten even fewer and farther apart. Is it election uncertainly, a lack of peace overseas, money still being too expensive, or is it just a wet blanket over the entire economy? We don't know, but we're anxious to get some momentum going into the second half of the year.
- We are seeing general business activity slowing and competition increasing. We generally see this trend as business slows and our competitors become more hungry. However, we think that the third and fourth quarters will be better as the political landscape hopefully improves.
- After a very slow start for the year, we are seeing a slight increase in business. Hopefully, this trend will continue.
- Only time will tell the true underlying health of the labor market. While there are no disclosures we’re in a recession, ask any manufacturer on the globe and they will tell you we are deep into it. The backbone manufacturing of this country isn’t looking good at all. What is clear is that economic risks abound, and a soft landing is far from the truth out here. I have never seen it this bad in the capital equipment industry in the last 30 years.
- We have seen a $400,000 decrease in sales this year. I am very concerned.
- Election, energy and interest rate uncertainty makes business planning difficult.
- Political discussions about taxes are extremely dishonest, and future proposed increases to taxes will further reduce U.S. manufacturing competitiveness globally. I find it very insulting and disingenuous when medium-sized companies are called out as not paying "our fair share" of taxes. Currently, if you look at our total tax paid versus our total profit, we are taxed at over 60 percent as a medium-sized manufacturing company. We can't expand employment, technology and innovation to compete with China with higher taxes.
- Our sales have been unusually low since October 2023, and we see the trend continuing but more dramatically in the next four months. We are laying off nonessential workers and cutting hours for employees, effective immediately. Our automotive OEM [original equipment manufacturer] business is down by about 20 percent. We are seeing a continued drop in our catalog sales. Our overall volumes have been gradually reducing for several years. We are unable to determine why this is occurring.
Historical Data
Historical data can be downloaded dating back to June 2004.
Indexes
Download indexes for all indicators. For the definitions of all variables, see Data Definitions.
| Unadjusted |
| Seasonally adjusted |
All Data
Download indexes and components of the indexes (percentage of respondents reporting increase, decrease, or no change). For the definitions of all variables, see Data Definitions.
| Unadjusted |
| Seasonally adjusted |
Questions regarding the Texas Business Outlook Surveys can be addressed to Emily Kerr at emily.kerr@dal.frb.org.
Sign up for our email alert to be automatically notified as soon as the latest Texas Manufacturing Outlook Survey is released on the web.