Texas Service Sector Growth Slows Sharply in January

Texas Service Sector Outlook Survey
Texas Service Sector Growth Slows Sharply in January
For this month’s survey, Texas business executives were asked supplemental questions on the impact of COVID-19 and labor market conditions. Results for these questions from the Texas Manufacturing Outlook Survey, Texas Service Sector Outlook Survey and Texas Retail Outlook Survey have been released together. Read the special questions results.
This month’s data release also includes annual seasonal factor revisions. Once per year, the Federal Reserve Bank of Dallas revises the historical data for the Texas Service Sector Outlook Survey after calculating new seasonal adjustment factors. Annual seasonal revisions result in slight changes in the seasonally adjusted series. Read more information on seasonal adjustment.
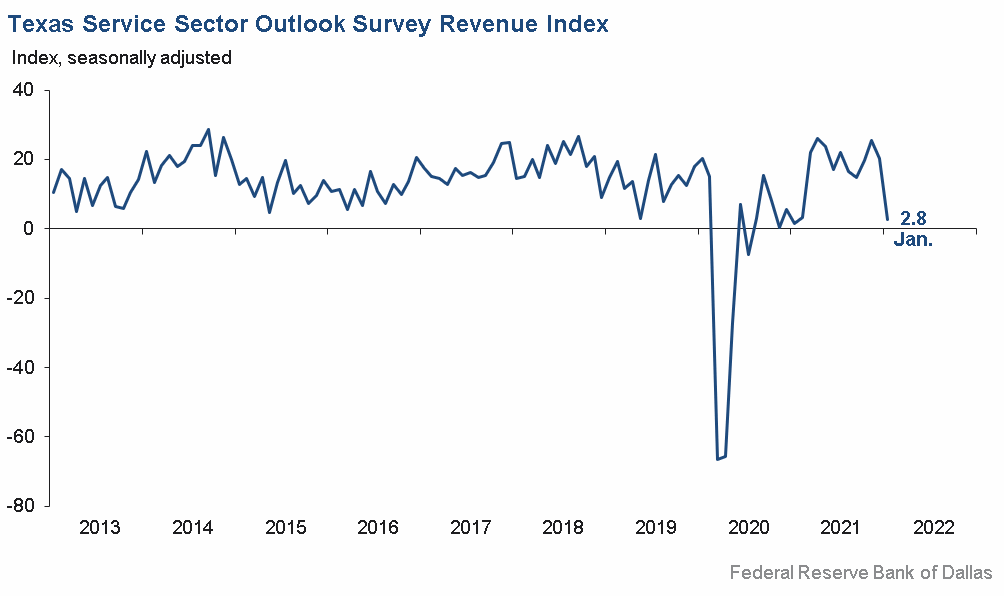
The Texas service sector decelerated notably in January, according to business executives responding to the Texas Service Sector Outlook Survey. The revenue index, a key measure of state service sector conditions, fell from 20.4 in December to 2.8 in January.
Labor market indicators suggest continued increases in hiring and hours worked, though at a somewhat slower pace. The employment index slipped from 10.7 in December to 9.2, while the part-time employment index weakened three points to 3.2. The hours worked index slid from 10.0 to 7.4.
Perceptions of broader business conditions plateaued in January. The general business activity index plunged from 14.2 to 0.6, while the company outlook index declined from 14.0 to -0.4. Uncertainty increased more steeply, with the outlook uncertainty index rising from 10.4 to 19.7.
Wages and prices continued to surge in January, and indexes climbed to at or near historically high levels. The wages and benefits index rose to a new record of 37.4. The selling prices index advanced from 28.3 to 29.7, while the input prices index rose from 49.l to 50.4.
Respondents’ expectations regarding future business activity continued to reflect optimism. The future general business activity index dropped five points to 16.7 but remained above its series average, while the future revenue index held flat at 53.4. Other future service sector activity indexes such as employment and capital expenditures slipped but remained in firmly positive territory.

Texas Retail Outlook Survey
Texas Retail Sales Decline in January
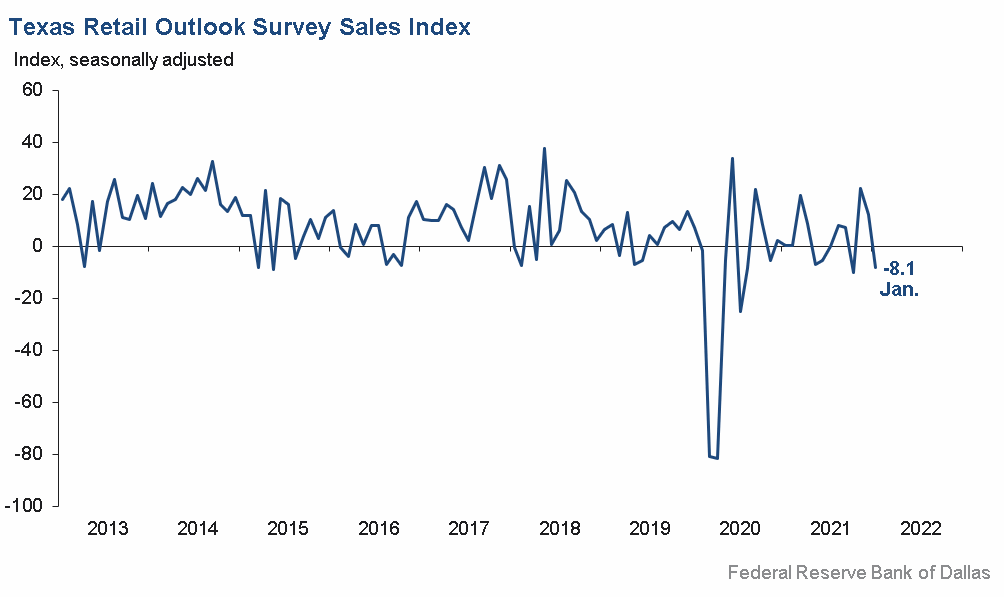
January retail sales activity fell notably compared with December, according to business executives responding to the Texas Retail Outlook Survey. The sales index, a key measure of state retail activity, plunged 20 points to -8.1 in January, its weakest reading in three months. Firms saw a sharp decline in inventories, reversing the prior month’s increase as the index fell from 15.8 to -10.0.
Retail labor market indicators were mixed in January. The employment index remained positive but inched down from 7.5 to 6.0, while the part-time employment index dropped from 8.3 to 1.6. The hours worked index weakened from 5.1 to -0.3.
Retailers’ perceptions of broader business conditions turned negative in January. The general business activity index tumbled 14 points to -7.2, while the company outlook index plunged nearly 27 points to -10.6—its lowest reading since May 2020. Outlook uncertainty surged, as the related index jumped from 2.4 to 24.0.
Retail price and wage pressures eased somewhat in January, though the indexes remained elevated. The selling prices index slid from 46.5 to 43.9, while the input prices index held roughly flat at 45.2. The wages and benefits index declined five points to 37.1.
Despite deteriorating current conditions, expectations for future retail activity remained optimistic. The future general business activity index fell from 10.9 to 4.2, while the future sales index held flat at 44.5. Other indexes of future retail activity were mixed but remained positive, suggesting continued strength going into the first half of 2022.
The Texas Retail Outlook Survey is a component of the Texas Service Sector Outlook Survey that uses information only from respondents in the retail and wholesale sectors.
Next release: March 1, 2022
Data were collected January 18–26, and 281 Texas service sector business executives, of which 46 were retailers, responded to the survey. The Dallas Fed conducts the Texas Service Sector Outlook Survey monthly to obtain a timely assessment of the state’s service sector activity. Firms are asked whether revenue, employment, prices, general business activity and other indicators increased, decreased or remained unchanged over the previous month.
Survey responses are used to calculate an index for each indicator. Each index is calculated by subtracting the percentage of respondents reporting a decrease from the percentage reporting an increase. When the share of firms reporting an increase exceeds the share reporting a decrease, the index will be greater than zero, suggesting the indicator has increased over the prior month. If the share of firms reporting a decrease exceeds the share reporting an increase, the index will be below zero, suggesting the indicator has decreased over the prior month. An index will be zero when the number of firms reporting an increase is equal to the number of firms reporting a decrease. Data have been seasonally adjusted as necessary.
Texas Service Sector Outlook Survey
Historical data are available from January 2007 to the most current release month.
| Business Indicators Relating to Facilities and Products in Texas Current (versus previous month) | ||||||||
| Indicator | Jan Index | Dec Index | Change | Series Average | Trend* | % Reporting Increase | % Reporting No Change | % Reporting Decrease |
Revenue | 2.8 | 20.4 | –17.6 | 11.2 | 18(+) | 26.3 | 50.3 | 23.5 |
Employment | 9.2 | 10.7 | –1.5 | 6.3 | 18(+) | 19.0 | 71.2 | 9.8 |
Part–Time Employment | 3.2 | 6.3 | –3.1 | 1.5 | 14(+) | 7.7 | 87.8 | 4.5 |
Hours Worked | 7.4 | 10.0 | –2.6 | 2.7 | 17(+) | 11.8 | 83.8 | 4.4 |
Wages and Benefits | 37.4 | 36.2 | +1.2 | 14.8 | 20(+) | 39.0 | 59.4 | 1.6 |
Input Prices | 50.4 | 49.1 | +1.3 | 26.0 | 21(+) | 52.7 | 44.9 | 2.3 |
Selling Prices | 29.7 | 28.3 | +1.4 | 6.2 | 18(+) | 33.6 | 62.4 | 3.9 |
Capital Expenditures | 19.0 | 16.5 | +2.5 | 9.9 | 17(+) | 23.4 | 72.3 | 4.4 |
| General Business Conditions Current (versus previous month) | ||||||||
| Indicator | Jan Index | Dec Index | Change | Series Average | Trend** | % Reporting Improved | % Reporting No Change | % Reporting Worsened |
Company Outlook | –0.4 | 14.0 | –14.4 | 5.6 | 1(–) | 15.8 | 68.0 | 16.2 |
General Business Activity | 0.6 | 14.2 | –13.6 | 4.0 | 13(+) | 19.6 | 61.4 | 19.0 |
| Indicator | Jan Index | Dec Index | Change | Series Average | Trend* | % Reporting Increase | % Reporting No Change | % Reporting Decrease |
Outlook Uncertainty† | 19.7 | 10.4 | +9.3 | 11.2 | 8(+) | 28.4 | 62.9 | 8.7 |
| Business Indicators Relating to Facilities and Products in Texas Future (six months ahead) | ||||||||
| Indicator | Jan Index | Dec Index | Change | Series Average | Trend* | % Reporting Increase | % Reporting No Change | % Reporting Decrease |
Revenue | 53.4 | 53.2 | +0.2 | 37.7 | 21(+) | 61.8 | 29.8 | 8.4 |
Employment | 36.8 | 41.5 | –4.7 | 22.7 | 21(+) | 44.4 | 48.0 | 7.6 |
Part–Time Employment | 17.7 | 14.8 | +2.9 | 6.9 | 20(+) | 20.9 | 75.9 | 3.2 |
Hours Worked | 13.0 | 12.4 | +0.6 | 6.0 | 21(+) | 17.1 | 78.8 | 4.1 |
Wages and Benefits | 54.4 | 56.2 | –1.8 | 36.6 | 21(+) | 55.8 | 42.8 | 1.4 |
Input Prices | 62.7 | 57.6 | +5.1 | 43.8 | 181(+) | 64.8 | 33.1 | 2.1 |
Selling Prices | 45.7 | 43.8 | +1.9 | 23.6 | 21(+) | 49.2 | 47.4 | 3.5 |
Capital Expenditures | 32.1 | 35.5 | –3.4 | 23.5 | 20(+) | 35.5 | 61.1 | 3.4 |
| General Business Conditions Future (six months ahead) | ||||||||
| Indicator | Jan Index | Dec Index | Change | Series Average | Trend** | % Reporting Improved | % Reporting No Change | % Reporting Worsened |
Company Outlook | 19.9 | 20.8 | –0.9 | 17.0 | 18(+) | 29.1 | 61.8 | 9.2 |
General Business Activity | 16.7 | 21.5 | –4.8 | 14.2 | 18(+) | 28.5 | 59.7 | 11.8 |
Historical data are available from January 2007 to the most current release month.
| Business Indicators Relating to Facilities and Products in Texas Retail (versus previous month) | ||||||||
| Indicator | Jan Index | Dec Index | Change | Series Average | Trend* | % Reporting Increase | % Reporting No Change | % Reporting Decrease |
| Retail Activity in Texas | ||||||||
Sales | –8.1 | 12.4 | –20.5 | 5.5 | 1(–) | 25.4 | 41.1 | 33.5 |
Employment | 6.0 | 7.5 | –1.5 | 1.9 | 6(+) | 16.7 | 72.6 | 10.7 |
Part–Time Employment | 1.6 | 8.3 | –6.7 | –1.7 | 11(+) | 7.8 | 86.0 | 6.2 |
Hours Worked | –0.3 | 5.1 | –5.4 | –1.8 | 1(–) | 10.7 | 78.3 | 11.0 |
Wages and Benefits | 37.1 | 42.5 | –5.4 | 10.2 | 18(+) | 43.0 | 51.1 | 5.9 |
Input Prices | 45.2 | 44.3 | +0.9 | 20.9 | 21(+) | 52.5 | 40.1 | 7.3 |
Selling Prices | 43.9 | 46.5 | –2.6 | 12.7 | 20(+) | 52.8 | 38.2 | 8.9 |
Capital Expenditures | 16.8 | 4.9 | +11.9 | 7.9 | 12(+) | 20.0 | 76.8 | 3.2 |
Inventories | –10.0 | 15.8 | –25.8 | 2.0 | 1(–) | 18.1 | 53.8 | 28.1 |
| Companywide Retail Activity | ||||||||
Companywide Sales | –7.5 | 17.2 | –24.7 | 7.0 | 1(–) | 24.4 | 43.7 | 31.9 |
Companywide Internet Sales | –2.9 | 13.9 | –16.8 | 5.8 | 1(–) | 16.1 | 64.8 | 19.0 |
| General Business Conditions, Retail Current (versus previous month) | ||||||||
| Indicator | Jan Index | Dec Index | Change | Series Average | Trend** | % Reporting Improved | % Reporting No Change | % Reporting Worsened |
Company Outlook | –10.6 | 16.1 | –26.7 | 3.6 | 1(–) | 10.3 | 68.8 | 20.9 |
General Business Activity | –7.2 | 7.1 | –14.3 | 0.0 | 1(–) | 15.8 | 61.1 | 23.0 |
| Outlook Uncertainty Current (versus previous month) | ||||||||
| Indicator | Jan Index | Dec Index | Change | Series Average | Trend* | % Reporting Increase | % Reporting No Change | % Reporting Decrease |
Outlook Uncertainty† | 24.0 | 2.4 | +21.6 | 9.4 | 8(+) | 28.3 | 67.4 | 4.3 |
| Business Indicators Relating to Facilities and Products in Texas, Retail Future (six months ahead) | ||||||||
| Indicator | Jan Index | Dec Index | Change | Series Average | Trend* | % Reporting Increase | % Reporting No Change | % Reporting Decrease |
| Retail Activity in Texas | ||||||||
Sales | 44.5 | 45.0 | –0.5 | 32.9 | 21(+) | 54.7 | 35.1 | 10.2 |
Employment | 25.3 | 30.7 | –5.4 | 13.0 | 21(+) | 32.1 | 61.1 | 6.8 |
Part–Time Employment | 17.3 | 14.0 | +3.3 | 1.6 | 18(+) | 23.8 | 69.7 | 6.5 |
Hours Worked | 0.3 | 5.5 | –5.2 | 3.1 | 21(+) | 10.4 | 79.5 | 10.1 |
Wages and Benefits | 44.3 | 53.1 | –8.8 | 28.5 | 21(+) | 45.3 | 53.6 | 1.0 |
Input Prices | 51.1 | 48.9 | +2.2 | 33.7 | 21(+) | 58.1 | 34.9 | 7.0 |
Selling Prices | 52.3 | 44.2 | +8.1 | 29.7 | 21(+) | 61.4 | 29.5 | 9.1 |
Capital Expenditures | 27.2 | 23.3 | +3.9 | 17.7 | 20(+) | 29.5 | 68.2 | 2.3 |
Inventories | 25.1 | 36.2 | –11.1 | 10.3 | 21(+) | 39.4 | 46.4 | 14.3 |
| Companywide Retail Activity | ||||||||
Companywide Sales | 34.5 | 47.1 | –12.6 | 31.4 | 21(+) | 47.0 | 40.6 | 12.5 |
Companywide Internet Sales | 27.2 | 34.3 | –7.1 | 22.8 | 22(+) | 33.3 | 60.6 | 6.1 |
| General Business Conditions, Retail Future (six months ahead) | ||||||||
| Indicator | Jan Index | Dec Index | Change | Series Average | Trend** | % Reporting Improved | % Reporting No Change | % Reporting Worsened |
Company Outlook | 14.2 | 17.8 | –3.6 | 17.7 | 21(+) | 21.9 | 70.4 | 7.7 |
General Business Activity | 4.2 | 10.9 | –6.7 | 13.5 | 18(+) | 18.1 | 68.0 | 13.9 |
*Shown is the number of consecutive months of expansion or contraction in the underlying indicator. Expansion is indicated by a positive index reading and denoted by a (+) in the table. Contraction is indicated by a negative index reading and denoted by a (–) in the table.
**Shown is the number of consecutive months of improvement or worsening in the underlying indicator. Improvement is indicated by a positive index reading and denoted by a (+) in the table. Worsening is indicated by a negative index reading and denoted by a (–) in the table.
†Added to survey in January 2018.
Data have been seasonally adjusted as necessary, with the exception of the outlook uncertainty index which does not yet have a sufficiently long time series to test for seasonality.
Texas Service Sector Outlook Survey
Texas Retail Outlook Survey
Texas Service Sector Outlook Survey
Comments from Survey Respondents
These comments are from respondents’ completed surveys and have been edited for publication.
- I feel like economic activity is slowing a little.
- Clarification of OSHA [Occupational Safety and Health Administration] requirements following Supreme Court rulings alleviate uncertainty, even if the federal contractor mandate—which we are subject to—is still on hold subject to Supreme Court review. Although we have made progress on vaccination and documented exemptions, we still have to continue the drive if we need to be compliant with the federal mandate. It would help to have Texas be unified in pushing for vaccination to close that gap.
- Inflation is hitting everything. It creates so much uncertainty about prices.
- Omicron is expected to peak and shift to an endemic phase. Global demand continues to grow.
- 2021 was our best year ever, and 2022 looks very promising.
- We were able to offer COLA [cost of living adjustment] increases to our employees for the new year and are also taking a small PPI [producer price index]-based increase in the prices to our customers. We are expecting the inflationary pressures we've faced for the past six months to stabilize over the next six months and keep our input prices flat.
- Costs for qualified skilled labor and availability as well as support services continue to increase significantly. The hope is that pricing power will be able to cover most of these increases, but that is still to be determined.
- Wage pressure and availability of workforce is a concern for both our company and our customers.
- Our clients are becoming somewhat cautious with high inflation and expected interest rate increases. [There is] hesitation on capital spending.
- We have been around too long to be "uncertain." We are very concerned about the effect of inflation on our staff. As the Federal Reserve should know, 80 percent of economics is psychological—rising or falling expectations. In this environment, rising expectations are not possible except in the government and government-funded nonprofits.
- The driving factor in the business activity slowing down is the uncertainty of more contentious regulations and the impact of the current pandemic. This round of COVID has certainly affected our normal workforce as with many businesses.
- Sales volume is low. Employees are leaving for so-called better wages. It is hard to hire any kind of replacements with skills. It is a tough market and also [there are] tough production problems (employees), and raw materials and supply prices continue to increase significantly.
- Labor market remains tight. Supply-chain issues persist.
- Interest rates and inflation are quickly becoming the topic of conversation. I don't think many are surprised, so I suspect the markets will calm down as uncertainty wanes.
- We are watching the personal savings rate to see if consumption is under pressure and, hence, [we see] a slowdown in hiring.
- COVID is placing a number of industries at financial risk including but not limited to travel, hospitality and tourism.
- There is a big uptick in employee positive COVID tests.
- [There is a] shortage of inventory.
- We are seeing continued strong demand for space and improved occupancy; however, pricing pressures on construction and renovations continue to slow or prevent some deals from happening.
- The Federal Reserve's plan to raise interest rates is anticipated to negatively impact the value of income properties and developable land.
- Heavy equipment and material handling equipment is basically on allocation from our manufacturers although they do not use that term. If they can even get the equipment made, they cannot get it across the ocean. Example: I need 1,200 construction equipment units for 2022, plus I need to replenish my badly depleted rental fleet we have sold out of for the past two years by 400 units. My estimated units is 991 for 2022. Transitory inflation was B.S. from the day that term was first used, and every businessman in the world knew it. Inflation and the Fed [Federal Reserve] increases will kill the economy this year or the next. I'm betting on this year.
- [There has been] increased productivity disruptions and staff absences due to COVID-19 infections. In January, COVID has impacted over 30 percent of our staff—either the employee was infected or a member of their household was infected or they were exposed by close contact to someone who later tested positive.
- Omicron has put a damper on trials going into January but it has only pushed them out (not canceled). We expect spring to be unbelievably busy based on court schedules.
- The real estate market has remained strong in spite of the inflation numbers and the increase in the 10-year rate. We feel at some point this will slow the growth of the market but will not kill it. There is still a lot of money chasing deals and even with the rise of the 10-year, it is still cheap money. If inflation settles down once the supply chain gets back to normal, we could be in for another great run.
- Inflation is impacting business. All prices for supplies, etc., are higher. I hope prices will stop going up.
- Clients have new and improved annual budgets in January and have started allowing contracts.
- Supply-chain constraints are a major issue for us. [There were] over $11 million in orders we couldn’t fulfill as of the end of December
- COVID-related supply and staffing shortages are still causing sales delays and adding cost.
- If Russia invades Ukraine, that could change things, but trends appear to be continuing to improve, and clients across the board are reflecting improving market conditions. Rising interest rates are not an issue as most clients have strong liquidity.
- Historically high inflation is causing great uncertainty around transaction activity outside of a few key sectors.
- We are a travel service provider for the Department of Defense, and our contracts have been very active in the last month.
- Labor shortage continues to be the primary concern for our clients and our own business. Clients have started to broaden the requirements for candidates they want to hire. For instance, originally they wanted industry experience, now they no longer require industry experience, or they originally required five years’ work experience and now are considering recent college graduates.
- I think the Federal Reserve did not support its dual mandate of stable prices and stable employment. Monetary policy has caused a mess.
- [We are] seeing temporary challenges in terms of coverage related to the COVID omicron variant. Overall, business for January is better than historic volumes. [There is] incredible pressure on salaries and wages with severe hiring challenges. Basically, we have to give in or lose an employee. Since we are a deflationary business, this will adversely affect margins and profitability.
- The health care sector continues to struggle with a severe shortage in the nursing area that is evident in the hospitals. In a physician's office, a significant number of subspecialists have "retired" during the present pandemic/endemic. HR cost is the single biggest expense (65 percent) of the total expenses for home health and hospice services. Therefore, the labor shortage is a critical touch point for health care service providers.
- Private practice in health care is increasingly stressed: Relentless increase in COVID expenses, increased wages, increased long COVID, increased lost days due to exposure, decreased efficiency and early retirements are compounded by decreases in Medicare reimbursement.
- Omicron has resulted in diminished consumer visits, resulting in lower revenue. Our hope is that things will normalize and stabilize over the next several months.
- Labor and supply costs are exploding, with little clarity regarding future relief.
- We have seen an increase in sickness and [employee] time not at work.
- Omicron has resulted in group and individual traveler cancellations as far into the future as June. Staffing is being challenged by the high number of employees either testing positive or being quarantined.
- Omicron has been identified as the cause of some recent groups’ [cancellations]. At the moment, omicron looks like a very near-term issue, but first quarter will be off from budget. We are still anticipating the remainder of the year to be better than last year. Inflation is causing higher prices for textiles and guest supplies. Ultimately, cost will be passed on to consumers.
- Until we are back to work and business travel resumes, we are stuck.
- We are experiencing shortages, price gouging and lack of qualified employees.
- Unfortunately, we have been dealing with the impacts of omicron. We were already short staffed and are now dealing with employees getting omicron and having to miss work for a week and a half to two weeks while recovering.
- In some respects, it is difficult to plan activities and events, either because COVID is requiring we change or because partners in other locations are still adjusting/have not returned to prepandemic ways of operating.
- The latest omicron strain has increased uncertainty in how quickly businesses are opening.
- Omicron has thrown us all for another loop. The supply-chain issues are not being resolved, and container shortages (for outbound shipment) are still tight, as in congestion in receiving parts. This does not seem to be something that will resolve in 2022. While parts are hard to come by, staffed shops are also. While they were short staffed for the last two years, now they have seemingly everyone out sick. This seems to be temporary. I tried to order new equipment, and trucks and arrivals are eight-to-12-plus months [out]. This will drive inflation and stifle productivity.
- My outlook on revenues is projected to increase as we are planning to hire more, but I am not optimistic about the gross increasing.
- We have been dealing with supply-chain (trucking) issues since early 2021. My outlook has not changed (it's still very pessimistic), and I don't see it moderating anytime soon. I thought the surge in third-quarter/fourth-quarter demand would slacken in first quarter 2022, and the West Coast ports (LA–Long Beach) would start to catch up. Instead, it looks like the situation will persist. As ships are unloaded, the demand for trucking is so high, and the international carriers are willing to pay a premium to get their goods off-loaded; it's putting extreme pressure on the rest of the United States’ trucking capacity (and driving up trucking costs).
- Inventories remain short.
- COVID is having an effect on business and employees being absent.
Historical Data
Historical data can be downloaded dating back to January 2007.
Indexes
Download indexes for all indicators. For the definitions of all variables, see Data Definitions.
Texas Service Sector Outlook Survey |
Texas Retail Outlook Survey |
| Unadjusted | Unadjusted |
| Seasonally adjusted | Seasonally adjusted |
All Data
Download indexes and components of the indexes (percentage of respondents reporting increase, decrease, or no change). For the definitions of all variables, see Data Definitions.
Texas Service Sector Outlook Survey |
Texas Retail Outlook Survey |
| Unadjusted | Unadjusted |
| Seasonally adjusted | Seasonally adjusted |
Questions regarding the Texas Service Sector Outlook Survey can be addressed to Christopher Slijk at christopher.slijk@dal.frb.org.
Sign up for our email alert to be automatically notified as soon as the latest Texas Service Sector Outlook Survey is released on the web.