Texas Service Sector Growth Moderates in November

Texas Service Sector Outlook Survey
Texas Service Sector Growth Moderates in November
For this month’s survey, Texas business executives were asked supplemental questions on costs and operating margins. Results for these questions from the Texas Manufacturing Outlook Survey, Texas Service Sector Outlook Survey and Texas Retail Outlook Survey have been released together. Read the special questions results.
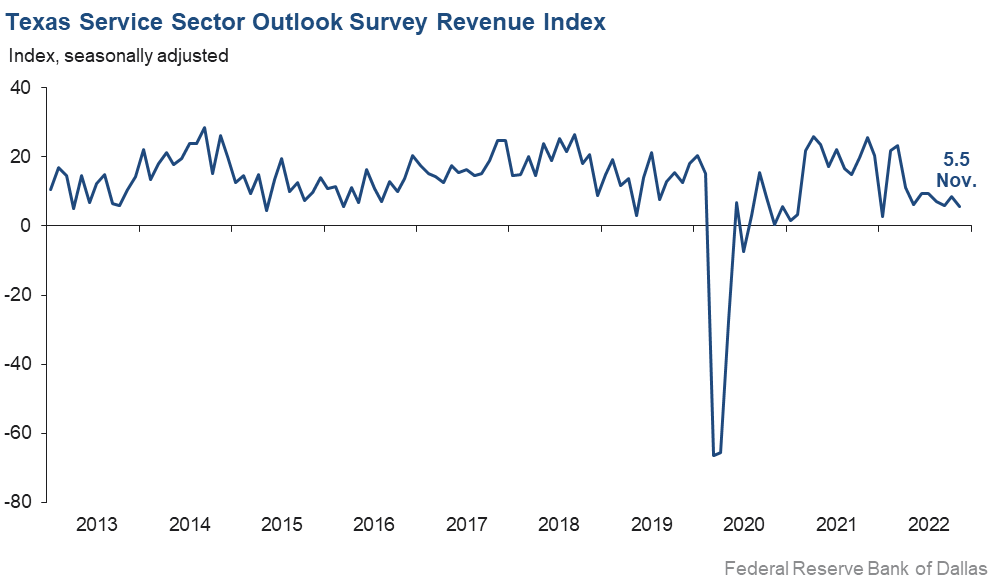
Activity in the Texas service sector increased at a slower pace in November, according to business executives responding to the Texas Service Sector Outlook Survey. The revenue index, a key measure of state service sector conditions, weakened slightly from 8.5 in October to 5.5 in November, with the share of firms reporting increasing revenues falling below 30 percent for the first time in six months.
Labor market indicators suggested continued growth in employment and hours worked in November. The employment index was flat at 8.3, while the part-time employment index fell two points to 0.9. The hours worked index held steady at 4.6.
Perceptions of broader business conditions remained negative in November, although they were less pessimistic than in October. The general business activity index improved slightly from -13.6 in October to -11.0 in November. The company outlook index also increased from -9.1 to -4.1, while the outlook uncertainty index fell four points to 23.4.
Growth in selling and input prices continued to moderate in November, while wage pressures picked up slightly. Nevertheless, the indexes remained well above historical averages. The selling prices index edged down from 19.7 to 17.6, while the input prices index fell five points to 46.2. The wages and benefits index increased from 22.9 to 25.4.
Respondents’ expectations regarding future business activity were mixed in November, with some indicators pointing to more optimism. The future general business activity index improved seven points but was still in negative territory at -6.3. The future revenue index remained positive, increasing three points to 35.3. Other future service sector activity indexes such as employment and capital expenditures also picked up, suggesting some recovery in expectations for growth next year.

Texas Retail Outlook Survey
Texas Retail Sales Weaken
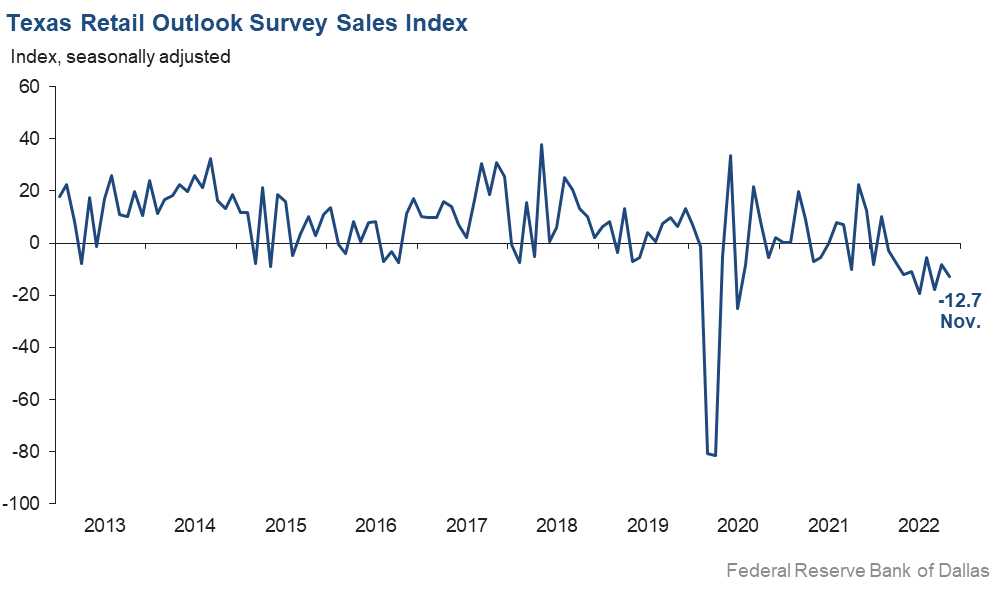
November retail sales activity declined according to business executives responding to the Texas Retail Outlook Survey. The sales index, a key measure of state retail activity, fell four points to -12.7. Retailers’ inventories continued to increase, and the index rose from 8.9 to 15.7, suggesting inventories grew at a faster pace than in October.
Retail labor market indicators reflected a contraction in employment and some growth in workweeks in November. The employment index fell from 3.7 to -4.6. The part-time employment index remained in negative territory and fell from -1.9 to -4.3. The hours worked index increased from -0.9 to 1.7, with the share of firms reporting an increase in average hours worked among employees growing from 8.8 percent to 15.2 percent.
Retailers’ perceptions of broader business conditions continued to worsen in November, as both the general business activity and company outlook indexes remained deep in negative territory. The general business activity index was largely unchanged at -21.8, while the company outlook index rose two points to -12.3. The outlook uncertainty index increased seven points from 20.6 to 27.7.
Retail wage and price pressures continued to ease in November. The selling prices index dropped eight points to 13.5, its lowest level since July 2020. The input prices index fell from 41.2 to 38.7, while the wages and benefits index decreased three points to 10.9.
Expectations for future retail growth were mixed in November. The future general business activity index decreased from -22.0 to -17.6, while the future sales index held steady at 8.6, reflecting continued growth expectations. Other indexes of future retail activity such as employment and capital expenditures remained in positive territory, suggesting expectations for continued growth over the next six months.
The Texas Retail Outlook Survey is a component of the Texas Service Sector Outlook Survey that uses information only from respondents in the retail and wholesale sectors.
Next release: December 28, 2022
Data were collected November 14–22, and 309 Texas service sector business executives, of which 67 were retailers, responded to the survey. The Dallas Fed conducts the Texas Service Sector Outlook Survey monthly to obtain a timely assessment of the state’s service sector activity. Firms are asked whether revenue, employment, prices, general business activity and other indicators increased, decreased or remained unchanged over the previous month.
Survey responses are used to calculate an index for each indicator. Each index is calculated by subtracting the percentage of respondents reporting a decrease from the percentage reporting an increase. When the share of firms reporting an increase exceeds the share reporting a decrease, the index will be greater than zero, suggesting the indicator has increased over the prior month. If the share of firms reporting a decrease exceeds the share reporting an increase, the index will be below zero, suggesting the indicator has decreased over the prior month. An index will be zero when the number of firms reporting an increase is equal to the number of firms reporting a decrease. Data have been seasonally adjusted as necessary.
Texas Service Sector Outlook Survey
Historical data are available from January 2007 to the most current release month.
| Business Indicators Relating to Facilities and Products in Texas Current (versus previous month) | ||||||||
| Indicator | Nov Index | Oct Index | Change | Series Average | Trend* | % Reporting Increase | % Reporting No Change | % Reporting Decrease |
Revenue | 5.5 | 8.5 | –3.0 | 11.2 | 28(+) | 28.1 | 49.2 | 22.6 |
Employment | 8.3 | 9.0 | –0.7 | 6.6 | 28(+) | 20.2 | 67.9 | 11.9 |
Part–Time Employment | 0.9 | 2.9 | –2.0 | 1.6 | 24(+) | 7.2 | 86.5 | 6.3 |
Hours Worked | 4.6 | 5.1 | –0.5 | 2.9 | 27(+) | 12.6 | 79.4 | 8.0 |
Wages and Benefits | 25.4 | 22.9 | +2.5 | 15.6 | 30(+) | 29.2 | 67.0 | 3.8 |
Input Prices | 46.2 | 51.4 | –5.2 | 27.3 | 31(+) | 49.3 | 47.6 | 3.1 |
Selling Prices | 17.6 | 19.7 | –2.1 | 7.3 | 28(+) | 26.3 | 65.0 | 8.7 |
Capital Expenditures | 12.7 | 12.6 | +0.1 | 10.1 | 27(+) | 21.8 | 69.1 | 9.1 |
| General Business Conditions Current (versus previous month) | ||||||||
| Indicator | Nov Index | Oct Index | Change | Series Average | Trend** | % Reporting Improved | % Reporting No Change | % Reporting Worsened |
Company Outlook | –4.1 | –9.1 | +5.0 | 5.2 | 6(–) | 13.3 | 69.3 | 17.4 |
General Business Activity | –11.0 | –13.6 | +2.6 | 3.6 | 6(–) | 15.7 | 57.6 | 26.7 |
| Indicator | Nov Index | Oct Index | Change | Series Average | Trend* | % Reporting Increase | % Reporting No Change | % Reporting Decrease |
Outlook Uncertainty† | 23.4 | 27.6 | –4.2 | 13.1 | 18(+) | 32.3 | 58.8 | 8.9 |
| Business Indicators Relating to Facilities and Products in Texas Future (six months ahead) | ||||||||
| Indicator | Nov Index | Oct Index | Change | Series Average | Trend* | % Reporting Increase | % Reporting No Change | % Reporting Decrease |
Revenue | 35.3 | 32.2 | +3.1 | 37.8 | 31(+) | 51.1 | 33.1 | 15.8 |
Employment | 27.1 | 24.6 | +2.5 | 23.2 | 31(+) | 37.7 | 51.7 | 10.6 |
Part–Time Employment | 3.1 | 3.6 | –0.5 | 6.9 | 5(+) | 10.3 | 82.5 | 7.2 |
Hours Worked | 5.0 | 2.1 | +2.9 | 6.0 | 31(+) | 11.3 | 82.4 | 6.3 |
Wages and Benefits | 45.5 | 47.4 | –1.9 | 37.3 | 31(+) | 48.9 | 47.7 | 3.4 |
Input Prices | 50.8 | 56.9 | –6.1 | 44.6 | 191(+) | 53.3 | 44.1 | 2.5 |
Selling Prices | 35.7 | 41.0 | –5.3 | 24.5 | 31(+) | 42.4 | 50.9 | 6.7 |
Capital Expenditures | 22.1 | 18.1 | +4.0 | 23.5 | 30(+) | 30.9 | 60.3 | 8.8 |
| General Business Conditions Future (six months ahead) | ||||||||
| Indicator | Nov Index | Oct Index | Change | Series Average | Trend** | % Reporting Improved | % Reporting No Change | % Reporting Worsened |
Company Outlook | 4.3 | –2.9 | +7.2 | 16.4 | 1(+) | 24.1 | 56.1 | 19.8 |
General Business Activity | –6.3 | –13.2 | +6.9 | 13.4 | 7(–) | 18.6 | 56.5 | 24.9 |
Historical data are available from January 2007 to the most current release month.
| Business Indicators Relating to Facilities and Products in Texas Retail (versus previous month) | ||||||||
| Indicator | Nov Index | Oct Index | Change | Series Average | Trend* | % Reporting Increase | % Reporting No Change | % Reporting Decrease |
| Retail Activity in Texas | ||||||||
Sales | –12.7 | –8.3 | –4.4 | 4.7 | 9(–) | 27.5 | 32.3 | 40.2 |
Employment | –4.6 | 3.7 | –8.3 | 1.9 | 1(–) | 12.9 | 69.5 | 17.5 |
Part–Time Employment | –4.3 | –1.9 | –2.4 | –1.6 | 6(–) | 6.1 | 83.5 | 10.4 |
Hours Worked | 1.7 | –0.9 | +2.6 | –1.7 | 1(+) | 15.2 | 71.3 | 13.5 |
Wages and Benefits | 10.9 | 14.1 | –3.2 | 11.0 | 28(+) | 21.1 | 68.7 | 10.2 |
Input Prices | 38.7 | 41.2 | –2.5 | 22.3 | 31(+) | 48.2 | 42.3 | 9.5 |
Selling Prices | 13.5 | 21.2 | –7.7 | 13.9 | 30(+) | 37.2 | 39.0 | 23.7 |
Capital Expenditures | 8.8 | 7.1 | +1.7 | 8.1 | 22(+) | 20.2 | 68.4 | 11.4 |
Inventories | 15.7 | 8.9 | +6.8 | 2.1 | 5(+) | 33.9 | 48.0 | 18.2 |
| Companywide Retail Activity | ||||||||
Companywide Sales | –10.5 | –4.1 | –6.4 | 6.2 | 7(–) | 22.7 | 44.2 | 33.2 |
Companywide Internet Sales | –16.0 | –17.5 | +1.5 | 5.0 | 7(–) | 7.8 | 68.5 | 23.8 |
| General Business Conditions, Retail Current (versus previous month) | ||||||||
| Indicator | Nov Index | Oct Index | Change | Series Average | Trend** | % Reporting Improved | % Reporting No Change | % Reporting Worsened |
Company Outlook | –12.3 | –13.9 | +1.6 | 2.9 | 9(–) | 12.6 | 62.5 | 24.9 |
General Business Activity | –21.8 | –21.4 | –0.4 | –0.7 | 7(–) | 15.6 | 47.0 | 37.4 |
| Outlook Uncertainty Current (versus previous month) | ||||||||
| Indicator | Nov Index | Oct Index | Change | Series Average | Trend* | % Reporting Increase | % Reporting No Change | % Reporting Decrease |
Outlook Uncertainty† | 27.7 | 20.6 | +7.1 | 10.7 | 18(+) | 40.0 | 47.7 | 12.3 |
| Business Indicators Relating to Facilities and Products in Texas, Retail Future (six months ahead) | ||||||||
| Indicator | Nov Index | Oct Index | Change | Series Average | Trend* | % Reporting Increase | % Reporting No Change | % Reporting Decrease |
| Retail Activity in Texas | ||||||||
Sales | 8.6 | 8.2 | +0.4 | 32.2 | 31(+) | 34.3 | 40.0 | 25.7 |
Employment | 9.1 | 6.4 | +2.7 | 13.2 | 31(+) | 22.6 | 63.9 | 13.5 |
Part–Time Employment | 2.4 | 8.4 | –6.0 | 1.8 | 2(+) | 11.6 | 79.2 | 9.2 |
Hours Worked | –1.8 | –5.4 | +3.6 | 3.0 | 2(–) | 8.9 | 80.4 | 10.7 |
Wages and Benefits | 32.9 | 37.0 | –4.1 | 29.2 | 31(+) | 39.0 | 55.0 | 6.1 |
Input Prices | 39.7 | 43.0 | –3.3 | 34.4 | 31(+) | 49.2 | 41.3 | 9.5 |
Selling Prices | 21.3 | 32.3 | –11.0 | 30.1 | 31(+) | 41.0 | 39.3 | 19.7 |
Capital Expenditures | 11.3 | 13.9 | –2.6 | 17.8 | 30(+) | 25.8 | 59.7 | 14.5 |
Inventories | 12.1 | 6.3 | +5.8 | 10.7 | 31(+) | 28.4 | 55.3 | 16.3 |
| Companywide Retail Activity | ||||||||
Companywide Sales | 1.4 | 10.2 | –8.8 | 30.7 | 31(+) | 25.8 | 49.8 | 24.4 |
Companywide Internet Sales | 0.0 | 9.1 | –9.1 | 22.3 | 1() | 13.5 | 73.1 | 13.5 |
| General Business Conditions, Retail Future (six months ahead) | ||||||||
| Indicator | Nov Index | Oct Index | Change | Series Average | Trend** | % Reporting Improved | % Reporting No Change | % Reporting Worsened |
Company Outlook | –10.4 | –6.3 | –4.1 | 16.6 | 7(–) | 13.1 | 63.4 | 23.5 |
General Business Activity | –17.6 | –22.0 | +4.4 | 12.2 | 8(–) | 12.9 | 56.6 | 30.5 |
*Shown is the number of consecutive months of expansion or contraction in the underlying indicator. Expansion is indicated by a positive index reading and denoted by a (+) in the table. Contraction is indicated by a negative index reading and denoted by a (–) in the table.
**Shown is the number of consecutive months of improvement or worsening in the underlying indicator. Improvement is indicated by a positive index reading and denoted by a (+) in the table. Worsening is indicated by a negative index reading and denoted by a (–) in the table.
†Added to survey in January 2018.
Data have been seasonally adjusted as necessary, with the exception of the outlook uncertainty index which does not yet have a sufficiently long time series to test for seasonality.
Texas Service Sector Outlook Survey
Texas Retail Outlook Survey
Texas Service Sector Outlook Survey
Comments from Survey Respondents
These comments are from respondents’ completed surveys and have been edited for publication.
- Global uncertainty continues, as well as geopolitics, global demand uncertainty (China) and limited global crude production spare capacity. U.S. mid-terms’ results reinforce bipartisan policy/legislation, eliminating potential extreme energy policy positions.
- The nonresolved railroad workers’ strike is hanging like a dark cloud on the horizon and threatening to disrupt on a massive scale.
- Demand for Texas energy remains strong. We believe we are well-positioned for the near and medium terms to continue moderate growth of the business, including higher capital expenditures, higher revenues and higher wages. Hopefully, we are at the beginning of a moderation of costs to provide services.
- Access to financing remains tight as private capital investors remain conservative, and conventional financing remains expensive. This continues to create tremendous uncertainty for us regarding head count, capital expenditures, pricing and geographical expansion. As a result, we have become more conservative ourselves, slowing our hiring ramp dramatically, curtailing plans for expansion and focusing on increasing profitability through cost cutting and higher-value customers.
- Geopolitical risk and inflation have increased causing added pause in some decisions or pushing for lower prices/value to move faster.
- The interest rate environment is creating a slight slowdown in activity for the company. Loan demand has slowed, and real estate market activity is down, especially residential loans and purchases. Agricultural production decreased due to a hot, dry summer, and the volume of agriculture lending reduced.
- We just moved into a smaller facility. We could not give our office furniture away. We had to pay for the furniture to be hauled off because of the glut of shrinking/closing businesses.
- Rising interest rates in the commercial mortgage space have resulted in diminished refinancing activity. Also, fewer sales or investment transactions are moving forward due to a disconnect between buyer and seller expectations. One client who was thinking of buying a larger warehouse for his business is now waiting due to uncertainty and the expectation that real estate pricing may be lower in 2023.
- We're in the commercial real estate investment business, including managing and leasing existing income properties and doing land development projects including build-to-suit development. Leasing activity has remained strong through November, with some increases in rental rates. Tenant improvements costs have continued to increase but show signs of stabilizing. We are planning major capital improvements to two of our retail shopping centers in 2023. Demand for pad sites within our land development projects remains robust but only from major national chains. Prices [have been] achieved and rental rates remain strong. We lost one employee this fall and are losing another at the end of the year. We are recruiting to replace these two positions this year or in early 2023.
- Rising interest rates will likely cause some customers to have issues.
- A new bookkeeper quit after two weeks saying she wanted better work/life balance and more training. We paid her what she asked for and she sat learning with her predecessor for the entire first week. Meanwhile, our company was just named the No. 1 top workplace in Houston (per anonymous employee surveys). This is the labor market we are dealing with.
- The stability and peaceful results of the election were a definite positive for public sentiment, which we think will drive a positive retail environment for the holiday season.
- Government announcements of delays in 2023 contract opportunities require the Department of Defense and Federal Civilian Agency support contractors to relook at our revenue stream forecast. Many are aggressively looking to diversify within complementary business areas to maintain growth and remain competitive.
- Firm owners and high-level managers are working harder and longer to pick up slack in productivity due to remote-work accountability and child/elderly care demands. Due to transmittable diseases and worker shortage, daycare centers and preschools are shutting down more frequently with only one day’s notice and causing major disruptions to working parents.
- Rate increases and client uncertainty are slowing our business. The uncertainty is the bigger problem. How bad will it get? The world seems more volatile now.
- We feel that this is cyclical. Information technology services are still in demand and will continue in the long run.
- With the tech layoffs going on, it has created some opportunity to find good human resources.
- High inflation and regulations are increasing costs for our clients, who are in turn putting pressure on us and other suppliers to cut costs.
- The general outlook of a recession has increased uncertainty across the board.
- Until the capital markets can figure out where the interest rates are going to land, the real estate market will be at a standstill. We are now hearing from our clients that it may take 12–18 months to figure this out. Not good for real estate.
- Despite attention on inflation, logistics, energy prices, interest rates and expected recession, clients continue to experience improving financial performance. [There is a] continuing shortage of skilled labor and an increase in wages/benefits.
- More and more people expect to be in a recession soon, and companies are preparing for it by spending less.
- [There has been an] increase in business due to vertical expansion into a different market segment.
- The corporate aviation sector has increased its work requests due to year-end budgets that need to be exhausted. Machine shop requests for quote for industrial parts have decreased from last month. Machine shop requests for quote for aviation-related parts have remained consistent from last month. Oil industry requests for quote have decreased from last month. Military inspection requests have remained consistent from last month. The overall business has increased, with potential customers reaching out for quotes. Employment of "qualified" technicians has increased, with double the number of applicants as compared with last month. We are finding that more companies across the board are becoming slower on their payment terms of 30 days. Now, we have companies paying at 60–90 days with no reasons provided.
- Hiring new labor is nonexistent. We don't even advertise anymore. It's too expensive, and the results are virtually nothing.
- With the slowdown in manufacturing and consumer purchasing, commodity pricing has decreased, causing orders for supply to be curtailed. This is forcing our company to look for warehousing space to store produced goods until markets improve. Industry experts anticipate that to begin in spring 2023.
- Costs of financing and costs of construction materials are adversely impacting construction projects that cannot be delayed. Future long-range refinancing plans face increased risks, and access to the state bond guarantee program is likely to close in the near future. Labor market shortages for qualified teachers and special programs professionals continue to drive up costs as employees opt to offer services as higher-paid independent contractors outside of the state pension system.
- Our six-month forecast has improved due to a strong application pipeline for spring. Uncertainty is decreasing due to election results and early signs of moderating inflation.
- The global food shortage is negatively impacting the entire food industry. Food banks are struggling to feed low-income people. In El Paso, the situation has become dire, and we are down to four days of emergency food supplies for this community. We continue to ration food, but the food inventory continues to dwindle at an alarming rate.
- Inflationary pricing has increased by more than 20 percent, with no revenue/rate increases from insurance companies for years. Labor market is still tight but appears to be loosening up a little. Tripledemic [flu, RSV and COVID] appears to be taking hold, with a significant uptick in flu infections. [There is] a lot of lost work time due to illness of employees and their families.
- We are still having staffing issues. [We are] still unable to get fully staffed.
- Lack of business travel and [employees] back to the office are still huge issues for revenue. Payroll, cost of goods and expenses all continue to increase. Business levels remain low, so it is not wise to increase prices. Employee turnover is incredibly high. Employees just disappear after some training, or if they make it to schedule, they disappear after a short period of time never to be heard from again.
- The higher interest rates continue to slow young first-time buyers. Older cash buyers have become cautious and are holding back on purchasing a larger home.
- Uncertainty has increased over the past few months due to concerns about the potential impact of a recession on our business.
- We are just focusing on the things we can control. Consumer activity continues to remain strong, although it does seem that some customers are a little more frazzled than just a few months ago. [There is] definitely more stress in the air.
- Higher interest rates are having a significant negative effect on used-vehicle sales. We are also seeing more cash payments for vehicles versus financing. New-vehicle product is still very difficult to get, and customers to some degree are experiencing "buyer fatigue" from the long waits. They are simply postponing their purchases.
- Sales revenue is still constrained by the chip shortage, which limits inventory supply.
- [I’m] very concerned that we are in for a tough stretch as the Federal Reserve is out of touch with reality. Interest rates doubled within a short period of time. Expenses are increasing at a rapid pace. Pressure on margins will drive down profitability.
- Interest rate hikes have put the brakes on our shoppers.
- Higher prices due to inflation are finally starting to hit home with my restaurant customers. Perhaps it's price fatigue, but we are starting to see pushback that can't be ignored. While we're starting to see price easing at the wholesale level, particularly chicken, the current market has been building for 12 months or more, and the restaurants won't see their prices fall for another 30–60 days.
- Commodity prices have stabilized, and cost of goods sold has increased marginally. [We are] still seeing some supply-chain issues. Business activity has picked up month over month.
- The Federal Reserve has lost its way and needs to stop increasing rates and let the economy and employment settle. The Federal Reserve actively participated in causing this inflationary cycle by its aggressive and irrational buying of mortgage-backed securities that represent 30 percent of its portfolio. Continuing on this path will cause a recession and leave the Federal Reserve with little options. Raising rates as the Federal Reserve has done has cost the U.S. Treasury untold sums to finance the government. If the Federal Reserve governors had any self-respect or integrity, they would resign.
- Amazing how fast our business has slowed down after all the negative talk about the homebuilding business. Numbers are down 23 percent in October from September this year and trending the same for November, so it’s hard to know just where this market is going. We’re adjusting on hiring, inventory and capital expenditures, but it is just amazing as there is still a demand for housing in the Texas market; hopefully, when the shock of the markets settles in, we will have some type of normal. I think the Federal Reserve made too much of a drastic move that does nothing to address inflation in food and energy.
- Rates are rising too fast. We are going to have a hard landing.
- New laws that have been aimed at holding pharmacy benefit managers more accountable and freeing up competition within the health care industry have helped lessen the burdens for specialty pharmacies. Inflation-based price hikes have created an incentive for employees to demand higher wages or remote [working] accommodations. This has led to attrition from employees to reduce fuel costs and cover increased rent, groceries, etc.
- I am very concerned about the inability to hire employees, especially truck drivers. If we have an employee get sick, we will have difficulty.
Historical Data
Historical data can be downloaded dating back to January 2007.
Indexes
Download indexes for all indicators. For the definitions of all variables, see Data Definitions.
Texas Service Sector Outlook Survey |
Texas Retail Outlook Survey |
| Unadjusted | Unadjusted |
| Seasonally adjusted | Seasonally adjusted |
All Data
Download indexes and components of the indexes (percentage of respondents reporting increase, decrease, or no change). For the definitions of all variables, see Data Definitions.
Texas Service Sector Outlook Survey |
Texas Retail Outlook Survey |
| Unadjusted | Unadjusted |
| Seasonally adjusted | Seasonally adjusted |
Questions regarding the Texas Service Sector Outlook Survey can be addressed to Jesus Cañas at jesus.canas@dal.frb.org.
Sign up for our email alert to be automatically notified as soon as the latest Texas Service Sector Outlook Survey is released on the web.