
Texas Service Sector Outlook Survey
Texas service sector activity accelerates
For this month’s survey, Texas business executives were asked supplemental questions on the labor market. Results for these questions from the Texas Manufacturing Outlook Survey, Texas Service Sector Outlook Survey and Texas Retail Outlook Survey have been released together. Read the special questions results.
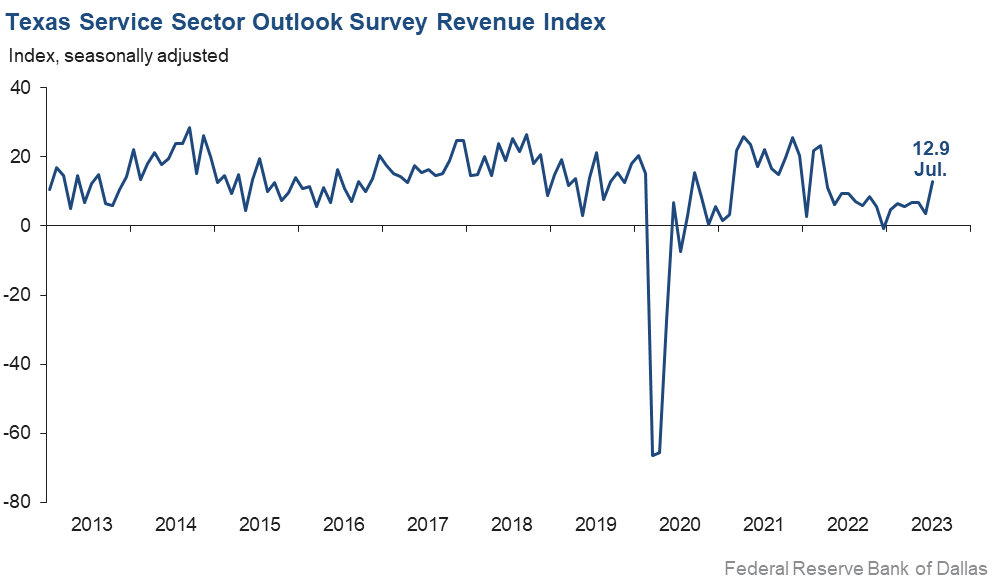
Growth in Texas service sector activity expanded at a faster pace in July, according to business executives responding to the Texas Service Sector Outlook Survey. The revenue index, a key measure of state service sector conditions, rose nine points to 12.9, the highest level in 16 months.
Labor market indicators pointed to steady employment growth and longer workweeks. The employment index remained at 9.2, indicating the same employment growth as the previous month. The part-time employment index fell three points to -0.6, while the hours worked index rose four points to 3.5.
Perceptions of broader business conditions were mixed in July. The general business activity index remained negative but increased four points to -4.2. The company outlook index increased to 0.5, with the near-zero figure indicating company outlooks were no longer worsening and held mostly steady in July. The outlook uncertainty index ticked down three points to 10.9—below its series average of 13.5.
Price and wage pressures eased modestly in July. The input prices index ticked down from 35.0 to 31.7, and the selling prices index decreased three points to 9.9, though both indexes remained above their series averages. The wages and benefits index inched down two points to 16.7—still slightly above its average reading of 15.7.
Respondents’ expectations regarding future business activity improved in July. The future general business activity index moved into positive territory for the first time in 15 months, improving from -1.6 to 4.4. The future revenue index stayed positive and relatively unchanged at 35.6. Other future service sector activity indexes such as employment and capital expenditures displayed mixed movements but remained in positive territory—reflecting expectations for continued growth in the next six months.

Texas Retail Outlook Survey
Texas retail sales continue to decline in July
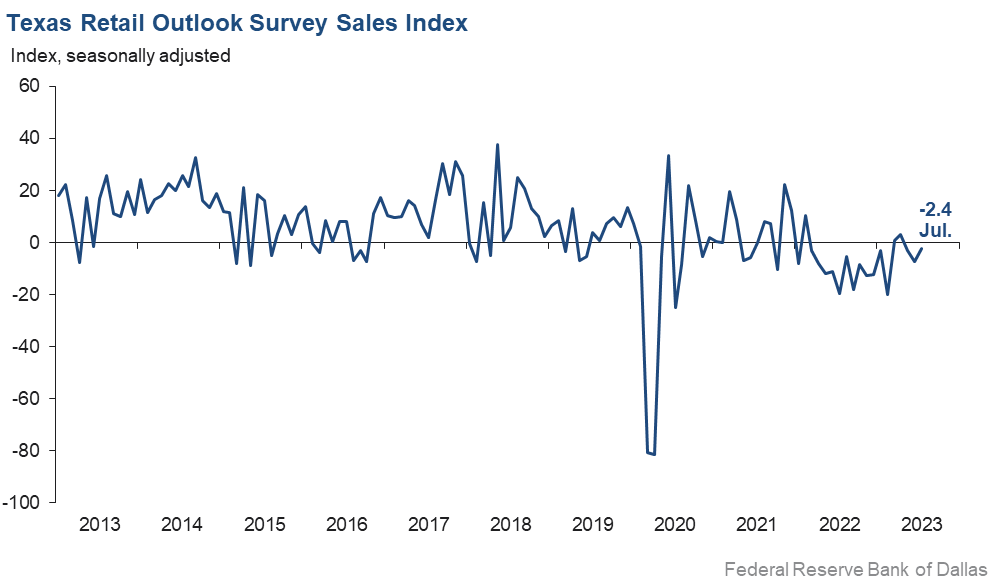
Retail sales declined in July, according to business executives responding to the Texas Retail Outlook Survey. The sales index, a key measure of state retail activity, improved five points to -2.4 suggesting sales decreased at a slower rate than the previous month. Retailers’ inventories increased at a faster rate, with the index increasing from 5.3 to 12.0.
Retail labor market indicators reflected slower employment growth and continued shortening of workweeks in July. The employment index dropped nine points to 3.2, and the part-time employment index decreased three points to -1.3. The hours worked index fell from -2.3 to -7.6.
Retailers’ perceptions of broader business conditions worsened in July. The general business activity index plunged 18 points to -18.1, and the company outlook index fell 10 points to -10.4. The outlook uncertainty index jumped from 6.6 to 24.6.
Price and wage pressures eased in July. The selling prices index dropped seven points to 8.4, and the input prices index declined six points to 20.3. The wages and benefits index decreased from 17.9 to 10.5.
Expectations for future retail growth improved in July. The future sales index remained in positive territory at 15.1, and the future general business activity index rose five points to 5.0. Other indexes of future retail activity such as employment remained in positive territory, reflecting expectations for continued growth in retail activity later in the year.
The Texas Retail Outlook Survey is a component of the Texas Service Sector Outlook Survey that uses information only from respondents in the retail and wholesale sectors.
Next release: August 29, 2023
Data were collected July 18–26, and 285 Texas service sector business executives, of which 57 were retailers, responded to the survey. The Dallas Fed conducts the Texas Service Sector Outlook Survey monthly to obtain a timely assessment of the state’s service sector activity. Firms are asked whether revenue, employment, prices, general business activity and other indicators increased, decreased or remained unchanged over the previous month.
Survey responses are used to calculate an index for each indicator. Each index is calculated by subtracting the percentage of respondents reporting a decrease from the percentage reporting an increase. When the share of firms reporting an increase exceeds the share reporting a decrease, the index will be greater than zero, suggesting the indicator has increased over the prior month. If the share of firms reporting a decrease exceeds the share reporting an increase, the index will be below zero, suggesting the indicator has decreased over the prior month. An index will be zero when the number of firms reporting an increase is equal to the number of firms reporting a decrease. Data have been seasonally adjusted as necessary.
Texas Service Sector Outlook Survey
Historical data are available from January 2007 to the most current release month.
| Business Indicators Relating to Facilities and Products in Texas Current (versus previous month) | ||||||||
| Indicator | Jul Index | Jun Index | Change | Series Average | Trend* | % Reporting Increase | % Reporting No Change | % Reporting Decrease |
Revenue | 12.9 | 3.6 | +9.3 | 11.0 | 7(+) | 30.4 | 52.1 | 17.5 |
Employment | 9.2 | 9.2 | 0.0 | 6.6 | 4(+) | 17.1 | 75.0 | 7.9 |
Part–Time Employment | –0.6 | 2.2 | –2.8 | 1.5 | 1(–) | 4.9 | 89.6 | 5.5 |
Hours Worked | 3.5 | –0.9 | +4.4 | 2.8 | 1(+) | 10.7 | 82.1 | 7.2 |
Wages and Benefits | 16.7 | 18.6 | –1.9 | 15.7 | 38(+) | 23.0 | 70.7 | 6.3 |
Input Prices | 31.7 | 35.0 | –3.3 | 27.7 | 39(+) | 36.2 | 59.3 | 4.5 |
Selling Prices | 9.9 | 12.8 | –2.9 | 7.6 | 36(+) | 18.1 | 73.7 | 8.2 |
Capital Expenditures | 8.9 | 13.4 | –4.5 | 10.1 | 36(+) | 15.0 | 78.9 | 6.1 |
| General Business Conditions Current (versus previous month) | ||||||||
| Indicator | Jul Index | Jun Index | Change | Series Average | Trend** | % Reporting Improved | % Reporting No Change | % Reporting Worsened |
Company Outlook | 0.5 | –1.4 | +1.9 | 4.7 | 1(+) | 16.6 | 67.3 | 16.1 |
General Business Activity | –4.2 | –8.2 | +4.0 | 2.9 | 14(–) | 16.5 | 62.8 | 20.7 |
| Indicator | Jul Index | Jun Index | Change | Series Average | Trend* | % Reporting Increase | % Reporting No Change | % Reporting Decrease |
Outlook Uncertainty | 10.9 | 13.4 | –2.5 | 13.5 | 26(+) | 21.5 | 67.9 | 10.6 |
| Business Indicators Relating to Facilities and Products in Texas Future (six months ahead) | ||||||||
| Indicator | Jul Index | Jun Index | Change | Series Average | Trend* | % Reporting Increase | % Reporting No Change | % Reporting Decrease |
Revenue | 35.6 | 34.3 | +1.3 | 37.6 | 39(+) | 49.9 | 35.8 | 14.3 |
Employment | 29.7 | 23.4 | +6.3 | 23.2 | 39(+) | 37.4 | 54.9 | 7.7 |
Part–Time Employment | 5.4 | 0.7 | +4.7 | 6.8 | 3(+) | 11.5 | 82.4 | 6.1 |
Hours Worked | 2.2 | 5.1 | –2.9 | 5.9 | 39(+) | 9.0 | 84.2 | 6.8 |
Wages and Benefits | 41.8 | 42.6 | –0.8 | 37.4 | 39(+) | 45.4 | 51.0 | 3.6 |
Input Prices | 43.8 | 40.7 | +3.1 | 44.6 | 199(+) | 49.4 | 45.0 | 5.6 |
Selling Prices | 25.9 | 24.2 | +1.7 | 24.6 | 39(+) | 34.5 | 56.9 | 8.6 |
Capital Expenditures | 12.6 | 17.7 | –5.1 | 23.3 | 38(+) | 21.4 | 69.7 | 8.8 |
| General Business Conditions Future (six months ahead) | ||||||||
| Indicator | Jul Index | Jun Index | Change | Series Average | Trend** | % Reporting Improved | % Reporting No Change | % Reporting Worsened |
Company Outlook | 11.9 | 7.0 | +4.9 | 15.8 | 2(+) | 27.6 | 56.7 | 15.7 |
General Business Activity | 4.4 | –1.6 | +6.0 | 12.5 | 1(+) | 22.0 | 60.4 | 17.6 |
Historical data are available from January 2007 to the most current release month.
| Business Indicators Relating to Facilities and Products in Texas Retail (versus previous month) | ||||||||
| Indicator | Jul Index | Jun Index | Change | Series Average | Trend* | % Reporting Increase | % Reporting No Change | % Reporting Decrease |
| Retail Activity in Texas | ||||||||
Sales | –2.4 | –7.2 | +4.8 | 4.3 | 3(–) | 30.4 | 36.8 | 32.8 |
Employment | 3.2 | 12.2 | –9.0 | 1.9 | 2(+) | 14.2 | 74.8 | 11.0 |
Part–Time Employment | –1.3 | 2.1 | –3.4 | –1.6 | 1(–) | 8.1 | 82.5 | 9.4 |
Hours Worked | –7.6 | –2.3 | –5.3 | –1.9 | 8(–) | 5.1 | 82.2 | 12.7 |
Wages and Benefits | 10.5 | 17.9 | –7.4 | 11.2 | 36(+) | 17.5 | 75.5 | 7.0 |
Input Prices | 20.3 | 26.6 | –6.3 | 22.6 | 39(+) | 32.0 | 56.3 | 11.7 |
Selling Prices | 8.4 | 15.2 | –6.8 | 13.9 | 38(+) | 24.8 | 58.8 | 16.4 |
Capital Expenditures | –0.2 | 13.9 | –14.1 | 8.0 | 1(–) | 10.7 | 78.4 | 10.9 |
Inventories | 12.0 | 5.3 | +6.7 | 2.4 | 14(+) | 28.6 | 54.8 | 16.6 |
| Companywide Retail Activity | ||||||||
Companywide Sales | –11.9 | –4.8 | –7.1 | 5.6 | 17(–) | 23.2 | 41.8 | 35.1 |
Companywide Internet Sales | –6.7 | –13.0 | +6.3 | 4.5 | 10(–) | 15.8 | 61.7 | 22.5 |
| General Business Conditions, Retail Current (versus previous month) | ||||||||
| Indicator | Jul Index | Jun Index | Change | Series Average | Trend** | % Reporting Improved | % Reporting No Change | % Reporting Worsened |
Company Outlook | –10.4 | –0.7 | –9.7 | 2.3 | 17(–) | 12.0 | 65.6 | 22.4 |
General Business Activity | –18.1 | 0.4 | –18.5 | –1.6 | 1(–) | 14.3 | 53.3 | 32.4 |
| Outlook Uncertainty Current (versus previous month) | ||||||||
| Indicator | Jul Index | Jun Index | Change | Series Average | Trend* | % Reporting Increase | % Reporting No Change | % Reporting Decrease |
Outlook Uncertainty | 24.6 | 6.6 | +18.0 | 11.1 | 26(+) | 31.6 | 61.4 | 7.0 |
| Business Indicators Relating to Facilities and Products in Texas, Retail Future (six months ahead) | ||||||||
| Indicator | Jul Index | Jun Index | Change | Series Average | Trend* | % Reporting Increase | % Reporting No Change | % Reporting Decrease |
| Retail Activity in Texas | ||||||||
Sales | 15.1 | 18.4 | –3.3 | 31.2 | 2(+) | 36.5 | 42.1 | 21.4 |
Employment | 14.2 | 6.5 | +7.7 | 13.0 | 39(+) | 24.1 | 66.0 | 9.9 |
Part–Time Employment | –8.2 | –0.8 | –7.4 | 1.5 | 8(–) | 8.8 | 74.2 | 17.0 |
Hours Worked | –3.7 | –5.4 | +1.7 | 2.6 | 10(–) | 10.2 | 75.9 | 13.9 |
Wages and Benefits | 25.2 | 27.6 | –2.4 | 29.1 | 39(+) | 30.3 | 64.6 | 5.1 |
Input Prices | 17.0 | 17.6 | –0.6 | 34.1 | 39(+) | 34.0 | 49.1 | 17.0 |
Selling Prices | 11.3 | 8.8 | +2.5 | 29.5 | 39(+) | 30.2 | 50.9 | 18.9 |
Capital Expenditures | 0.0 | 3.5 | –3.5 | 17.3 | 1() | 13.7 | 72.5 | 13.7 |
Inventories | 10.7 | 18.2 | –7.5 | 10.8 | 39(+) | 29.3 | 52.1 | 18.6 |
| Companywide Retail Activity | ||||||||
Companywide Sales | 22.3 | 12.0 | +10.3 | 29.8 | 2(+) | 32.7 | 56.9 | 10.4 |
Companywide Internet Sales | 17.7 | 0.0 | +17.7 | 21.7 | 1(+) | 24.4 | 68.9 | 6.7 |
| General Business Conditions, Retail Future (six months ahead) | ||||||||
| Indicator | Jul Index | Jun Index | Change | Series Average | Trend** | % Reporting Improved | % Reporting No Change | % Reporting Worsened |
Company Outlook | 5.1 | 6.0 | –0.9 | 15.6 | 2(+) | 21.4 | 62.3 | 16.3 |
General Business Activity | 5.0 | –0.2 | +5.2 | 11.0 | 1(+) | 22.0 | 60.9 | 17.0 |
*Shown is the number of consecutive months of expansion or contraction in the underlying indicator. Expansion is indicated by a positive index reading and denoted by a (+) in the table. Contraction is indicated by a negative index reading and denoted by a (–) in the table.
**Shown is the number of consecutive months of improvement or worsening in the underlying indicator. Improvement is indicated by a positive index reading and denoted by a (+) in the table. Worsening is indicated by a negative index reading and denoted by a (–) in the table.
Data have been seasonally adjusted as necessary.
Texas Service Sector Outlook Survey
Texas Retail Outlook Survey
Texas Service Sector Outlook Survey
Comments from survey respondents
These comments are from respondents’ completed surveys and have been edited for publication.
- The federal government contracting agencies continue to face personnel shortages, which have a direct impact on solicitation announcements and timely contract awards.
- We just had the best quarter in our history, so in comparison, this month is down, but the activity level is still good.
- We are seeing strong economic activity growth, mostly in the U.S., and increases in our sales after many years of stagnant growth and a decrease during COVID. Our company's best year may be 2023 among the last 10 years.
- Recent price increases from suppliers were unexpected and later than we would have expected. We expected supplier price increases would occur in the fourth quarter of 2022 and the first two quarters of 2023. This has forced unplanned selling price increases to maintain margins.
- Real estate developers seem emboldened by the good news on jobs and less worried about interest rates. There's some movement in projects to the good.
- It seems that things are continuing to be uncertain, and while we have an eye to protect the business against financial decline, we are also doubling down with innovation, marketing and process to take advantage of opportunities we see developing over the next 18 months.
- Health insurance costs will continue to exceed inflation for us. We laid off 20 percent of our staff last month, which was unpleasant. We are innovating in artificial intelligence to add capability, which may sell well, we hope.
- We are starting to see softening in manufacturing, chemical production and other markets that signal softening of demand for our engineering services starting six months from now.
- Since the debt ceiling increase caused issues with budget adoption and the defense budget, we continue to see the consequences. Doubt about Congress’ ability to timely meet obligations will impact government contractors.
- We have seen a slight uptick in corporate transactions. Litigation and bankruptcy remain strong.
- With the high cost of borrowing, we’re seeing a decrease in capital spending projections from our clients. We expect significant budget shrinkage for 2024.
- Until we know interest rate increases are done, the real estate market will remain sluggish. Hopefully, what has already been done is enough to bring inflation under control and no more hikes will be needed. I do have to say that the overall market is feeling a little better, but we are not out of the woods yet.
- There’s no meaningful change in outlook in the near term. Expectations over the next six months to a year have improved, however. Clients continue to report improving sales and margins, reflecting a positive overview of the market and economy.
- We have no idea what to expect from the job and labor market. One minute it feels solid and strong, companies are hiring, and the next it feels as if there are no qualified candidates looking for work and companies are slow-rolling their hiring. Since we're in the business of people, it is challenging at best.
- I’m cautiously optimistic that we might get the elusive Goldilocks soft landing after all.
- We have government contracts that, once awarded, do not change.
- Stresses due to cost increases in health insurance will cause us to look at cutting benefits while raising hourly wages.
- We have noticed some slowdown across all sectors. This slowdown does line up with our yearly numbers; we are not greatly concerned.
- Once manufacturing rebounds, the ripple effect will improve our business and revenue.
- Selling prices are controlled by state regulations, and we will not be able to increase them for two years. Budgets and state support will not increase to cover impacts of inflation and supply issues. However, the outlook is positive for six months ahead due to the likelihood of voter approval of a new Texas University Fund which, if passed, would bring additional resources.
- Business activity/revenue is the lowest it has been in three years.
- Profit margins continue to contract; we may need to lay off employees in the third quarter.
- We are struggling with lower-than-expected business demand. The heat and international travel are hurting our domestic demand. We are watching our expenses very closely in hopes of minimizing our losses.
- The greatest issue is access to capital. We are having trouble getting traditional bank financing for working capital needs, and credit cards are bearing the weight to get through slow months, with interest rates higher than 20 percent.
- We pay a lot of worldwide economists for advice on the economy. Every one of them was saying a recession was imminent six weeks ago, and today we can't find any of them. It's like the recession concern just evaporated! We still think a recession is coming. Our construction machinery dealership is ahead of last year by 28 percent through June, so we are having another great year, but costs are higher and harder to pass on.
- It feels that the economy is getting better.
- The supply chain remains the main concern.
- The outlook is very stable now.
- Momentum continues to grow for the utilization of intelligent platform training and enabling apps for military use. The U.S., plus the Middle East, Africa and the European Union, have shown more upside recently.
- We see: reduced leasing demand and occupancy rates for office space; increased cost of financing and reduced enthusiasm for lending; reduced demand from prospective buyers—and then only at lower prices. However, rent for office/flex/warehouse and retail properties increased during the first half of 2023.
- As we predicted, clients who own the multifamily properties we manage are starting to fail due to higher debt service and insurance costs. As a result, our business is suffering right now. Longer term—after a ton of equity is wiped out, property values reset, and lenders or new owners take over—we expect to be called in to fix things, which will be good for us. The sooner lenders get out of denial and start dealing with problem borrowers, the sooner we can all get past this. Every day they wait the value of the underlying assets is diminishing.
- We think the Federal Reserve is doing a great job working us to a soft landing, but it will take longer to achieve their goals on inflation due to the large amount of growth in so many industries, the reshoring of production from China to North America, all our major infrastructure investments, and the lack of willing and qualified workers entering the workforce.
- Our outlook for first quarter 2024 has improved as the Federal Reserve appears closer to the end of rate hikes.
- The interest expense has certainly increased the cost of doing business, requiring an increase in the price of the product to the customer. This has in turn resulted in a slowdown of business activity. The trend of expanding regulation is and will continue to increase overhead and further restrict business development.
- The labor shortage is really hurting us. We need to hire one or two more drivers badly. All my applicants are job hoppers; they average about one different job per year.
- Interest rates and declining lumber prices have affected our inventory and gross margins. Labor shortages in the trades have also slowed down construction, which has affected our volume.
- Higher interest rates are increasing company expense for inventory financing and affecting the middle-income customer buying used cars.
- Affordability of new vehicles is a major concern. Inflation and increased interest rates are making it very difficult for potential customers to afford payments.
- Interest rate hikes have stymied car loans.
- Heat has become an issue in July. Store activity has slowed because of the weather. Rain and cooler temperatures will help. Wage increases have slowed down. New hires will take a little less money if guaranteed a 40-hour workweek.
- We ship to Puerto Rico, and we are seeing lower sales activity there. Discussion among our industry partners suggests the end of COVID protocols in May has led to decreased consumer spending. Seasonally, this would normally be a time of increasing summer sales.
- We have decided to focus on the information technology side of health care to circumvent the oligopoly existing today. There is a bottleneck which occurs for health care professionals trying to communicate with big-chain pharmacies like CVS and Walgreens. We have created a solution that eliminates that headache. This is the only way for smaller independent pharmacies to fight in the market. Otherwise, big chains will control the cost of drugs and spikes in the price of antibiotics will simply be blamed on inflation rather than a lack of transparency.
- While we have not seen it yet, the impact of higher rates is likely going to be a factor in the second half of the year.
Historical Data
Historical data can be downloaded dating back to January 2007.
Indexes
Download indexes for all indicators. For the definitions of all variables, see data definitions.
Texas Service Sector Outlook Survey |
Texas Retail Outlook Survey |
| Unadjusted | Unadjusted |
| Seasonally adjusted | Seasonally adjusted |
All Data
Download indexes and components of the indexes (percentage of respondents reporting increase, decrease, or no change). For the definitions of all variables, see data definitions.
Texas Service Sector Outlook Survey |
Texas Retail Outlook Survey |
| Unadjusted | Unadjusted |
| Seasonally adjusted | Seasonally adjusted |
Questions regarding the Texas Service Sector Outlook Survey can be addressed to Jesus Cañas at jesus.canas@dal.frb.org.
Sign up for our email alert to be automatically notified as soon as the latest Texas Service Sector Outlook Survey is released on the web.