
Texas Service Sector Outlook Survey
Texas service sector activity declines in November
For this month’s survey, Texas business executives were asked supplemental questions on operating margins and expected demand. Results for these questions from the Texas Manufacturing Outlook Survey, Texas Service Sector Outlook Survey and Texas Retail Outlook Survey have been released together. Read the special questions results.
Texas service sector activity contracted in November for the first time since December 2022, according to business executives responding to the Texas Service Sector Outlook Survey. The revenue index, a key measure of state service sector conditions, fell three points to -2.4.
Labor market indicators pointed to a pickup in employment growth and a largely stable workweek. The employment index increased from 0.1 to 5.7 in November. The part-time employment index moved up to 1.2, while the hours worked index held mostly steady at -0.9.
Respondents in November continued to perceive worsening broader business conditions, though pessimism waned slightly. The general business activity index improved from -18.2 to -11.6, while the company outlook index increased from -12.8 to -8.1. The outlook uncertainty index dropped to 10.4.
Input price pressures eased while selling price pressures picked up slightly. Wage growth remained unchanged in November. The input prices index fell five points to 32.1 and the selling prices index increased two points to 11.3, with both indexes exceeding their respective series averages. The wages and benefits index was flat at 16.8, approaching its average reading of 15.8.
Respondents’ expectations regarding future service sector activity were mixed in November. The future general business activity index remained in negative territory but improved to -7.8. The future revenue index remained positive and increased two points to 28.2. Other future service sector activity indexes such as employment and capital expenditures remained in positive territory, reflecting expectations for continued growth in the next six months.

Texas Retail Outlook Survey
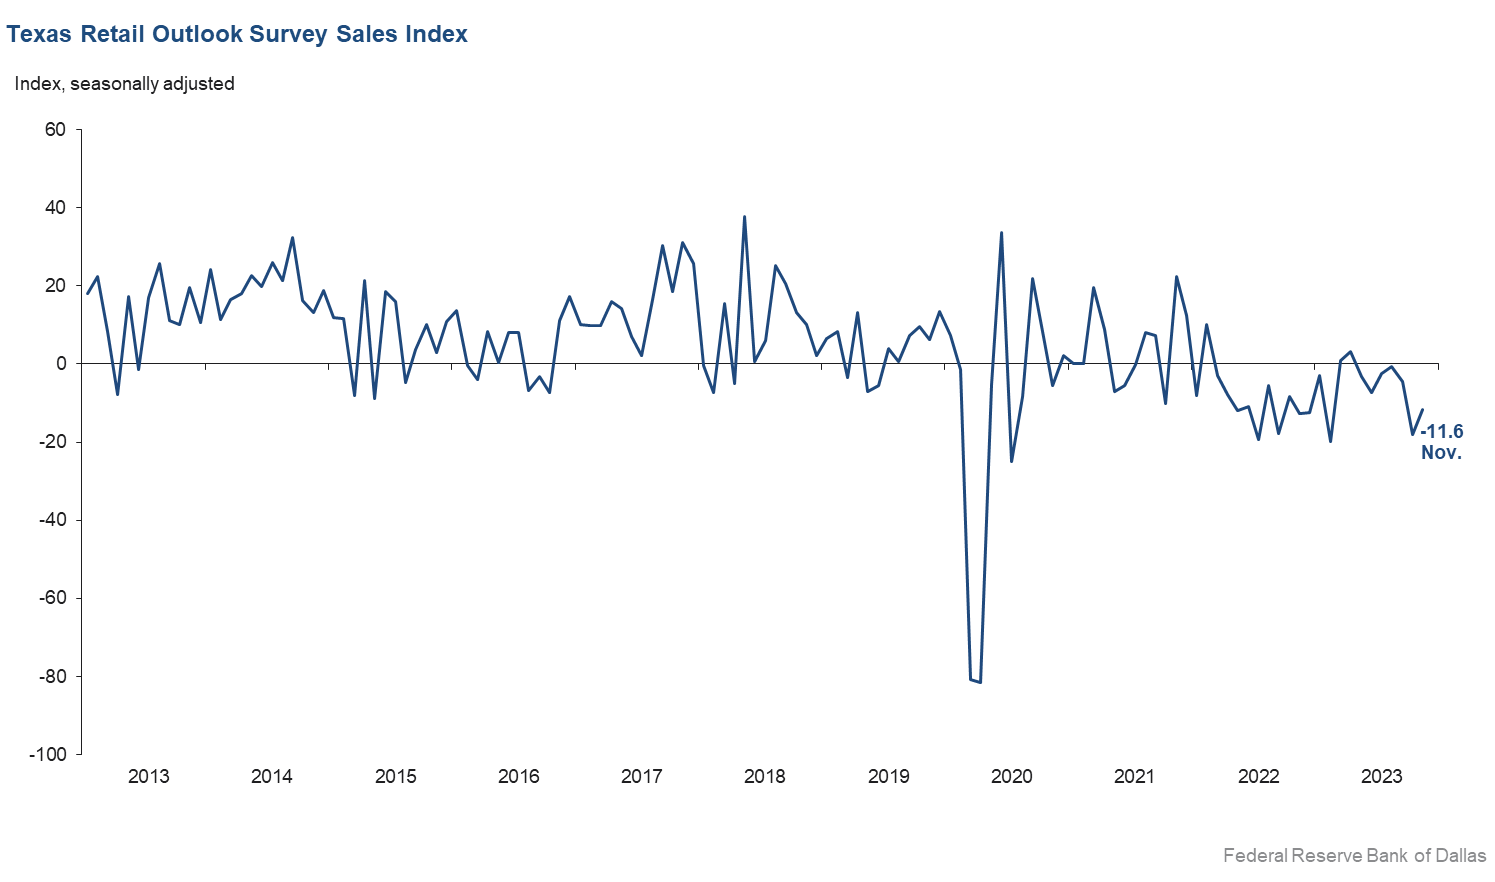
Texas retail sales fall again
Retail sales declined in November, according to business executives responding to the Texas Retail Outlook Survey. The sales index, a key measure of state retail activity, remained in negative territory, but increased from -18.1 to -11.6 indicating retail sales fell at a slower pace than the previous month. Retailers’ inventories increased, with the index moving up from -2.4 to 8.3.
Retail labor market indicators reflected a pickup in employment growth and continued shortening of workweeks in November. The employment index increased 18 points to 5.4 while the part-time employment index rose nine points to 3.6. The hours worked index increased from -12.1 to -4.7.
Retailers continued to perceive a worsening of broader business conditions in November, but pessimism waned. The general business activity index improved from -23.0 to -11.8, while the company outlook index increased from -11.9 to -9.3. The outlook uncertainty index dropped from 23.1 to zero, signaling that uncertainty did not change from the previous month.
Price pressures eased while wage pressures rose in November. The selling prices index fell three points to 12.9 while the input prices index dropped two points to 25.2. The wages and benefits index jumped from 2.9 to 10.0.
Expectations for future retail growth were mixed in October. The future general business activity index fell further to -11.7, reflecting worsened expectations. The future sales index fell from 11.0 to 6.6, yet the positive reading indicates continued growth. Other indexes of future retail activity, such as employment and capital expenditures, showed mixed movements, with the future employment index inching up to 2.5, while the future capital expenditures index dropped 4 points to zero.
Next release: December 27, 2023
Data were collected November 13–21, and 281 Texas service sector business executives, of which 58 were retailers, responded to the survey. The Dallas Fed conducts the Texas Service Sector Outlook Survey monthly to obtain a timely assessment of the state’s service sector activity. Firms are asked whether revenue, employment, prices, general business activity and other indicators increased, decreased or remained unchanged over the previous month.
Survey responses are used to calculate an index for each indicator. Each index is calculated by subtracting the percentage of respondents reporting a decrease from the percentage reporting an increase. When the share of firms reporting an increase exceeds the share reporting a decrease, the index will be greater than zero, suggesting the indicator has increased over the prior month. If the share of firms reporting a decrease exceeds the share reporting an increase, the index will be below zero, suggesting the indicator has decreased over the prior month. An index will be zero when the number of firms reporting an increase is equal to the number of firms reporting a decrease. Data have been seasonally adjusted as necessary.
Data have been seasonally adjusted as necessary.
Texas Service Sector Outlook Survey
Historical data are available from January 2007 to the most current release month.
| Business Indicators Relating to Facilities and Products in Texas Current (versus previous month) | ||||||||
| Indicator | Nov Index | Oct Index | Change | Series Average | Trend* | % Reporting Increase | % Reporting No Change | % Reporting Decrease |
Revenue | –2.4 | 0.7 | –3.1 | 10.9 | 1(–) | 24.1 | 49.5 | 26.5 |
Employment | 5.7 | 0.1 | +5.6 | 6.5 | 8(+) | 16.3 | 73.1 | 10.6 |
Part–Time Employment | 1.2 | –3.4 | +4.6 | 1.5 | 1(+) | 7.8 | 85.6 | 6.6 |
Hours Worked | –0.9 | –1.3 | +0.4 | 2.7 | 2(–) | 6.9 | 85.3 | 7.8 |
Wages and Benefits | 16.8 | 17.0 | –0.2 | 15.8 | 42(+) | 21.3 | 74.2 | 4.5 |
Input Prices | 32.1 | 37.3 | –5.2 | 27.9 | 43(+) | 35.8 | 60.5 | 3.7 |
Selling Prices | 11.3 | 9.5 | +1.8 | 7.7 | 40(+) | 20.4 | 70.5 | 9.1 |
Capital Expenditures | 4.1 | 7.1 | –3.0 | 10.0 | 40(+) | 15.8 | 72.6 | 11.7 |
| General Business Conditions Current (versus previous month) | ||||||||
| Indicator | Nov Index | Oct Index | Change | Series Average | Trend** | % Reporting Improved | % Reporting No Change | % Reporting Worsened |
Company Outlook | –8.1 | –12.8 | +4.7 | 4.5 | 4(–) | 10.9 | 70.1 | 19.0 |
General Business Activity | –11.6 | –18.2 | +6.6 | 2.7 | 18(–) | 14.4 | 59.6 | 26.0 |
| Indicator | Nov Index | Oct Index | Change | Series Average | Trend* | % Reporting Increase | % Reporting No Change | % Reporting Decrease |
Outlook Uncertainty | 10.4 | 23.0 | –12.6 | 13.6 | 30(+) | 22.2 | 66.0 | 11.8 |
| Business Indicators Relating to Facilities and Products in Texas Future (six months ahead) | ||||||||
| Indicator | Nov Index | Oct Index | Change | Series Average | Trend* | % Reporting Increase | % Reporting No Change | % Reporting Decrease |
Revenue | 28.2 | 26.6 | +1.6 | 37.5 | 43(+) | 45.6 | 36.9 | 17.4 |
Employment | 17.6 | 22.0 | –4.4 | 23.2 | 43(+) | 31.0 | 55.6 | 13.4 |
Part–Time Employment | 0.5 | 3.2 | –2.7 | 6.7 | 7(+) | 10.1 | 80.3 | 9.6 |
Hours Worked | 4.9 | 1.1 | +3.8 | 5.9 | 43(+) | 10.2 | 84.5 | 5.3 |
Wages and Benefits | 37.2 | 37.5 | –0.3 | 37.5 | 43(+) | 41.3 | 54.6 | 4.1 |
Input Prices | 46.0 | 46.9 | –0.9 | 44.7 | 203(+) | 50.1 | 45.9 | 4.1 |
Selling Prices | 31.6 | 23.6 | +8.0 | 24.7 | 43(+) | 40.8 | 50.0 | 9.2 |
Capital Expenditures | 13.7 | 13.1 | +0.6 | 23.1 | 42(+) | 26.1 | 61.5 | 12.4 |
| General Business Conditions Future (six months ahead) | ||||||||
| Indicator | Nov Index | Oct Index | Change | Series Average | Trend** | % Reporting Improved | % Reporting No Change | % Reporting Worsened |
Company Outlook | –0.2 | –3.5 | +3.3 | 15.6 | 2(–) | 21.6 | 56.6 | 21.8 |
General Business Activity | –7.8 | –12.0 | +4.2 | 12.2 | 3(–) | 19.9 | 52.4 | 27.7 |
Historical data are available from January 2007 to the most current release month.
| Business Indicators Relating to Facilities and Products in Texas Retail (versus previous month) | ||||||||
| Indicator | Nov Index | Oct Index | Change | Series Average | Trend* | % Reporting Increase | % Reporting No Change | % Reporting Decrease |
| Retail Activity in Texas | ||||||||
Sales | –11.6 | –18.1 | +6.5 | 4.1 | 7(–) | 24.0 | 40.5 | 35.6 |
Employment | 5.4 | –12.4 | +17.8 | 1.9 | 1(+) | 13.0 | 79.4 | 7.6 |
Part–Time Employment | 3.6 | –5.2 | +8.8 | –1.6 | 1(+) | 10.0 | 83.6 | 6.4 |
Hours Worked | –4.7 | –12.1 | +7.4 | –2.0 | 2(–) | 7.3 | 80.7 | 12.0 |
Wages and Benefits | 10.0 | 2.9 | +7.1 | 11.2 | 40(+) | 12.5 | 85.0 | 2.5 |
Input Prices | 25.2 | 27.2 | –2.0 | 22.7 | 43(+) | 34.2 | 56.8 | 9.0 |
Selling Prices | 12.9 | 16.2 | –3.3 | 13.9 | 42(+) | 30.8 | 51.3 | 17.9 |
Capital Expenditures | –5.3 | 1.7 | –7.0 | 7.9 | 1(–) | 11.6 | 71.5 | 16.9 |
Inventories | 8.3 | –2.4 | +10.7 | 2.5 | 1(+) | 27.2 | 53.9 | 18.9 |
| Companywide Retail Activity | ||||||||
Companywide Sales | –11.6 | –22.6 | +11.0 | 5.3 | 3(–) | 24.0 | 40.5 | 35.6 |
Companywide Internet Sales | –7.0 | –11.6 | +4.6 | 4.3 | 3(–) | 16.6 | 59.8 | 23.6 |
| General Business Conditions, Retail Current (versus previous month) | ||||||||
| Indicator | Nov Index | Oct Index | Change | Series Average | Trend** | % Reporting Improved | % Reporting No Change | % Reporting Worsened |
Company Outlook | –9.3 | –11.9 | +2.6 | 2.2 | 2(–) | 14.3 | 62.1 | 23.6 |
General Business Activity | –11.8 | –23.0 | +11.2 | –1.8 | 5(–) | 17.0 | 54.2 | 28.8 |
| Outlook Uncertainty Current (versus previous month) | ||||||||
| Indicator | Nov Index | Oct Index | Change | Series Average | Trend* | % Reporting Increase | % Reporting No Change | % Reporting Decrease |
Outlook Uncertainty | 0.0 | 23.1 | –23.1 | 11.3 | 1() | 17.9 | 64.3 | 17.9 |
| Business Indicators Relating to Facilities and Products in Texas, Retail Future (six months ahead) | ||||||||
| Indicator | Nov Index | Oct Index | Change | Series Average | Trend* | % Reporting Increase | % Reporting No Change | % Reporting Decrease |
| Retail Activity in Texas | ||||||||
Sales | 6.6 | 11.0 | –4.4 | 30.8 | 6(+) | 28.3 | 50.0 | 21.7 |
Employment | 2.5 | 1.5 | +1.0 | 12.9 | 43(+) | 19.9 | 62.7 | 17.4 |
Part–Time Employment | –6.8 | –4.6 | –2.2 | 1.5 | 2(–) | 7.8 | 77.6 | 14.6 |
Hours Worked | 1.0 | –11.5 | +12.5 | 2.5 | 1(+) | 7.8 | 85.4 | 6.8 |
Wages and Benefits | 22.3 | 21.0 | +1.3 | 29.1 | 43(+) | 28.1 | 66.1 | 5.8 |
Input Prices | 32.7 | 27.1 | +5.6 | 34.1 | 43(+) | 42.3 | 48.1 | 9.6 |
Selling Prices | 28.3 | 16.6 | +11.7 | 29.3 | 43(+) | 39.6 | 49.1 | 11.3 |
Capital Expenditures | 0.0 | 4.1 | –4.1 | 16.9 | 1() | 22.2 | 55.6 | 22.2 |
Inventories | 3.1 | –7.3 | +10.4 | 10.7 | 1(+) | 28.9 | 45.4 | 25.8 |
| Companywide Retail Activity | ||||||||
Companywide Sales | 3.9 | 7.6 | –3.7 | 29.4 | 6(+) | 27.9 | 48.1 | 24.0 |
Companywide Internet Sales | 16.3 | 5.0 | +11.3 | 21.5 | 5(+) | 32.6 | 51.2 | 16.3 |
| General Business Conditions, Retail Future (six months ahead) | ||||||||
| Indicator | Nov Index | Oct Index | Change | Series Average | Trend** | % Reporting Improved | % Reporting No Change | % Reporting Worsened |
Company Outlook | –5.7 | –4.1 | –1.6 | 15.3 | 2(–) | 19.2 | 55.9 | 24.9 |
General Business Activity | –11.7 | –7.7 | –4.0 | 10.7 | 3(–) | 19.6 | 49.0 | 31.3 |
*Shown is the number of consecutive months of expansion or contraction in the underlying indicator. Expansion is indicated by a positive index reading and denoted by a (+) in the table. Contraction is indicated by a negative index reading and denoted by a (–) in the table.
**Shown is the number of consecutive months of improvement or worsening in the underlying indicator. Improvement is indicated by a positive index reading and denoted by a (+) in the table. Worsening is indicated by a negative index reading and denoted by a (–) in the table.
Data have been seasonally adjusted as necessary.
Texas Service Sector Outlook Survey

Texas Retail Outlook Survey
Texas Service Sector Outlook Survey
Comments from survey respondents
These comments are from respondents’ completed surveys and have been edited for publication.
- We feel that we are headed for a recession.
- There is still no sign of when this slowdown in the tech sector will turn and begin to improve.
- We see mixed signals everywhere. Inverted yield curves imply a recession. Probably we're already in a rolling recession.
- Our clients are growing, but there is still a hefty amount of hesitancy. We've had a great year but need to make marketing and people investments. The cost of lending is outrageous and causing us to pause to consider if the costs are worth expanding right now.
- The general level of business activity has continued to slow month over month, and we do not see this improving due to the uncertainty of interest rates and the banking industry. We hope to have some clarity the first half of the next year.
- Interest rates are severely impacting our clients’ cash flow and solvency. We are seeing defaults increasing.
- The economy is slowing down in the U.S. and globally per our assessment and future sales trend.
- Businesses welcomed the decision to hold rates for a second cycle until a full analysis of the aggregate 2023 data is completed. However, we remain cautious on the economic reality of 2024. Businesses are working diligently to adapt and establish a realistic growth model. Rate increases in 2024 will limit investment, growth and expansion.
- We don't foresee the cost of doing business coming down. The qualified workforce shortage persists. We're having to spend more time correcting mistakes and latent defects.
- Congressional dysfunction and Israel and Ukraine disagreements add to anxiety over inflation and financial wellbeing.
- The uncertainty increased based on Congress’ inability to get it together.
- We're seeing the same economic indicators as last month. We have a good backlog through the end of the year. Our first quarter looks light (about a 10 percent decrease). We're not sure yet if that is a typical end-of-year slowdown or if our 2024 projections should be less than 2023.
- Hiring is very unstable. Small to mid-market companies are hiring, and larger companies have pulled back significantly. Open jobs are far fewer, and clients are reluctant to pay a fee to find strong talent. They're also taking longer to make decisions about who they want to hire. Instead of laying off, we are reducing salaries currently. Hoping to weather this uncertain period and return to a more consistent, stable hiring pattern.
- Washington dysfunction, inflationary fiscal policy and geopolitical uncertainty are causing forecasting and business environment uncertainty.
- Continuing high interest rates are concerning. The labor market is still strong, although labor cost increases have somewhat abated.
- Monetary policy alone is not the ticket; we need to jawbone fiscal policymakers in the medium and long term.
- Additional state funding has improved our outlook.
- Business seems to be very steady; groups are planning events in the fourth quarter and the first quarter 2024. We will see annual wage increases at the beginning of next year. Inflation continues to be an area we are watching carefully.
- Business has unexpectedly slowed over the last several months. We think the average consumer is overextended and is cutting back on spending.
- It looks like we are poised to enter recession, based on our assessment of the broader economy and specific sectors such as commercial real estate. This may be good for future business activity if interest rates drop by mid-year 2024 in response to the slowing economy.
- Property insurance has become so outrageous that management clients are threatening to leave us if we can't find them a better program. Because our clients are on the Gulf Coast, not even our hired consultant has been able to find anything much better after six months of intensive effort. We continue to be burdened by property owners whose failing deals have left us holding the bag for some of their debts. This year, we've lost 11 multifamily management contracts that have collectively stiffed us for over $1 million. The primary drivers are higher debt service and insurance costs. We're doing our job well but are suffering none the less—meaning few bonuses for our hard-working folks this year end, just when they need them most.
- The manufacturing sector has generally been experiencing a slowdown in business conditions in many of the subsectors, which impacts our business as well.
- Global unrest and challenges in our nation’s capital are creating troublesome times. Add workforce shortages, high interest rates and inflation, and it appears a perfect storm.
- The trucking industry is in a mess due to overcapacity (too many carriers on the market driving rates below profitable levels), and the cotton crops not moving for two years in a row. We had to lay off two more people last week. The market is tight for warehouse space, labor and equipment. We are seeing a rise in warehousing and packaging as manufactures are looking to move more product through promotions. Pricing is still trying to catch up given the inflation for the past three years.
- Automation and knowledge/intelligence based, easy-to-use (intuitive) platforms and software are in growing demand by the government and enterprise, due to themes of doing more with fewer humans more securely, and augmenting humans with tech to be more productive and more cost effective.
- As year end approaches, our clients are indicating that budgets for 2024 are lower and tighter than they've seen in years.
- The primary challenge has been the interest rate environment. The cost of borrowing money has increased substantially and has resulted in a slowdown of customers borrowing money.
- We operate in the commercial real estate finance sector and most of our business is done with life insurance company lenders. Financing related to investment transactions is off tremendously, which is not surprising given the significant increase in the cost of debt capital coupled with uncertainty related to what property value is today. As short-term bank loans continue to mature in a higher-interest-rate market and we transition into 2024, we think there will be an opportunity for the lender sector, which we do most of our business with, to pick up a better volume of loans, where property value is re-priced or the capital stack is adjusted to reflect today's normal.
- We have been in the residential mortgage industry for more than 30 years. We think by this time next year, 85 percent of existing lenders and 50 percent of real estate agents will be gone. Many middle-class jobs will be gone.
- Liquidity remains constrained and high interest rates are decreasing cash flow and will produce considerable distress in 2024.
- We are seeing the first major forecast of potentially diminished operating income against market conditions. Although we are not stopping hiring, we have moved to more rigorous expense management and higher scrutiny for new positions.
- Rising interest rates and concerns with banking have frozen lending capacity, which is severely impacting the real estate business.
- We have increased inventories for the holiday season. Our sales declined in the last half of October, and it seems like early November will be down as well. Some of our commodity influenced products have moved lower in pricing.
- We're seeing a significant month-over-month drop in orders and sales. The downward trend started in August. Typically, the fourth quarter is our strongest quarter, and it will be very soft this year. The restaurants we serve in Hawaii and Puerto Rico are slow by historical standards, but volume is up slightly over last year. Our export business to restaurants in Latin America has not seen the drop in volume compared with domestic business.
- Tremendous economic slowdown. It seems customer sentiment is extreme worry.
- We continue to see softening of the used car market due to high interest rates and affordability issues. New vehicle inventories are growing at a fast pace.
- Inflation is a big factor as we still see an increase in freight and all delivery costs. Interest rates are a killer and hard to overcome. We just renewed our property and causality insurance, and it is up 15 percent.
- Margins shrink as inflation negatively impacts operating profits. Inventories are increasing at alarming rate as interest rates remain high. Recruiting qualified candidates who want to work continues to be a major problem.
- We need to get people to buy a house.
- Major appliance retail and wholesale prices have been falling, especially with the Labor Day and black Friday sale pricing.
- Interest rates and inflation are hurting businesses and consumers/customers alike.
- Business is flat and we are just trying to adjust and stay profitable during the next six to 12 months. We are having many challenges with high interest rates, finding good labor and the general mood of the country. Not a fun time in the small business world.
- These high interest rates are killing us.
- It’s still difficult to hire employees—especially truckers. The future seems scarier after listening to business news.
- The same issues with return to office and soft business travel continue to constrain revenue. Also, it’s still difficult to staff fully with a lot of turnover from new hires, and this also constrains revenue. We are seeing inflation in all areas of cost of goods and expenses. The pressure to increase wages and salary continues to be a struggle. Profit and loss insurance increases are only outpaced by increases in healthcare insurance. Profitability is difficult.
- Holidays are somewhat busier, historically, but we don't see as much spending as before. We are still hopeful it will come, but people are spending on gifts over outings.
- Business activity improvement continues to be closely related to oil and gas activity. Labor continues to be tight; however, there are signs the labor shortage may be easing, for what reasons is undetermined.
Historical Data
Historical data can be downloaded dating back to January 2007.
Indexes
Download indexes for all indicators. For the definitions of all variables, see data definitions.
Texas Service Sector Outlook Survey |
Texas Retail Outlook Survey |
| Unadjusted | Unadjusted |
| Seasonally adjusted | Seasonally adjusted |
All Data
Download indexes and components of the indexes (percentage of respondents reporting increase, decrease, or no change). For the definitions of all variables, see data definitions.
Texas Service Sector Outlook Survey |
Texas Retail Outlook Survey |
| Unadjusted | Unadjusted |
| Seasonally adjusted | Seasonally adjusted |
Questions regarding the Texas Service Sector Outlook Survey can be addressed to Jesus Cañas at jesus.canas@dal.frb.org.
Sign up for our email alert to be automatically notified as soon as the latest Texas Service Sector Outlook Survey is released on the web.