
Texas Service Sector Outlook Survey
Texas service sector activity rebounds
For this month’s survey, Texas business executives were asked supplemental questions on wages, prices and outlook concerns. Results for these questions from the Texas Manufacturing Outlook Survey, Texas Service Sector Outlook Survey and Texas Retail Outlook Survey have been released together. Read the special questions results.
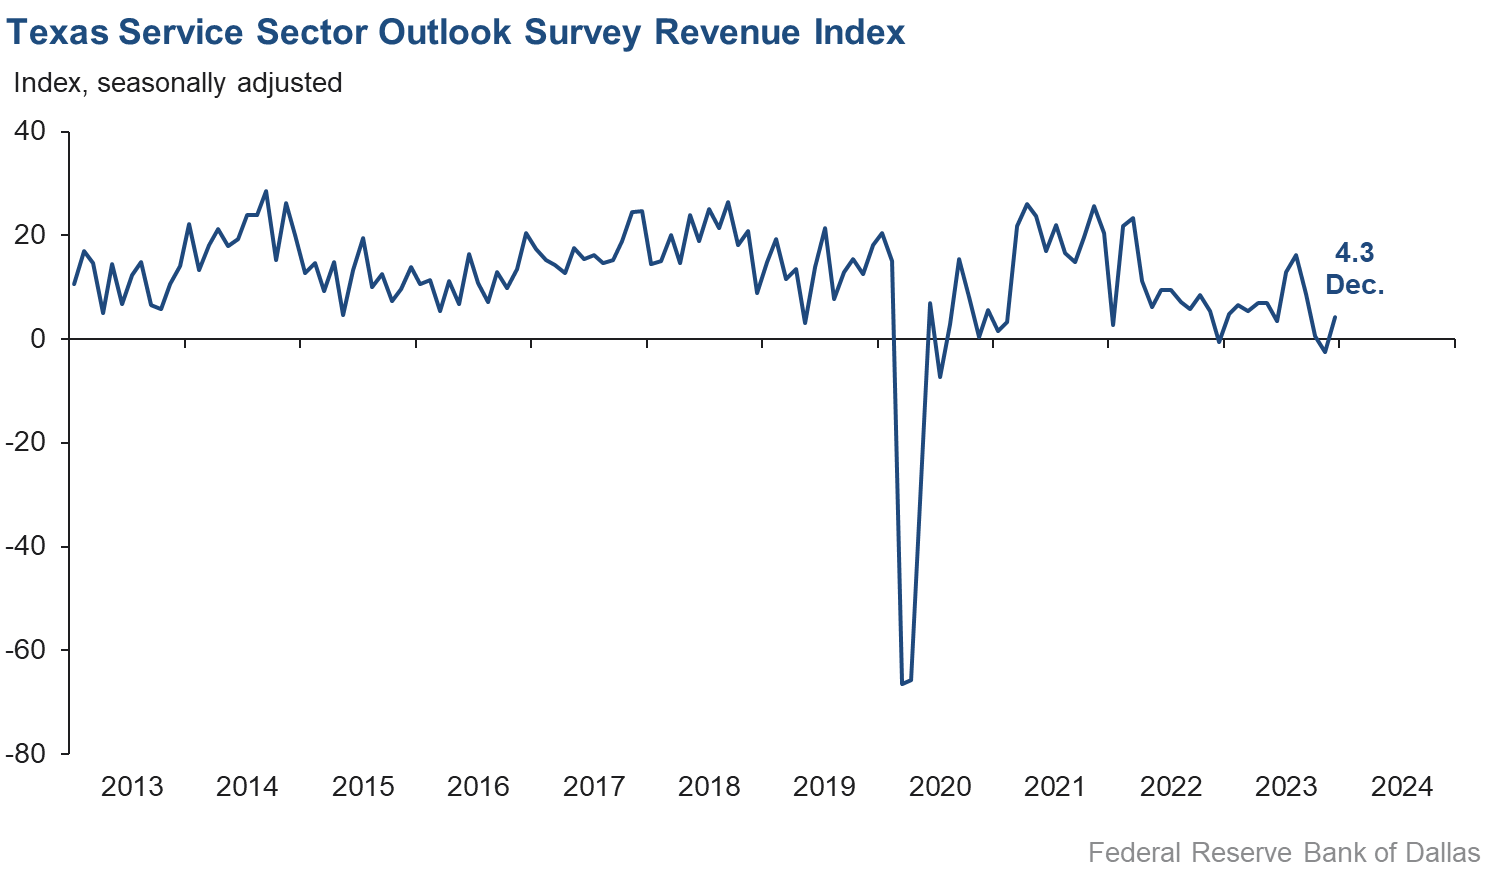
Growth in Texas service sector activity resumed in December, according to business executives responding to the Texas Service Sector Outlook Survey. The revenue index, a key measure of state service sector conditions, increased seven points to 4.3.
Labor market measures suggest continued employment growth but flat work hours. The employment index fell two points to 4.2 in December. The part-time employment index was flat at 0.1, while the hours worked index held mostly steady at -0.8.
Respondents in December continued to perceive worsening broader business conditions, though pessimism waned further. The general business activity index improved from -11.6 to -8.7, while the company outlook index increased from -8.1 to -0.7. The outlook uncertainty index ticked up two points to 12.6.
Input and selling price pressures picked up slightly while wage growth remained unchanged in December. The input prices index increased three points to 35.4 and the selling prices index increased two points to 13.4, with both indexes exceeding their respective series averages. The wages and benefits index was mostly unchanged at 16.4, approaching its average reading of 15.8.
Respondents’ expectations regarding future business activity improved in December. The future general business activity index moved into positive territory improving from -7.8 to 4.6. The future revenue index remained positive and increased six points to 34.5. Other future service sector activity indexes such as employment and capital expenditures remained in positive territory and also improved, reflecting expectations for continued retail sales growth in the next six months.

Texas Retail Outlook Survey
Texas retail sales fall, but at a considerably slower pace than last month
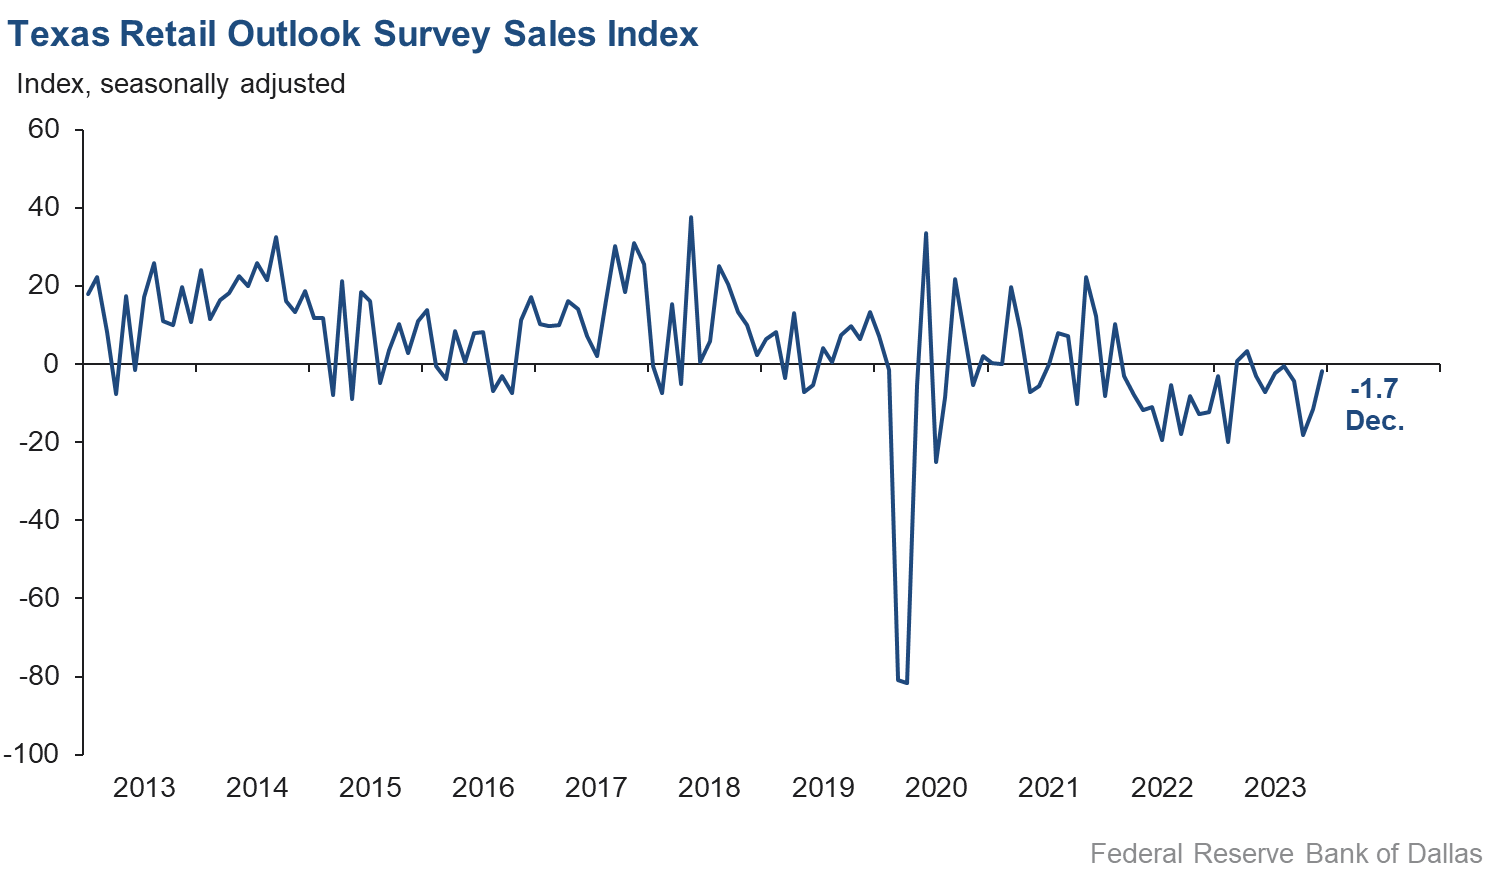
Retail sales declined in December, according to business executives responding to the Texas Retail Outlook Survey. The sales index, a key measure of state retail activity, remained in negative territory, but increased considerably from -11.6 to -1.7, indicating retail sales fell at a slower rate than the previous month. Retailers’ inventories grew over the month with the December index at 9.8.
Retail labor market indicators reflected steady employment growth and flat workweeks in December. The employment index held at 4.1 while the part-time employment index rose three points to 6.7. The hours worked index increased from -4.7 to -0.4.
Retailers continued to perceive a worsening of broader business conditions in December. The general business activity index fell from -11.8 to -24.1, while the company outlook index remained in negative territory but improved from -9.3 to -6.0. The outlook uncertainty index increased from zero to 17.3.
Input price and wage pressures increased while selling price pressures remained steady in December. The input prices index increased seven points to 32.3 while the selling prices index remained at 12.9. The wages and benefits index ticked up from 10.0 to 12.4.
Expectations for future retail growth were mixed in December. The future general business activity index continued in negative territory but improved from -11.7 to -3.8 while the future sales index increased from 6.6 to 25.0. Other indexes of future retail activity such as employment and capital expenditures were strongly positive, reflecting expectations for continued retail sales growth in the next six months.
Next release: January 30, 2024
Data were collected Dec. 12–20, and 284 Texas service sector business executives, of which 59 were retailers, responded to the survey. The Dallas Fed conducts the Texas Service Sector Outlook Survey monthly to obtain a timely assessment of the state’s service sector activity. Firms are asked whether revenue, employment, prices, general business activity and other indicators increased, decreased or remained unchanged over the previous month.
Survey responses are used to calculate an index for each indicator. Each index is calculated by subtracting the percentage of respondents reporting a decrease from the percentage reporting an increase. When the share of firms reporting an increase exceeds the share reporting a decrease, the index will be greater than zero, suggesting the indicator has increased over the prior month. If the share of firms reporting a decrease exceeds the share reporting an increase, the index will be below zero, suggesting the indicator has decreased over the prior month. An index will be zero when the number of firms reporting an increase is equal to the number of firms reporting a decrease. Data have been seasonally adjusted as necessary.
Data have been seasonally adjusted as necessary.
Texas Service Sector Outlook Survey
Historical data are available from January 2007 to the most current release month.
| Business Indicators Relating to Facilities and Products in Texas Current (versus previous month) | ||||||||
| Indicator | Dec Index | Nov Index | Change | Series Average | Trend* | % Reporting Increase | % Reporting No Change | % Reporting Decrease |
Revenue | 4.3 | –2.4 | +6.7 | 10.8 | 1(+) | 25.7 | 52.9 | 21.4 |
Employment | 4.2 | 5.7 | –1.5 | 6.5 | 9(+) | 14.8 | 74.6 | 10.6 |
Part–Time Employment | 0.1 | 1.2 | –1.1 | 1.5 | 2(+) | 6.3 | 87.5 | 6.2 |
Hours Worked | –0.8 | –0.9 | +0.1 | 2.7 | 3(–) | 6.4 | 86.4 | 7.2 |
Wages and Benefits | 16.4 | 16.8 | –0.4 | 15.8 | 43(+) | 19.7 | 77.0 | 3.3 |
Input Prices | 35.4 | 32.1 | +3.3 | 27.9 | 44(+) | 38.4 | 58.6 | 3.0 |
Selling Prices | 13.4 | 11.3 | +2.1 | 7.7 | 41(+) | 20.0 | 73.4 | 6.6 |
Capital Expenditures | 9.8 | 4.1 | +5.7 | 10.0 | 41(+) | 17.4 | 75.0 | 7.6 |
| General Business Conditions Current (versus previous month) | ||||||||
| Indicator | Dec Index | Nov Index | Change | Series Average | Trend** | % Reporting Improved | % Reporting No Change | % Reporting Worsened |
Company Outlook | –0.7 | –8.1 | +7.4 | 4.5 | 5(–) | 14.1 | 71.1 | 14.8 |
General Business Activity | –8.7 | –11.6 | +2.9 | 2.6 | 19(–) | 10.5 | 70.3 | 19.2 |
| Indicator | Dec Index | Nov Index | Change | Series Average | Trend* | % Reporting Increase | % Reporting No Change | % Reporting Decrease |
Outlook Uncertainty | 12.6 | 10.4 | +2.2 | 13.6 | 31(+) | 22.0 | 68.7 | 9.4 |
| Business Indicators Relating to Facilities and Products in Texas Future (six months ahead) | ||||||||
| Indicator | Dec Index | Nov Index | Change | Series Average | Trend* | % Reporting Increase | % Reporting No Change | % Reporting Decrease |
Revenue | 34.5 | 28.2 | +6.3 | 37.5 | 44(+) | 49.2 | 36.0 | 14.7 |
Employment | 23.6 | 17.6 | +6.0 | 23.2 | 44(+) | 32.7 | 58.2 | 9.1 |
Part–Time Employment | 5.8 | 0.5 | +5.3 | 6.7 | 8(+) | 12.7 | 80.4 | 6.9 |
Hours Worked | 6.9 | 4.9 | +2.0 | 5.9 | 44(+) | 11.8 | 83.3 | 4.9 |
Wages and Benefits | 39.2 | 37.2 | +2.0 | 37.5 | 44(+) | 42.0 | 55.2 | 2.8 |
Input Prices | 44.9 | 46.0 | –1.1 | 44.7 | 204(+) | 49.8 | 45.3 | 4.9 |
Selling Prices | 28.6 | 31.6 | –3.0 | 24.7 | 44(+) | 37.5 | 53.6 | 8.9 |
Capital Expenditures | 19.8 | 13.7 | +6.1 | 23.1 | 43(+) | 28.4 | 62.9 | 8.6 |
| General Business Conditions Future (six months ahead) | ||||||||
| Indicator | Dec Index | Nov Index | Change | Series Average | Trend** | % Reporting Improved | % Reporting No Change | % Reporting Worsened |
Company Outlook | 6.9 | –0.2 | +7.1 | 15.5 | 1(+) | 22.1 | 62.7 | 15.2 |
General Business Activity | 4.6 | –7.8 | +12.4 | 12.2 | 1(+) | 21.5 | 61.6 | 16.9 |
Historical data are available from January 2007 to the most current release month.
| Business Indicators Relating to Facilities and Products in Texas Retail (versus previous month) | ||||||||
| Indicator | Dec Index | Nov Index | Change | Series Average | Trend* | % Reporting Increase | % Reporting No Change | % Reporting Decrease |
| Retail Activity in Texas | ||||||||
Sales | –1.7 | –11.6 | +9.9 | 4.0 | 8(–) | 29.7 | 39.0 | 31.4 |
Employment | 4.1 | 5.4 | –1.3 | 1.9 | 2(+) | 16.3 | 71.5 | 12.2 |
Part–Time Employment | 6.7 | 3.6 | +3.1 | –1.5 | 2(+) | 10.4 | 85.9 | 3.7 |
Hours Worked | –0.4 | –4.7 | +4.3 | –2.0 | 3(–) | 7.5 | 84.6 | 7.9 |
Wages and Benefits | 12.4 | 10.0 | +2.4 | 11.2 | 41(+) | 17.5 | 77.4 | 5.1 |
Input Prices | 32.3 | 25.2 | +7.1 | 22.8 | 44(+) | 39.5 | 53.3 | 7.2 |
Selling Prices | 12.9 | 12.9 | 0.0 | 13.9 | 43(+) | 27.6 | 57.7 | 14.7 |
Capital Expenditures | 5.2 | –5.3 | +10.5 | 7.9 | 1(+) | 17.8 | 69.6 | 12.6 |
Inventories | 9.8 | 8.3 | +1.5 | 2.6 | 2(+) | 33.5 | 42.8 | 23.7 |
| Companywide Retail Activity | ||||||||
Companywide Sales | –5.2 | –11.6 | +6.4 | 5.2 | 4(–) | 24.4 | 46.1 | 29.6 |
Companywide Internet Sales | –5.6 | –7.0 | +1.4 | 4.2 | 4(–) | 17.1 | 60.2 | 22.7 |
| General Business Conditions, Retail Current (versus previous month) | ||||||||
| Indicator | Dec Index | Nov Index | Change | Series Average | Trend** | % Reporting Improved | % Reporting No Change | % Reporting Worsened |
Company Outlook | –6.0 | –9.3 | +3.3 | 2.1 | 3(–) | 16.6 | 60.8 | 22.6 |
General Business Activity | –24.1 | –11.8 | –12.3 | –1.9 | 6(–) | 9.2 | 57.5 | 33.3 |
| Outlook Uncertainty Current (versus previous month) | ||||||||
| Indicator | Dec Index | Nov Index | Change | Series Average | Trend* | % Reporting Increase | % Reporting No Change | % Reporting Decrease |
Outlook Uncertainty | 17.3 | 0.0 | +17.3 | 11.3 | 1(+) | 27.6 | 62.1 | 10.3 |
| Business Indicators Relating to Facilities and Products in Texas, Retail Future (six months ahead) | ||||||||
| Indicator | Dec Index | Nov Index | Change | Series Average | Trend* | % Reporting Increase | % Reporting No Change | % Reporting Decrease |
| Retail Activity in Texas | ||||||||
Sales | 25.0 | 6.6 | +18.4 | 30.8 | 7(+) | 38.3 | 48.4 | 13.3 |
Employment | 20.2 | 2.5 | +17.7 | 12.9 | 44(+) | 24.4 | 71.4 | 4.2 |
Part–Time Employment | 6.5 | –6.8 | +13.3 | 1.5 | 1(+) | 12.0 | 82.5 | 5.5 |
Hours Worked | 6.0 | 1.0 | +5.0 | 2.5 | 2(+) | 13.0 | 80.0 | 7.0 |
Wages and Benefits | 23.5 | 22.3 | +1.2 | 29.1 | 44(+) | 27.7 | 68.1 | 4.2 |
Input Prices | 34.0 | 32.7 | +1.3 | 34.1 | 44(+) | 41.1 | 51.8 | 7.1 |
Selling Prices | 16.4 | 28.3 | –11.9 | 29.3 | 44(+) | 36.4 | 43.6 | 20.0 |
Capital Expenditures | 16.1 | 0.0 | +16.1 | 16.9 | 1(+) | 28.6 | 58.9 | 12.5 |
Inventories | 15.7 | 3.1 | +12.6 | 10.7 | 2(+) | 36.0 | 43.7 | 20.3 |
| Companywide Retail Activity | ||||||||
Companywide Sales | 20.0 | 3.9 | +16.1 | 29.3 | 7(+) | 31.9 | 56.2 | 11.9 |
Companywide Internet Sales | 19.2 | 16.3 | +2.9 | 21.5 | 6(+) | 29.8 | 59.6 | 10.6 |
| General Business Conditions, Retail Future (six months ahead) | ||||||||
| Indicator | Dec Index | Nov Index | Change | Series Average | Trend** | % Reporting Improved | % Reporting No Change | % Reporting Worsened |
Company Outlook | –1.0 | –5.7 | +4.7 | 15.2 | 3(–) | 21.8 | 55.4 | 22.8 |
General Business Activity | –3.8 | –11.7 | +7.9 | 10.6 | 4(–) | 22.1 | 52.0 | 25.9 |
*Shown is the number of consecutive months of expansion or contraction in the underlying indicator. Expansion is indicated by a positive index reading and denoted by a (+) in the table. Contraction is indicated by a negative index reading and denoted by a (–) in the table.
**Shown is the number of consecutive months of improvement or worsening in the underlying indicator. Improvement is indicated by a positive index reading and denoted by a (+) in the table. Worsening is indicated by a negative index reading and denoted by a (–) in the table.
Data have been seasonally adjusted as necessary.
Texas Service Sector Outlook Survey
Texas Retail Outlook Survey
Texas Service Sector Outlook Survey
Comments from survey respondents
These comments are from respondents’ completed surveys and have been edited for publication.
- We are seeing more scams coming through emails and fraud that's costing time and effort to monitor and correct. We have experienced a check being intercepted in the mail and a counterfeit check cashed against our account.
- The election coupled with recession narratives continue to add to and contribute to overall uncertainty. Uncertainty tends to pause or stall our market segment in general, which leads to overall stagnation.
- The December Federal Open Market Committee announcement to hold the interest rate was a welcome sign for businesses. We are awaiting the forthcoming economic projections to determine how the 2024 capital markets respond and what might be the growth potential. It’s still too early to say how the 2024 U.S. presidential election, Middle East, Ukrainian conflicts and global economy will impact the FOMC goal of a "soft landing."
- Both our residential and commercial division saw a 19 percent decrease in revenue month over month and a 33 percent decrease year over year. Orders are significantly down for the year and the month of December. This could be a rough ride for the next year or so.
- Economic slowdown is very noticeable in the U.S., especially in the government sector, and globally such as in Canada, Europe, China and Asia, which are our main export destinations.
- December is our slow time, so we always expect business to slow down, and we plan accordingly.
- We are just not selling many new deals at all lately.
- We have seen an increase in activity over the last month. We are a small talent search firm, and we are seeing more requests for talent than what is available currently in the market. That means, to us, that our clients, who are small to mid-size companies, have more confidence in the market.
- Our backlog for the first quarter of 2024 is considerably lower than the fourth quarter of 2023. It is hard to tell if this is the typical slowdown at the end of the year or more systemic. The reduction in backlog is greater than years past. It seems, from talking to our clients, that the amount of uncertainty in the market is greater. We are worried that the level of uncertainty is why we are seeing fewer new projects kick off now. We'll know better how our market is doing in January or February. Right now, we are slowing our non-discretionary spending to build up our reserves.
- Our costs of doing business continue to increase.
- Corporate aircraft inspections have slowed down, mainly due to seasonal changes.
- Machine shop requests for quotes have dropped 30 percent since mid-summer.
- With the bond market continuing to ignore the signals the Federal Reserve and the economy are sending, we are worried there will be another 1-2 percent spike in 10-year and longer maturity bonds. That will throw the markets into a short-term and completely unnecessary downturn. We are talking ourselves into a recession.
- Improving inflation, a lower 10-year treasury rate and a still historically low unemployment rate. The job market seems to be stabilizing as hiring cools and retention rates improve.
- The flow of population from outside of Texas into Texas is keeping our business stable or giving us a small increase.
- State of Texas revenue and funding appear to have stabilized in the near term. The largest source of uncertainty for us is global conflict.
- The labor market continues to be challenging, with unqualified candidates flooding the marketplace and qualified candidates requesting wages that are unsustainable. Inflation continues to cause price increases for all vendors and supplies. Revenue pressure continues to be a challenge, as we are unable to negotiate increased reimbursement rates with the insurance monopolies. Seasonal flu still has not taken hold, which often drives patients to our facility, and COVID-19 seems to also be inconsistent in its presence.
- Overall business volume is lower than this time a year ago.
- We are seeing a slowdown in business. Not sure if this is temporary or a sign of deterioration of business conditions. More data and time are required to make an appropriate determination.
- We think the geopolitical situation and America's status in it is so much worse than three years ago. Besides that, we think we have a strong economy through the first quarter of 2024.
- Lenders and owners need professional property management services more than ever, but they are having trouble affording them.
- We sense some softening, but activity continues to be solid and leasing activity is good. Our tenants appear to be doing well, and regional retailers are continuing expansion in our markets.
- We are hoping for rate cuts in the second half of 2024, which will help improve business transaction volume.
- It is a tough market with an oversupply of agents (twice the listing number.)
- Current oil prices are changing our outlook for the second half of 2024 as we see our revenue decreasing. We are seeing retraction from many of our customers at this point.
- Things feel very stable at the moment, and uncertainty seems to have diminished a bit as a soft landing finally feels possible.
- Productivity will significantly improve in 2024 as a result of new, user-friendly software and related platforms and advanced hardware. However, we see labor costs rising and skilled people in short supply. Artificial intelligence will contribute to improvements in efficiency and productivity from call centers to administrative duties.
- Planning for increased revenue in 2024 has become more challenging. Unlike prior years when the budget cycle was usually completed by this time of the year, the budgeting process at our current clients' organizations is taking longer and going through more reduction cycles to get approval. What we're hearing from our market is greater economic uncertainty, fewer purchases and likely layoffs in 2024.
- Costs continue to increase, but we are not yet able to pass those on to our customers.
- Input costs continue to increase. Selling prices have hit a point that customers have already pulled back on projects. We foresee this trend continuing until interest rates begin to fall.
- We were able to close on a $600 million debt facility in the fourth quarter of 2023, but our cost of financing was much higher more than 5 percent.
- The economy has exhibited slowdowns in certain areas that are becoming more evident. We are seeing downward pressure on earnings, and business activity has started to show signs of depression. Velocity of money has been declining, but liquidity has stabilized for financial institutions. The geopolitical climate continues to create concerns for the future forecast of many small business operators.
- The flattening of interest rates and the potential easing of rates have increased activity slightly in small business mergers and acquisitions. Potential buyers and sellers are starting to dip their toes back in the water.
- High interest rates have had a very significant impact on my 10 very large developers and builders located primarily in the DFW marketplace. This group of companies built and developed nearly $1 billion in projects in 2021 and 2022, mostly in North Texas. The pipeline has basically dried up, however, 2024 will be OK because of the existing backlog, but no new deals are getting done. This means that 2025 and 2026 are going to be a major problem for the developers, builders, subcontractors and all those that support that activity. Interest rates should not continue increasing, or the companies and the banks that support developers and builders are going to get crushed.
- Hiring reliable truck drivers is extremely difficult. We have trucks that we can't put drivers in because of the lack of availability of reliable, qualified drivers.
- There seems to be an increase in the amount of talk about recession and the drop in market numbers in the media in the next coming months. It's been that way for the last 12 months though. It’s hard to get a grip on what's going to happen.
- Inventory has significantly increased. Floor plan expenses are excessive. The cost of doing business has increased. There is pressure on margins. Profits are declining.
- Wholesale orders for restaurants are down month over month as people are eating out less right now. Typically, the fourth quarter is our strongest quarter, but it is running about 20 percent behind the historical average. Business traffic has decreased a little, but our point of purchase has decreased by 8-10 percent. However, margins are better than normal with some inventory prices decreasing.
- We think we can allow a recession to happen soon and come out of it stronger. Prolonging the inevitable hurts everyone. Now, once this recession hits, most people will have spent their savings and won't be able to manage through. We need to allow the bad times to happen while people are in a good position to handle it, not just for the rich to thrive.
- Since we supply personal protective equipment and tools to the commercial construction industry, continued higher interest rates will slow down building. Obviously, rate cuts would be a positive step, but people are a little tentative right now as to whether those cuts will materialize.
- Significant softness in the return to office and business travel continue to impact revenue. The increasing cost of goods sold moderated only somewhat compared to last year. Skilled labor remains very difficult to hire. Unskilled labor is a bit better. Overall labor costs remain quite inflated year over year, which hasn’t changed.
- We are seeing sharp drops in customer traffic, which is abnormal for the holiday season.
Historical Data
Historical data can be downloaded dating back to January 2007.
Indexes
Download indexes for all indicators. For the definitions of all variables, see data definitions.
Texas Service Sector Outlook Survey |
Texas Retail Outlook Survey |
| Unadjusted | Unadjusted |
| Seasonally adjusted | Seasonally adjusted |
All Data
Download indexes and components of the indexes (percentage of respondents reporting increase, decrease, or no change). For the definitions of all variables, see data definitions.
Texas Service Sector Outlook Survey |
Texas Retail Outlook Survey |
| Unadjusted | Unadjusted |
| Seasonally adjusted | Seasonally adjusted |
Questions regarding the Texas Service Sector Outlook Survey can be addressed to Jesus Cañas at jesus.canas@dal.frb.org.
Sign up for our email alert to be automatically notified as soon as the latest Texas Service Sector Outlook Survey is released on the web.