
Gazing at r-star: Gauging U.S. monetary policy via the natural rate of interest
When economists assess interest rate policy, they look at the natural rate of interest—known as r* or r-star—which signals neither restrictive nor expansionary monetary policy. Rather, r-star is the middle ground.
As a key monetary and fiscal policy benchmark, it anchors real rates and has implications for the stance of monetary policy. While estimating r-star is fraught with difficulty, the latest evidence suggests U.S. monetary policy likely turned restrictive at the start of 2023, after the Federal Reserve started raising rates in March 2022.
Natural rate important for monetary policy
The concept of r-star has its roots in the work of Swedish economist Knut Wicksell and others in the 19th century. Economists Thomas Laubach and now-New York Fed President John Williams in an influential 2003 paper popularized a modern view of r-star as “the real short-term interest rate consistent with output converging to potential, where potential is the level of output consistent with stable inflation.”
R-star gained traction in 1993 as the intercept term in Stanford economist John Taylor’s famous namesake interest rate policy rule, “written in ‘real’ terms with the lagged inflation rate serving as a proxy for the expected inflation.” A shift by central banks toward a short-term interest rate targeting strategy during the 1980s and the mainstream analytical framework that emerged in the 1990s—the so-called New Keynesian model—further established r-star as a key concept for monetary policy.
When policy tracks r-star, as in Taylor’s rule, the natural rate influences the policy rate and, by extension, interest rates across all maturities. But such a strategy does not necessarily guarantee an optimal outcome.
Suboptimality can arise when both real and nominal rigidities co-exist—that is, prices and wages are slow to respond. Alternatively, it can occur when policymakers attempt to stabilize headline inflation—the broad price measure customarily assumed in conventional measures of r-star—rather than seek inflation stability among goods and services with stickier prices (items that infrequently change price). Adopting the broader headline inflation strategy can lead to policy that is too restrictive or too accommodative.
Monetary policy restrictiveness can be gauged by examining the gap between the 3-month (short-term) real (inflation-adjusted) rate and the corresponding 3-month r-star. When the short-term real rate is equivalent to the short-term r-star, monetary policy is neutral. Monetary policy is restrictive when the real rate is above r-star, expansionary when it is below.
This is consistent with Taylor’s rule—when inflation and economic slack indicate that the economy is operating on balance at levels above or below those consistent with the Fed’s dual mandate of maximum employment and stable prices.
The evolution of the real rate
R-star is not directly observable and can only be inferred in the context of an analytical model. The real-world rate to which it is compared—the short-term real rate—is not easy to measure either. Economists prefer projected rather than realized inflation to adjust the short-term nominal rate. Broadly, the real rate hovered at or above 2 percent prior to the Global Financial Crisis (2007–09) and has fallen frequently below zero since then (Chart 1).

Fed tightening since March 2022 pushed the real rate close to 1.5 percent in first quarter 2023. Conditions will tighten, although private forecasters anticipate that the short-term nominal rate won’t likely change much during the second half of 2023.
How is r-star measured?
Most r-star measures focus on estimates of the inflation-expectations-adjusted 3-month rate five to 10 years out. This medium-run horizon provides a notion of the terminal rate toward which the central bank policy rate ought to converge.
Chart 2 summarizes the available medium-run estimates of r-star obtained with a variety of methods—ranging from purely empirical to purely model-based. It also depicts a survey-based medium-run proxy (from Blue Chip Economic Indicators data) given by the 5-year, 5-year-forward inflation-adjusted 3-month rate on Treasury yields.

Medium-run estimates of r-star were stable at or above 2 percent before the financial crisis, subsequently falling below 1 percent, a development also noted in the background materials for the Fed’s policy framework review in 2019–20.
This decline became a global phenomenon partly because of spillovers from the U.S. (and other major economies) onto a wide range of globally interconnected economies. Productivity growth, demographic trends, demand and supply of U.S. safe assets, and fiscal developments also help explain the slowdown and resulting decline of r-star after the financial crisis.
The events are still too recent to permit a precise quantitative assessment. More recently, risk tolerance may have declined somewhat due to heightened uncertainty. The medium-term r-star may reflect possible impacts of longer-lasting factors—hypothetically including U.S. government fiscal stimulus permanently increasing the supply of safe assets, the impacts of the Russia–Ukraine war and financial-asset sanctions reducing the global desire to hold U.S. assets. Households and businesses as well as policymakers might still anticipate a terminal rate at prepandemic levels at medium-run horizons.Forecast-implied projections of the medium-run r-star using Laubach and Williams’ methodology, however, are expected to fall back by 2024 to the low levels observed immediately following the financial crisis.
Short-term natural rate remains key
Since sticky prices adjust over time, the distinction between the real rate and r-star ought to disappear at medium-run horizons. Short-term r-star is harder to infer—particularly in real time—but remains the policy-relevant benchmark for judging monetary tightness when the distortions caused by slow-moving price adjustments are binding.
My model-based short-term r-star is based on a New Keynesian model of the U.S. economy and its major trading partners that presumes sticky prices and wages change slowly (Chart 3). This estimate incorporates Fed policy trade-offs and spillovers from foreign monetary policy influencing domestic conditions. The contrast is stark, with my short-term r-star lower than the median of medium-run estimates from the 1990s to the financial crisis and from 2017 onward.
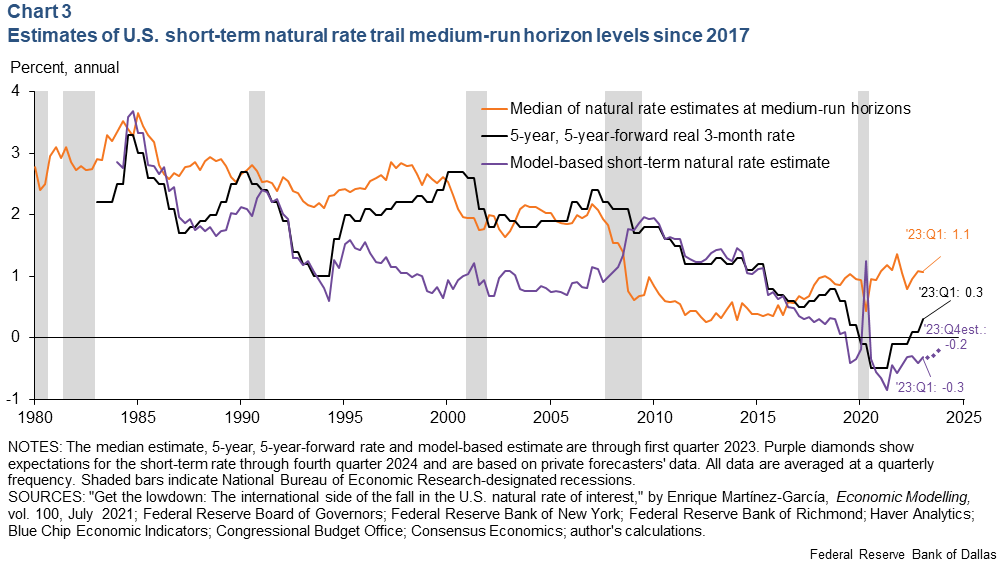
Through the lens of the model, weaker productivity growth in short-run than medium-run horizons accounts for these differences. This is partially related to the productivity paradox—the significant lag between investment in new processes and technologies and the realization of productivity gains.
Short-term r-star ended 2022 below zero, so the strength of the economy—especially the labor market—and the stubbornness of inflation amid rising policy rates do not suggest an upswing in the short-term natural rate. Weak expected global potential growth may be partially responsible. Private forecasters’ views about the global outlook and monetary policy imply short-term r-star will remain slightly below zero through year-end 2023. To quote New York Fed President Williams, “There is no evidence that the era of very low natural rates of interest has ended.”
Gauging monetary policy restrictiveness
There is heightened uncertainty around the estimates of postpandemic monetary policy restrictiveness. However, measured restrictiveness using the medium-run r-star estimates is close to peaks before the financial crisis (Chart 4). Short-term real rates are above the medium-run r-star, so policy rates might need to fall to bring the real rate at medium-run horizons down to its terminal rate.
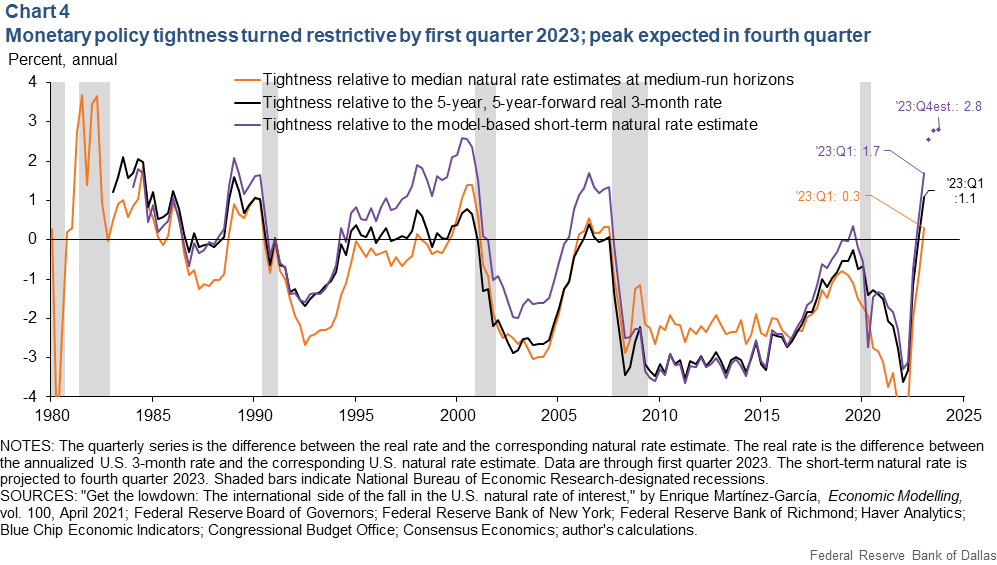
The continued below-zero short-term r-star implies that monetary policy is more restrictive than often thought. The 3-month rate needs to increase less (raising the real rate by a comparable amount) to achieve the same level of policy restrictiveness as before the pandemic. Based on the projections of the short-term real rate and r-star for 2023, private forecasters anticipate monetary policy tightness will peak in fourth quarter 2023 (at near historical highs). The tight conditions will occur even though the short-term nominal rate won’t likely change during the second half of 2023.
Beyond gauging monetary policy restrictiveness, the transmission mechanism is important. The long and variable lags of monetary policy may have also shifted because of postpandemic labor markets. Implicit in the analytical models of r-star is the assumption that the central bank’s monetary policy framework—some form of flexible inflation targeting implemented via a Taylor rule—suffices to keep long-run inflation expectations well-anchored, though this cannot be taken as a given.
R-star is also important for fiscal policy as a key determinant of the sustainability of public debt. Moreover, New York Fed economists have argued for r** (r-double-star, a financial stability real interest rate) as an indicator of financial stress. The concern here is that fiscal or financial instability, when it arises, may affect the transmission mechanism and that would further complicate achieving the Fed’s dual mandate.
About the Author

Enrique Martínez-García
Martínez-García is a senior research economist and advisor in the Research Department at the Federal Reserve Bank of Dallas.
The views expressed are those of the author and should not be attributed to the Federal Reserve Bank of Dallas or the Federal Reserve System.


