
Dallas Fed Energy Survey
Outlook improves even as oil and gas activity little changed; breakeven prices increase
Special questions this quarter include an annual update on breakeven prices by basin, anticipated employee head count changes in 2024, expectations regarding the net firm-level impact of the methane charge and the expected impacts of the recent LNG export facility permitting pause. Among more salient responses, respondents reported higher breakeven prices.
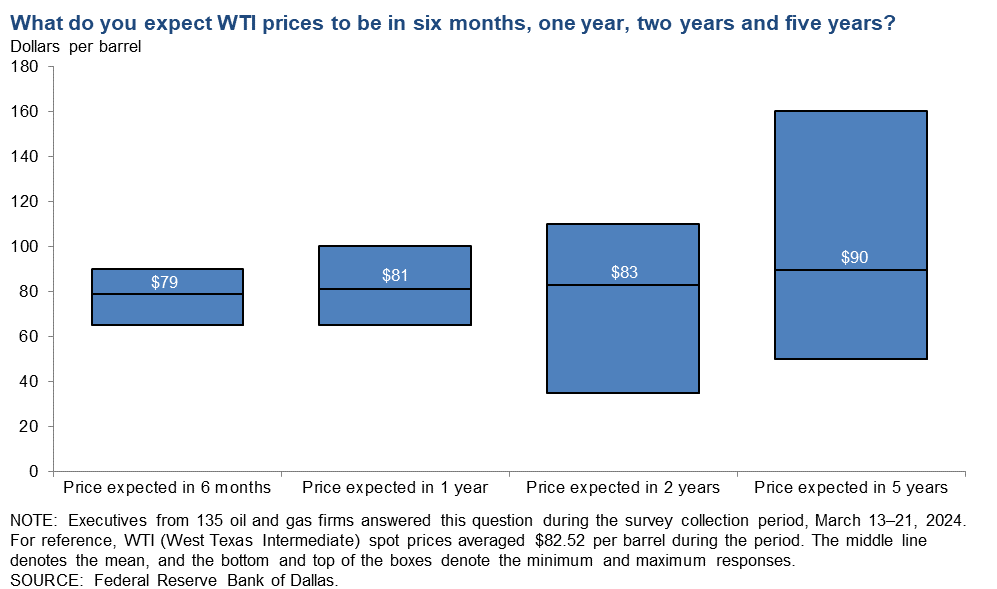
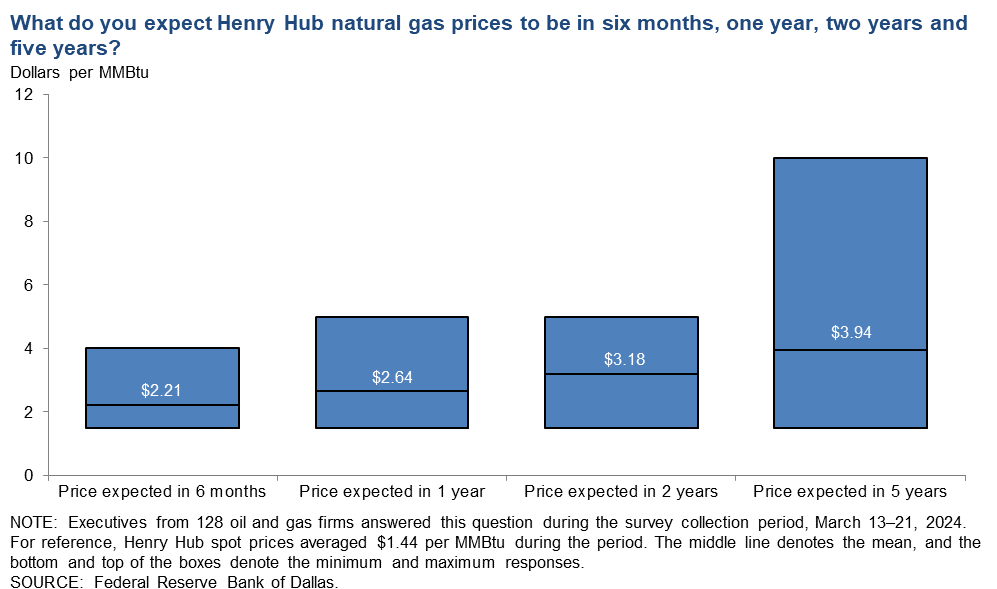
This quarter’s survey also includes for the first time a set of questions regarding price expectations for oil and natural gas over six-month, one-year, two-year and five-year horizons.
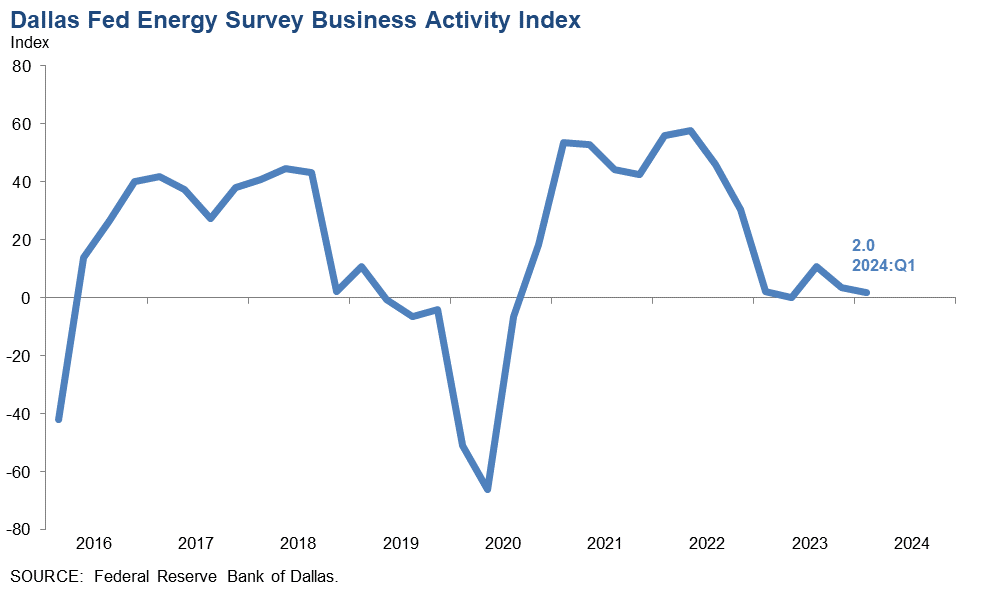
Activity in the oil and gas sector was relatively unchanged in the first quarter of 2024, according to oil and gas executives responding to the Dallas Fed Energy Survey. The business activity index, the survey’s broadest measure of conditions energy firms in the Eleventh District face, was 2.0 in the first quarter, suggesting little to no growth during the quarter. The index was essentially unchanged from last quarter.
Oil and gas production decreased in the first quarter, according to executives at exploration and production (E&P) firms. The oil production index moved down from 5.3 in the fourth quarter to -4.1 in the first quarter, suggesting a small decline in production. Meanwhile, the natural gas production index turned negative, falling sharply from 17.9 to -17.0.
Costs increased at a slightly faster pace for both oilfield services and E&P firms. Among oilfield services firms, the input cost index increased from 21.3 to 31.2. Among E&P firms, the finding and development costs index was relatively unchanged at 24.2. Meanwhile, the lease operating expenses index increased from 22.6 to 33.7.
Oilfield services firms reported modest deterioration in nearly all indicators. The equipment utilization index remained negative but increased from -8.4 in the fourth quarter to -4.2 in the first. The operating margin index moved down from -32.0 to -35.4, suggesting declining margins. The index of prices received for services was unchanged at -6.2.
The aggregate employment index was relatively unchanged at 3.4 in the first quarter. While this is the 13th consecutive positive reading for the index, the low-single-digit reading suggests slow net hiring. The aggregate employee hours index increased from 2.8 in the fourth quarter to 6.9 in the first quarter. Additionally, the aggregate wages and benefits index increased from 21.2 to 32.8.
The company outlook index rebounded in the first quarter, jumping 24 points to 12.0. While the company outlook index increased, it is still below the series average. The overall outlook uncertainty index fell 22 points to 24.1, suggesting that while uncertainty continued to increase on net, fewer firms noted a rise in the recent quarter. The uncertainty index this quarter was slightly above the series average.
On average, respondents expect a West Texas Intermediate (WTI) oil price of $80 per barrel at year-end 2024; responses ranged from $70 to $120 per barrel. When asked about longer-term expectations, respondents on average expect a WTI oil price of $83 per barrel two years from now and $90 per barrel five years from now. Survey participants expect a Henry Hub natural gas price of $2.59 per million British thermal units (MMBtu) at year-end. When asked about longer-term expectations, respondents on average expect a Henry Hub gas price of $3.18 per MMBtu two years from now and $3.94 per MMBtu five years from now. For reference, WTI spot prices averaged $82.52 per barrel during the survey collection period, and Henry Hub spot prices averaged $1.44 per MMBtu.
Next release: June 26, 2024
Data were collected March 13–21, and 147 energy firms responded. Of the respondents, 97 were exploration and production firms and 50 were oilfield services firms.
The Dallas Fed conducts the Dallas Fed Energy Survey quarterly to obtain a timely assessment of energy activity among oil and gas firms located or headquartered in the Eleventh District. Firms are asked whether business activity, employment, capital expenditures and other indicators increased, decreased or remained unchanged compared with the prior quarter and with the same quarter a year ago. Survey responses are used to calculate an index for each indicator. Each index is calculated by subtracting the percentage of respondents reporting a decrease from the percentage reporting an increase. When the share of firms reporting an increase exceeds the share reporting a decrease, the index will be greater than zero, suggesting the indicator has increased over the previous quarter. If the share of firms reporting a decrease exceeds the share reporting an increase, the index will be below zero, suggesting the indicator has decreased over the previous quarter.
Price Forecasts
West Texas Intermediate Crude
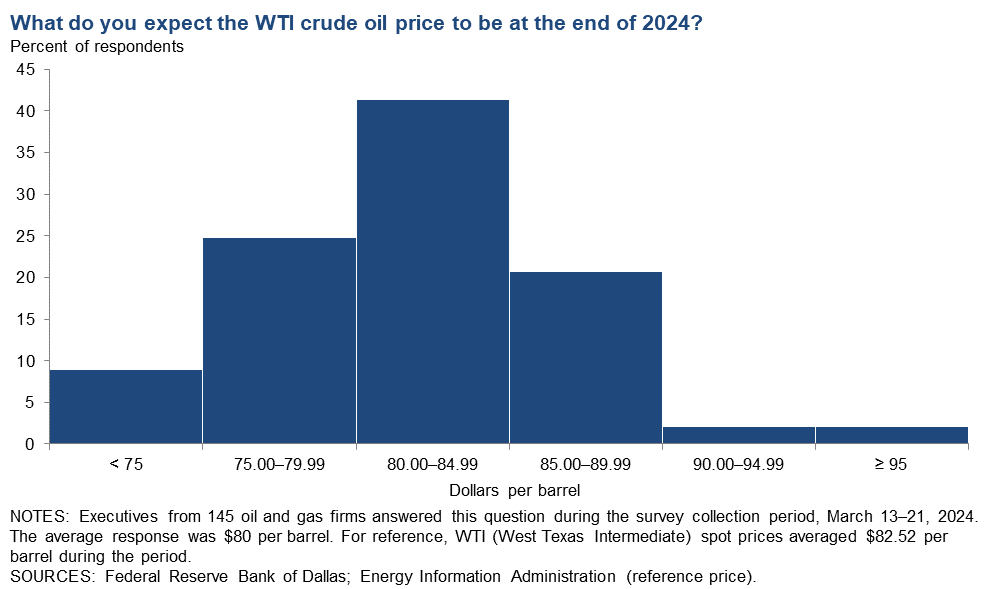
| West Texas Intermediate crude oil price (dollars per barrel), year-end 2024 | ||||
| Indicator | Survey Average | Low Forecast | High Forecast | Price During Survey |
Current quarter | $80.11 | $70.00 | $120.00 | $82.52 |
Prior quarter | $77.68 | $51.00 | $110.00 | $69.77 |
| NOTE: Price during survey is an average of daily spot prices during the survey collection period. SOURCES: Federal Reserve Bank of Dallas; Energy Information Administration. | ||||
Henry Hub Natural Gas
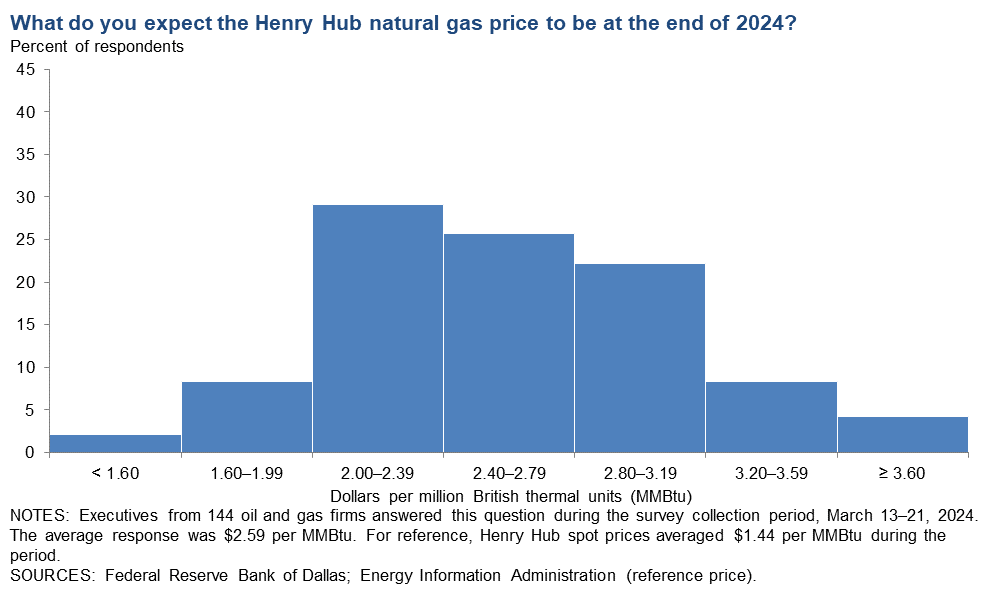
| Henry Hub natural gas price (dollars per MMBtu), year-end 2024 | ||||
| Indicator | Survey Average | Low Forecast | High Forecast | Price During Survey |
Current quarter | $2.59 | $1.50 | $7.00 | $1.44 |
Prior quarter | $3.09 | $1.50 | $5.30 | $2.48 |
| NOTE: Price during survey is an average of daily spot prices during the survey collection period. SOURCES: Federal Reserve Bank of Dallas; Energy Information Administration. | ||||
Special Questions
Data were collected March 13–21; 144 oil and gas firms responded to the special questions survey.
Exploration and production (E&P) firms
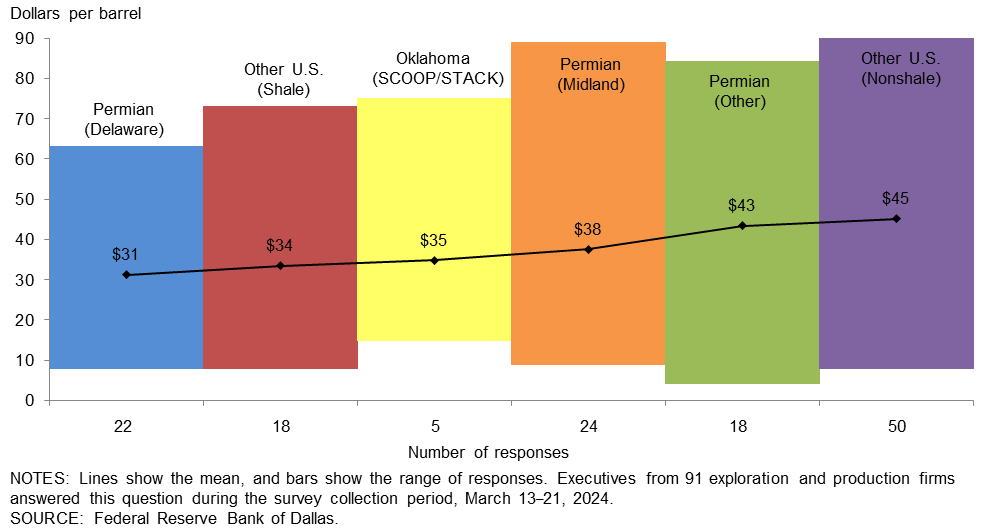
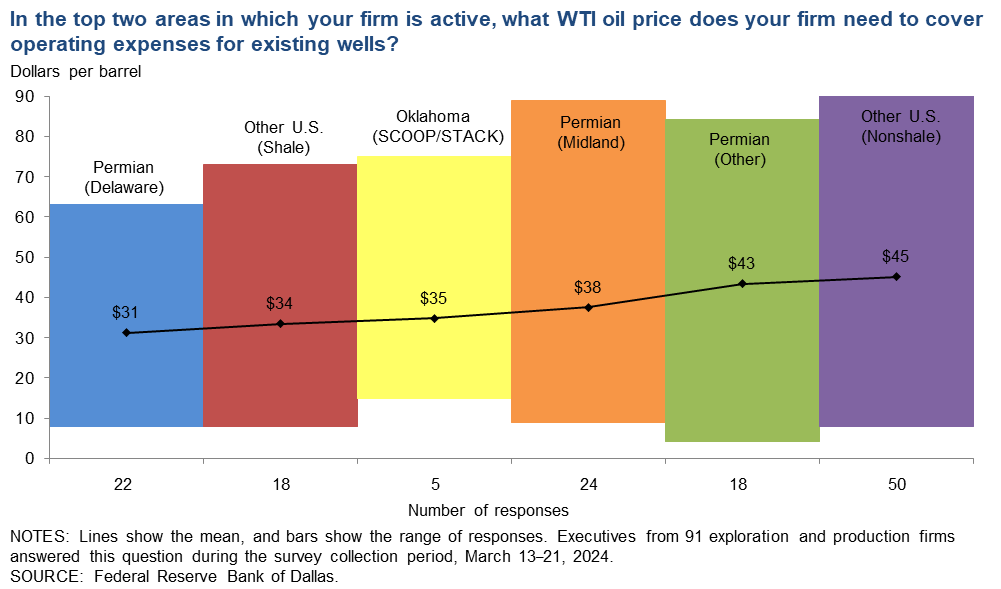
In the top two areas in which your firm is active: What West Texas Intermediate (WTI) oil price does your firm need to cover operating expenses for existing wells?
The average price across the entire sample is approximately $39 per barrel, up from $37 last year. Across regions, the average price necessary to cover operating expenses ranges from $31 to $45 per barrel. Almost all respondents can cover operating expenses for existing wells at current prices.
Large firms (with crude oil production of 10,000 barrels per day or more as of the fourth quarter of 2023) require prices of $26 per barrel to cover operating expenses for existing wells, based on the average of company responses. That compares with $44 for small firms (fewer than 10,000 barrels per day).
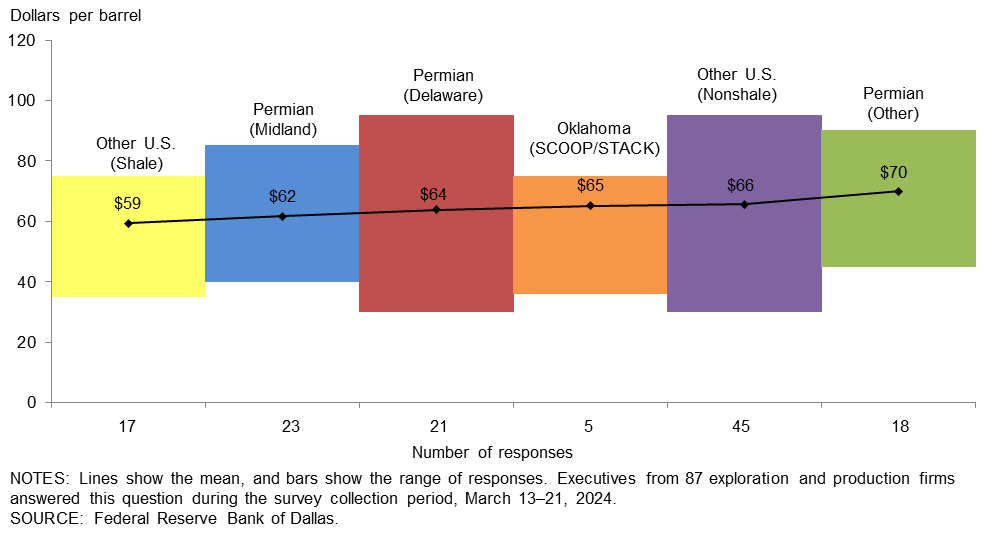
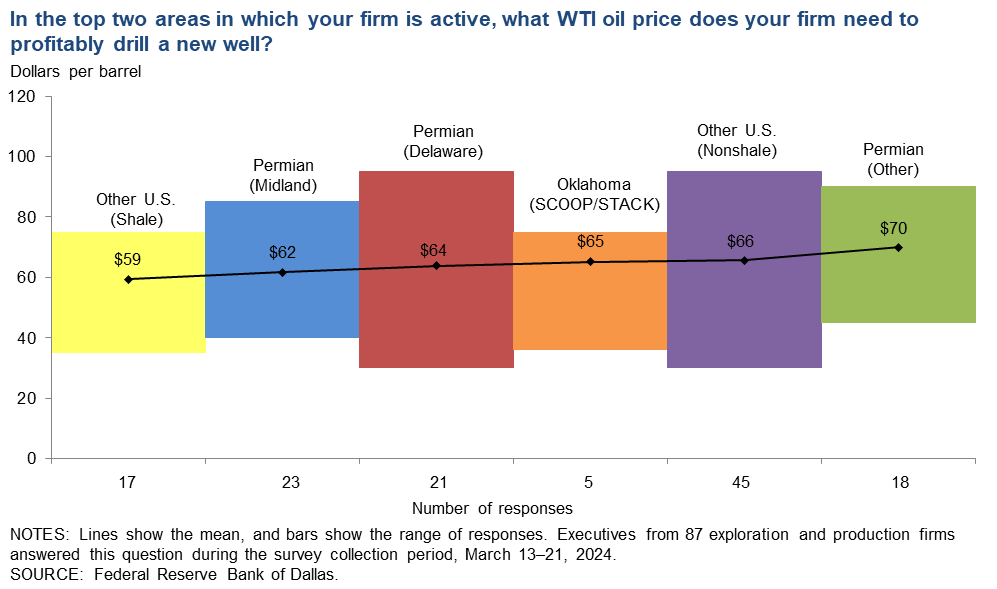
In the top two areas in which your firm is active: What WTI oil price does your firm need to profitably drill a new well?
For the entire sample, firms need $64 per barrel on average to profitably drill, higher than the $62-per-barrel price when this question was asked last year. Across regions, average breakeven prices to profitably drill range from $59 to $70 per barrel. Breakeven prices in the Permian Basin average $65 per barrel, $4 higher than last year. Almost all firms in the survey can profitably drill a new well at current prices. (The WTI spot price was $83 per barrel during the survey period.)
Large firms (with crude oil production of 10,000 barrels per day or more as of the fourth quarter of 2023) require a $58-per-barrel price to profitably drill, based on the average of company responses. That compared with $67 for small firms (fewer than 10,000 barrels per day).
All firms
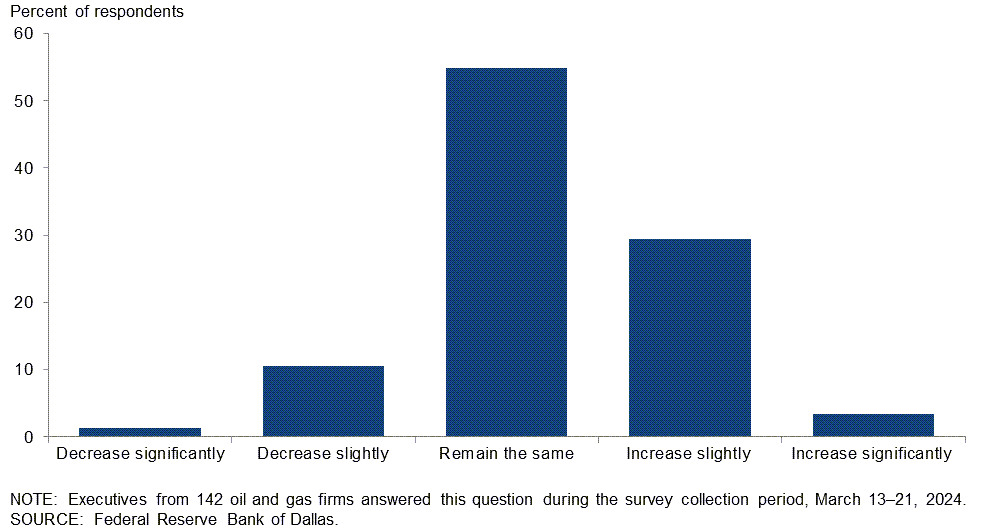
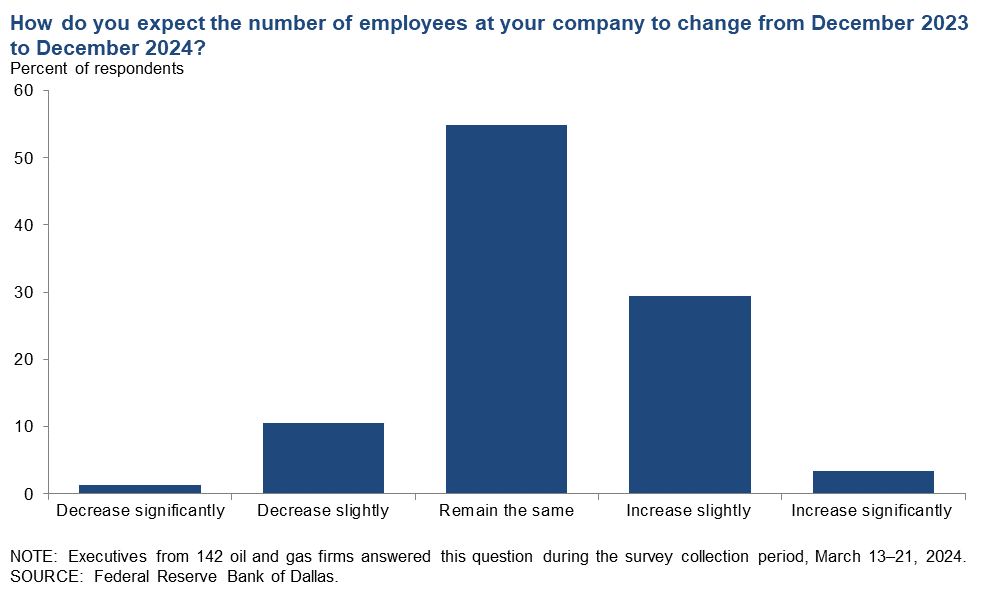
How do you expect the number of employees at your company to change from December 2023 to December 2024?
While the the most-selected response among E&P firms was for employment to “remain the same” in 2024, the most-selected response of support service firms was for employment to “increase slightly.” Only a small percentage of executives expect the number of employees at their firms to decrease. (See table for more detail.)
| Response | Percent of respondents | ||
| All firms | E&P | Services | |
| Increase significantly | 4 | 4 | 2 |
| Increase slightly | 30 | 19 | 49 |
| Remain the same | 55 | 67 | 33 |
| Decrease slightly | 11 | 9 | 14 |
| Decrease significantly | 1 | 1 | 2 |
| NOTES: Executives from 93 exploration and production firms and 49 oil and gas support services firms answered this question during the survey collection period, March 13–21, 2024. The “All” column reports the percentage of the total 142 responses. Percentages may not sum to 100 due to rounding. SOURCE: Federal Reserve Bank of Dallas. |
|||
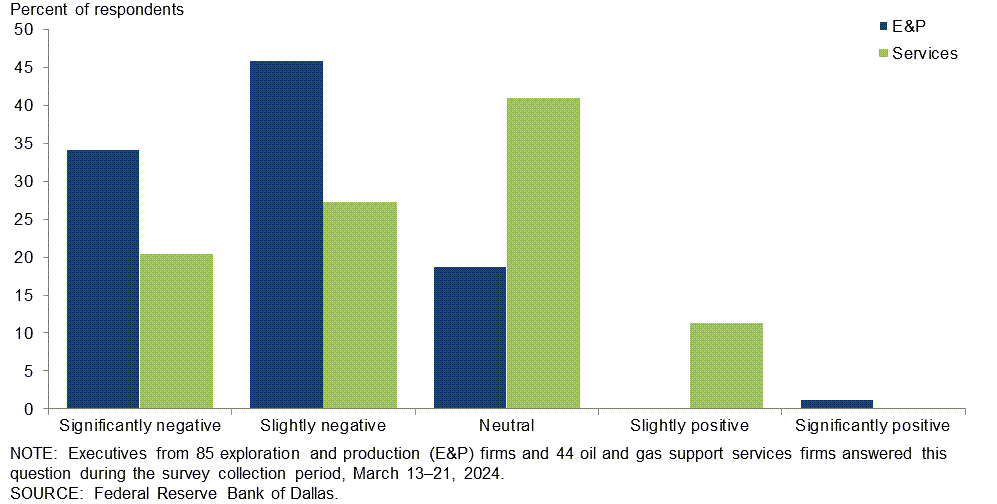
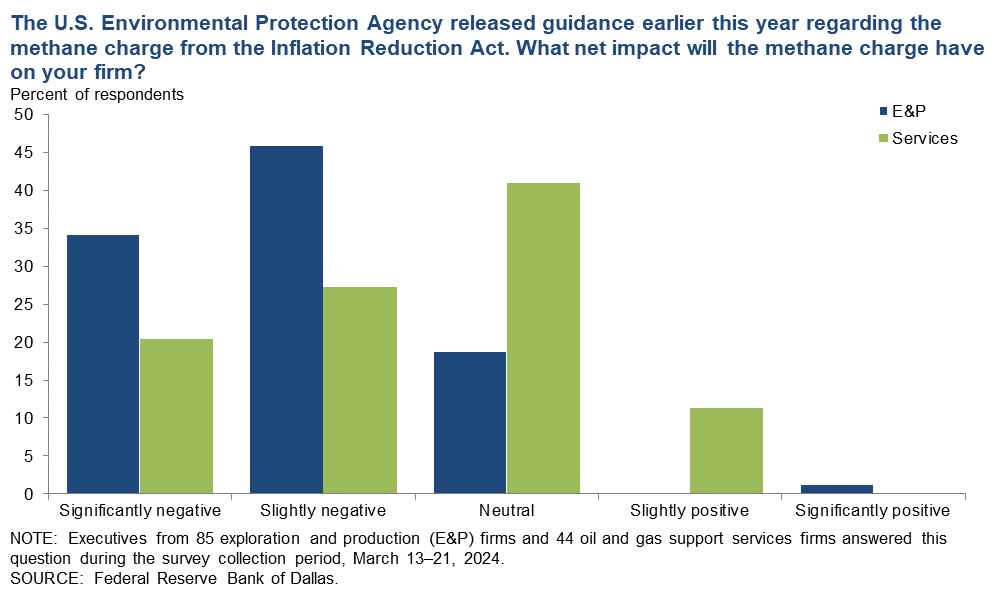
The U.S. Environmental Protection Agency released guidance earlier this year regarding the methane charge from the Inflation Reduction Act. What net impact will the methane charge have on your firm?
The most-selected response among E&P firms was “slightly negative,” chosen by 46 percent of respondents. Another 34 percent selected “significantly negative,” while 19 percent selected “neutral,” and 1 percent expect a positive impact. Meanwhile, the most-selected response among support services firms was “neutral,” chosen by 41 percent of respondents. The next most-popular response was “slightly negative,” selected by 27 percent of support service firms, followed by “significantly negative,” 20 percent. A small group, 11 percent, expect a “slight positive” impact.
When considering small and large E&P firms, executives at small E&P firms were more likely to report a significantly negative impact, 38 percent for small versus 20 for large. (See table for more detail.)
| Response | Percent of respondents | ||||
| All firms | Services | E&P | Large E&P | Small E&P | |
| Significantly negative | 29 | 20 | 34 | 20 | 38 |
| Slightly negative | 40 | 27 | 46 | 60 | 42 |
| Neutral | 26 | 41 | 19 | 20 | 18 |
| Slightly positive | 4 | 11 | 0 | 0 | 0 |
| Significantly positive | 1 | 0 | 1 | 0 | 2 |
| NOTES: Executives from 85 exploration and production firms and 44 oil and gas support services firms answered this question during the survey collection period, March 13–21, 2024. Small E&P firms produced fewer than 10,000 barrels per day (b/d) in the fourth quarter of 2023, while large E&P firms produced 10,000 b/d or more. Responses came from 65 small firms and 20 large firms. Percentages may not sum to 100 due to rounding. SOURCE: Federal Reserve Bank of Dallas. |
|||||
Exploration and production (E&P) firms
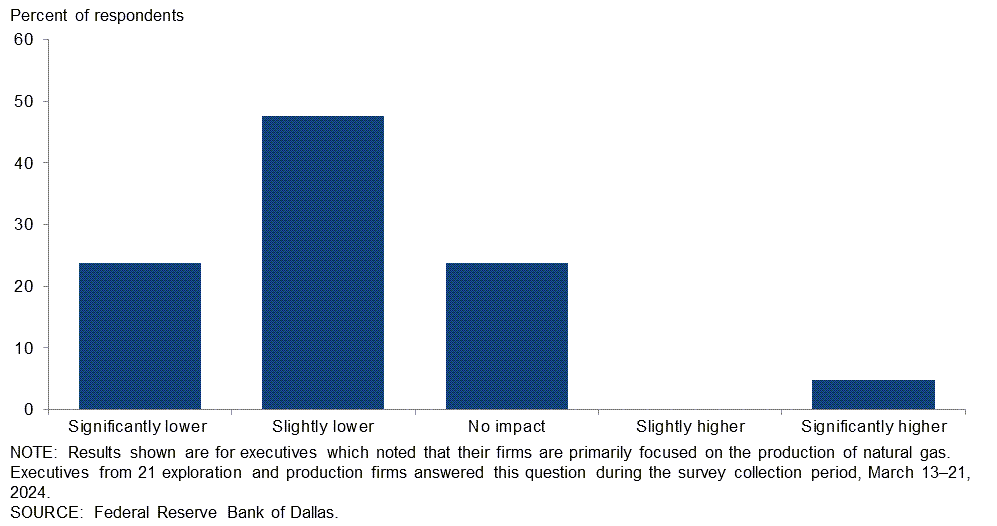
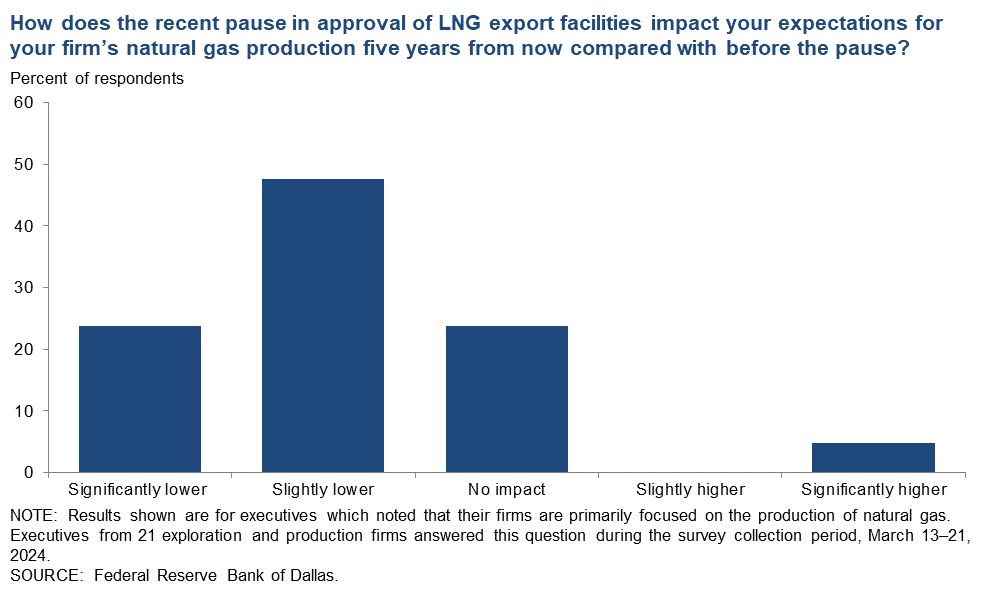
How does the recent pause in approval of LNG export facilities impact your expectations for your firm’s natural gas production five years from now compared with before the pause?
Among executives who indicated their firms are primarily focused on the production of natural gas, slightly under half—48 percent—expect their firms’ natural gas production five years from now to be slightly lower than their expectations before the pause. Twenty-four percent said significantly lower, while an additional 24 percent expect no impact. Only 5 percent of executives indicated an increase in expectations due to the recent pause.
Executives from firms not primarily focused on the production of natural gas also expect some impacts from the LNG pause. (See table for more detail.)
| Response | Percent of respondents | |
| Primarily focused on natural gas | Not focused on natural gas | |
| Significantly lower | 24 | 22 |
| Slightly lower | 48 | 19 |
| No impact | 24 | 58 |
| Slightly higher | 0 | 0 |
| Significantly higher | 5 | 1 |
| NOTES: Executives from 90 exploration and production firms answered this question during the survey collection period, March 13–21, 2024. Executives were asked whether their firms are primarily focused on the production of natural gas. Responses for 21 executives which noted "yes" can be found in the “primarily focused on natural gas” column, and responses for 69 executives which noted "no" can be found in the "not focused on natural gas" column. SOURCE: Federal Reserve Bank of Dallas. |
||
Oil and gas support services firms
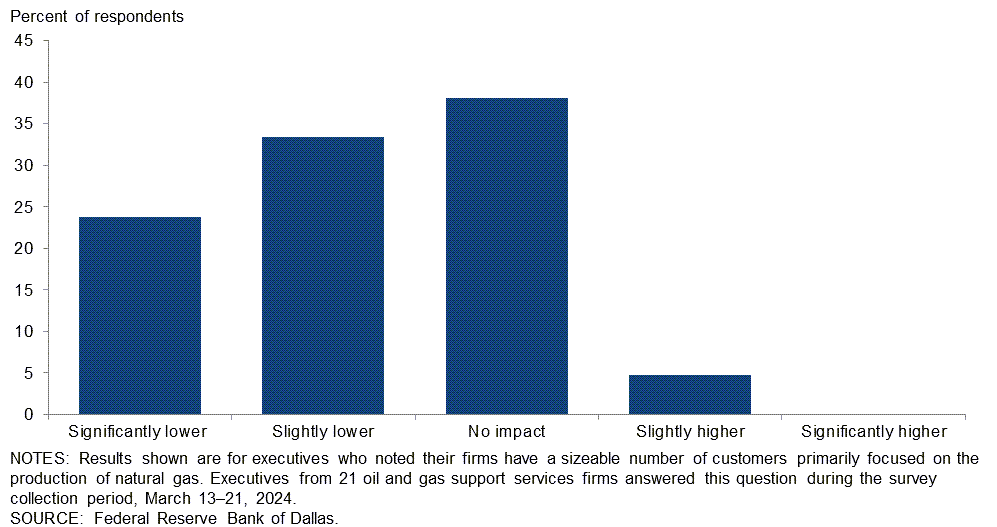
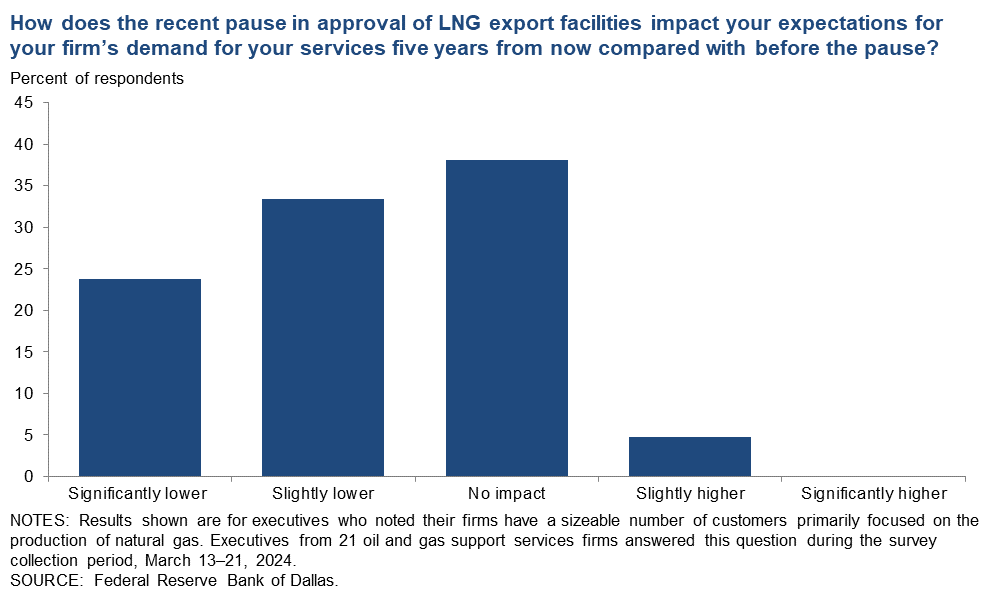
How does the recent pause in approval of LNG export facilities impact your expectations for your firm’s demand for your services five years from now compared with before the pause?
Among executives who indicated their firms have a sizeable number of customers primarily focused on natural gas production, a majority—57 percent—expect demand for their firms’ services five years from now to be lower than before the pause, with 33 percent indicating demand will be “slightly lower” and 24 percent selecting “significantly lower.” Thirty-eight percent stated no impact, and 5 percent of executives expect customer demand for their firms’ services to be slightly higher than before the pause.
Executives from firms without a sizeable number of customers primarily focused on natural gas production also expect some impacts from the LNG pause. (See table for more detail.)
| Response | Percent of respondents | |
| Firms with customers focused on natural gas | Firms without customers focused on natural gas | |
| Significantly lower | 24 | 8 |
| Slightly lower | 33 | 46 |
| No impact | 38 | 46 |
| Slightly higher | 5 | 0 |
| Significantly higher | 0 | 0 |
| NOTES: Executives from 45 oil and gas support services firms answered this question during the survey collection period, March 13–21, 2024. Executives were asked whether their firms have a sizeable number of customers primarily focused on the production of natural gas. Responses for 21 executives which noted "yes" can be found in the “firms with customers focused on natural gas” column, and responses for 24 executives which noted "no" can be found in the "firms without customers focused on natural gas.” SOURCE: Federal Reserve Bank of Dallas. |
||
Special Questions Comments
Exploration and Production (E&P) Firms
- Our no-impact answer to the LNG pause question assumes that the pause is lifted within the next year. With a longer pause or a future ban, we would expect a negative impact to U.S. natural gas pricing.
- The LNG export pause effect is difficult to forecast several years into the future as both demand, supply and commodity pricing can all change.
- The administration needs to reverse course and show support for American energy while working on common sense solutions that continue the efforts to make production and use of these vital resources as clean as practically possible. Our modern society simply cannot function without the use of fossil fuels. The decision to invest the immense amount of capital needed to provide these vital resources cannot be made if the current level of uncertainty isn't changed.
- The LNG export pause is just that, a pause. It is virtue signaling that will have no benefit other than short-term price depreciation and consolidation of impacted firms by majors that operate largely outside the U.S. without the watchful eyes of environmentalists to provide oversight.
- Regarding the methane charge, the impact is overall not too impactful but will likely require marginal wells to be plugged, given the cost to bring them into compliance.
- Continued ignorance and pandering by the administration. Using an influencer to highlight a positive climate impact from stopping LNG exports (sorry, pausing) will call the stability of our supply into question while causing the displacement of cleaner natural gas with less clean coal.
- This administration has limited knowledge of what is required to enable economically successful production of domestic hydrocarbons.
- The administration’s energy policies make no sense.
- LNG, Bureau of Land Management leasing delays, additional permitting costs, time required and many other policies from Washington and certain governors are hampering growth and collectively are comprehensively debasing the industry.
- With the current permits already approved, I expect a very minor impact over the next five years, and if the political environment changes, I expect no impact.
- Natural gas prices need to be in the $4 per MMBtu range to attract our exploration attention. Current wellhead prices barely cover overhead and have deceased free cash flow.
Oil and Gas Support Services Firms
- Our biggest concern is the evolving merger and acquisition activity for U.S. E&P operators. As the operator pool shrinks, the oilfield services will inevitably follow suit. This leads to concerns on additional oilfield services mergers or worse, aggressive pricing from competitors striving to stay alive.
- The signal sent to our international LNG customers was not good. Other suppliers will fill the void, which will permanently increase the U.S. trade deficit and ultimately harm our economy.
- Natural gas is not a large part of our operation; therefore, the impact is not significant for us, but it will be for operators deeply involved in natural gas production.
- The LNG pause decreases the likelihood of breaking into the East Texas market as the depressed natural gas prices there limit the work for service companies.
- The pause in permits for LNG export facilities will not impact near-term exportation efforts already underway but could impact the incremental capacity envisioned in 2027 and beyond. At a minimum, the ploy introduces more uncertainty for exporters. Additionally, we are not the only country adding capacity, and delays in building out additional U.S. export capacity may allow competitor countries to seize market share from U.S. exporters in the future.
- A healthy natural gas price is essential to the energy industry.
Additional Comments »
Historical data are available from first quarter 2016 to the most current release quarter.
Business Indicators: Quarter/Quarter
| Business Indicators: All Firms Current Quarter (versus previous quarter) | |||||
| Indicator | Current Index | Previous Index | % Reporting Increase | % Reporting No Change | % Reporting Decrease |
Level of Business Activity | 2.0 | 3.6 | 26.0 | 50.0 | 24.0 |
Capital Expenditures | 5.6 | 3.6 | 32.6 | 40.4 | 27.0 |
Supplier Delivery Time | –5.0 | –2.2 | 7.8 | 79.4 | 12.8 |
Employment | 3.4 | 4.2 | 17.9 | 67.6 | 14.5 |
Employee Hours | 6.9 | 2.8 | 20.7 | 65.5 | 13.8 |
Wages and Benefits | 32.8 | 21.2 | 34.2 | 64.4 | 1.4 |
| Indicator | Current Index | Previous Index | % Reporting Improved | % Reporting No Change | % Reporting Worsened |
Company Outlook | 12.0 | –12.4 | 26.9 | 58.2 | 14.9 |
| Indicator | Current Index | Previous Index | % Reporting Increase | % Reporting No Change | % Reporting Decrease |
Uncertainty | 24.1 | 46.1 | 39.3 | 45.5 | 15.2 |
| Business Indicators: E&P Firms Current Quarter (versus previous quarter) | |||||
| Indicator | Current Index | Previous Index | % Reporting Increase | % Reporting No Change | % Reporting Decrease |
Level of Business Activity | 4.2 | 7.5 | 25.0 | 54.2 | 20.8 |
Oil Production | –4.1 | 5.3 | 18.8 | 58.3 | 22.9 |
Natural Gas Wellhead Production | –17.0 | 17.9 | 12.8 | 57.4 | 29.8 |
Capital Expenditures | 0.0 | 0.0 | 29.3 | 41.3 | 29.3 |
Expected Level of Capital Expenditures Next Year | 36.5 | 1.0 | 46.9 | 42.7 | 10.4 |
Supplier Delivery Time | –7.5 | –5.3 | 4.3 | 83.9 | 11.8 |
Employment | 6.2 | 1.1 | 15.6 | 75.0 | 9.4 |
Employee Hours | 10.4 | 0.0 | 16.7 | 77.1 | 6.3 |
Wages and Benefits | 34.4 | 14.8 | 34.4 | 65.6 | 0.0 |
Finding and Development Costs | 24.2 | 24.4 | 32.6 | 58.9 | 8.4 |
Lease Operating Expenses | 33.7 | 22.6 | 42.1 | 49.5 | 8.4 |
| Indicator | Current Index | Previous Index | % Reporting Improved | % Reporting No Change | % Reporting Worsened |
Company Outlook | 15.6 | –9.0 | 28.9 | 57.8 | 13.3 |
| Indicator | Current Index | Previous Index | % Reporting Increase | % Reporting No Change | % Reporting Decrease |
Uncertainty | 21.1 | 44.0 | 37.9 | 45.3 | 16.8 |
| Business Indicators: O&G Support Services Firms Current Quarter (versus previous quarter) | |||||
| Indicator | Current Index | Previous Index | % Reporting Increase | % Reporting No Change | % Reporting Decrease |
Level of Business Activity | –2.0 | –4.2 | 28.0 | 42.0 | 30.0 |
Utilization of Equipment | –4.2 | –8.4 | 27.1 | 41.7 | 31.3 |
Capital Expenditures | 16.4 | 10.7 | 38.8 | 38.8 | 22.4 |
Supplier Delivery Time | 0.0 | 4.1 | 14.6 | 70.8 | 14.6 |
Lag Time in Delivery of Firm's Services | 4.0 | 0.0 | 12.2 | 79.6 | 8.2 |
Employment | –2.1 | 10.5 | 22.4 | 53.1 | 24.5 |
Employment Hours | 0.0 | 8.3 | 28.6 | 42.9 | 28.6 |
Wages and Benefits | 30.0 | 34.0 | 34.0 | 62.0 | 4.0 |
Input Costs | 31.2 | 21.3 | 35.4 | 60.4 | 4.2 |
Prices Received for Services | –6.2 | –6.2 | 12.2 | 69.4 | 18.4 |
Operating Margin | –35.4 | –32.0 | 10.4 | 43.8 | 45.8 |
| Indicator | Current Index | Previous Index | % Reporting Improved | % Reporting No Change | % Reporting Worsened |
Company Outlook | 4.5 | –18.8 | 22.7 | 59.1 | 18.2 |
| Indicator | Current Index | Previous Index | % Reporting Increase | % Reporting No Change | % Reporting Decrease |
Uncertainty | 30.0 | 50.0 | 42.0 | 46.0 | 12.0 |
Business Indicators: Year/Year
| Business Indicators: All Firms Current Quarter (versus same quarter a year ago) | |||||
| Indicator | Current Index | Previous Index | % Reporting Increase | % Reporting No Change | % Reporting Decrease |
Level of Business Activity | 1.5 | 0.7 | 32.8 | 35.8 | 31.3 |
Capital Expenditures | 7.7 | 8.1 | 40.3 | 27.1 | 32.6 |
Supplier Delivery Time | –12.8 | –11.7 | 11.4 | 64.4 | 24.2 |
Employment | 11.1 | 7.2 | 28.1 | 54.8 | 17.0 |
Employee Hours | 6.0 | 0.0 | 21.8 | 62.4 | 15.8 |
Wages and Benefits | 52.2 | 51.1 | 55.1 | 41.9 | 2.9 |
| Indicator | Current Index | Previous Index | % Reporting Improved | % Reporting No Change | % Reporting Worsened |
Company Outlook | 10.0 | –7.7 | 36.7 | 36.7 | 26.7 |
| Business Indicators: E&P Firms Current Quarter (versus same quarter a year ago) | |||||
| Indicator | Current Index | Previous Index | % Reporting Increase | % Reporting No Change | % Reporting Decrease |
Level of Business Activity | 7.8 | 4.4 | 30.3 | 47.2 | 22.5 |
Oil Production | –1.1 | 3.3 | 24.7 | 49.4 | 25.8 |
Natural Gas Wellhead Production | –18.4 | 9.0 | 20.7 | 40.2 | 39.1 |
Capital Expenditures | 2.3 | 6.7 | 36.0 | 30.2 | 33.7 |
Expected Level of Capital Expenditures Next Year | 26.1 | 16.6 | 46.6 | 33.0 | 20.5 |
Supplier Delivery Time | –18.4 | –15.7 | 5.7 | 70.1 | 24.1 |
Employment | 13.5 | 4.4 | 23.6 | 66.3 | 10.1 |
Employee Hours | 10.2 | 2.3 | 17.0 | 76.1 | 6.8 |
Wages and Benefits | 52.2 | 41.7 | 52.2 | 47.8 | 0.0 |
Finding and Development Costs | 28.0 | 25.3 | 40.4 | 47.2 | 12.4 |
Lease Operating Expenses | 38.6 | 37.1 | 50.0 | 38.6 | 11.4 |
| Indicator | Current Index | Previous Index | % Reporting Improved | % Reporting No Change | % Reporting Worsened |
Company Outlook | 14.4 | –7.1 | 35.5 | 43.4 | 21.1 |
| Business Indicators: O&G Support Services Firms Current Quarter (versus same quarter a year ago) | |||||
| Indicator | Current Index | Previous Index | % Reporting Increase | % Reporting No Change | % Reporting Decrease |
Level of Business Activity | –11.1 | –6.3 | 37.8 | 13.3 | 48.9 |
Utilization of Equipment | –11.1 | –17.1 | 37.8 | 13.3 | 48.9 |
Capital Expenditures | 18.6 | 10.9 | 48.8 | 20.9 | 30.2 |
Supplier Delivery Time | –2.2 | –4.3 | 22.2 | 53.3 | 24.4 |
Lag Time in Delivery of Firm's Services | 6.7 | 0.0 | 17.8 | 71.1 | 11.1 |
Employment | 6.6 | 12.8 | 37.0 | 32.6 | 30.4 |
Employment Hours | –2.2 | –4.4 | 31.1 | 35.6 | 33.3 |
Wages and Benefits | 52.2 | 69.5 | 60.9 | 30.4 | 8.7 |
Input Costs | 71.2 | 65.2 | 75.6 | 20.0 | 4.4 |
Prices Received for Services | 13.3 | 10.8 | 42.2 | 28.9 | 28.9 |
Operating Margin | –35.6 | –22.2 | 22.2 | 20.0 | 57.8 |
| Indicator | Current Index | Previous Index | % Reporting Improved | % Reporting No Change | % Reporting Worsened |
Company Outlook | 2.2 | –8.7 | 38.6 | 25.0 | 36.4 |
Activity Chart
Comments from Survey Respondents
These comments are from respondents’ completed surveys and have been edited for publication. Comments from the Special Questions survey can be found below the special questions.
Exploration and Production (E&P) Firms
- Until the next administration is decided, we're in a state of flux when it comes to making certain business decisions.
- Growth in renewable electricity in the West Texas ERCOT region has led to less efficacy in the system due to intermittency. In turn, this had led to a higher heat load base, and as a result, power prices are increasing modestly even as natural gas fuel input pricing is historically low.
- Investor apathy will continue for the energy sector until it’s too late. The impending shale supply fiasco (drainage!) will be front-page news within the next two years, and inflation will be very hot again. Shale will likely be unable to help for round two, when oil prices are greater than $120 per barrel. Why do you think there's been $250 billion of merger and acquisition activity in 12 months? Because the majors believe long term is $60 per barrel of oil? OPEC is back in the driver’s seat.
- Natural gas prices remain challenged, primarily due to the overhang of storage and lack of winter demand. Crude oil markets have continued to be constructive. We have decreased capital investments in our natural gas portfolio and increased capital investments in our oil portfolio.
- The volatility in geopolitical risk is more concerning than a year ago. Domestic political uncertainty has increased — no confidence in either party to lead.
- I can't recall a more uncertain time with disturbing world conflicts and the choice we have to make in the U.S. presidential election.
- The strength of the market has increased, but the methane detection enforcement procedures for small producers is a looming crisis.
- Continued governmental and regulatory stipulations have an increased bearing on project selection.
- Washington continues to pick business winners and losers, and this practice hampers cooperation and fairness across all sectors. The open denigration and policy blocking of hydrocarbons, a vital part of energy, needs to stop. Soundbites to undermine an entire industry that is critical to our country's standing in the world do no one any good.
- Natural gas is currently pricing at or below costs of production.
- Permits to drill and operate on private land are too difficult to obtain from regulatory authorities in certain states such as Florida, California and Colorado. With respect to Federal leases, which are administered by the Bureau of Land Management, there is too much uncertainty surrounding future changes in regulations and permitting requirements. Such factors limit the ability of small petroleum companies to expand and grow.
- The Great Turnover (wave of retirements backfilled by greenhorns) is continuing to result in elementary mistakes in land work, division orders, and, thus, revenue distributions from oil and gas purchasers. I am seeing increased joint interest billings errors. Collectively, this is causing a diversion of staff time. The greenhorns in the positions making these mistakes are defensive and insisting they are right even when confronted with the facts. Washington’s war against domestic oil and gas is winning. Accounting firms don’t want oil and gas firms as clients, preferring only clients in a so-called reputable industry. Bankers are stiff-arming discussions.
- Natural gas is the primary commodity for our industry in East Texas. This makes our activity depend on pricing for natural gas. The low prices we are experiencing now are causing us to tuck it in and keep our powder dry. The administration's efforts to curb the liquified natural gas (LNG) build-out has hurt our industry. America has lost jobs due to this. This climate change agenda is destroying GDP as well.
Oil and Gas Support Services Firms
- Customer consolidation is an issue affecting our business.
- Access to capital continues to challenge the industry.
- There are many factors negatively impacting the U.S. oilfield services sector. One major issue is that there are too many small, undercapitalized companies. This is leading to an overly competitive and undisciplined market. This creates a short-lived benefit for oil and gas companies, which will quickly begin to see a deterioration in oilfield service quality, safety and stability. The oilfield services industry needs to follow the same consolidation and efficiency path as the oil and gas drillers. Otherwise, we will continue to see a weak oilfield services industry that is not able to match the scale and professionalism of their oil and gas customers.
- The administration’s pause in approving or reviewing LNG export facilities sent a chill through our industry.
- The first quarter of 2024 was surprisingly quiet, especially compared with the first quarter of 2023. We attributed the quiet first quarter 2024 to operators waiting to understand the landscape as heavy merger and acquisition activity continued. It feels like second quarter 2024 is seeing glimmers of increased activity and third quarter 2024 has the potential to be stronger. We are optimistic for the third quarter of 2024.
- Uncertainty of the election outcomes and related policy changes have most oil and gas operators just making minimal investments to maintain production levels. The recent suspension of LNG export permits is also negatively impacting an already oversupplied gas market resulting from associated gas production. We are once again entering an unnecessary period of uncertainty due to inept energy policies.
- Costs of labor and goods are certainly challenging our bottom line and making margins thinner than before. Company men are holding the line on rate increases even though they are enjoying record profits from higher commodity prices. We have to find a way to educate them on what’s affecting our company and get them to buy in to the need for higher rates to keep good companies like ours performing for them.
- Lower natural gas prices combined with E&P consolidation, and their unrelenting focus on capital and operational efficiencies, are causing U.S. lower 48 rig count to remain flatish. The outlook for the first half of 2024 is for U.S. lower 48 rig count to move sideways and for an increased rig count in the second half of 2024 driven primarily by private E&P incremental rig adds in oily basins. Until gas-directed activity rebounds, however, U.S. lower 48 rig count will remain more muted. There are reasons for optimism later this year and especially for 2025.
Questions regarding the Dallas Fed Energy Survey can be addressed to Michael Plante at Michael.Plante@dal.frb.org or Kunal Patel at Kunal.Patel@dal.frb.org.
Sign up for our email alert to be automatically notified as soon as the latest Dallas Fed Energy Survey is released on the web.