
State output remains distinctly Texan, while jobs mix increasingly resembles the U.S.
Lore and data have historically suggested that Texas is unlike any other place. Over the past 40 years, change has swept the state. Texas' employment composition has increasingly come to resemble the entirety of the U.S., more so than even California or New York. But Texas economic output is another story. While dwindling oil production in the 1980s and 90s initially pushed the sources of output to converge with the composition of national gross domestic product, the shale oil boom reversed that trend.
Bottom line: Texas remains unique. If Texas, an energy powerhouse, were a country, it would rank third globally in crude oil and in natural gas production. Also dominant in downstream energy, Texas produces 30 percent of the nation’s gasoline and 75 percent of its petrochemicals. Texas also rules renewables. It is No. 1 in wind energy and ranks second in utility-scale solar. The state’s population is distinctive, too. It’s younger and has a higher Hispanic share than all but one other state.
Amid the distinguishing characteristics of Texans and what they produce, the state’s industry employment mix began to evolve in the 1980s to more resemble that of the nation, with the Houston and San Antonio metropolitan areas leading the way.
Measuring local employment composition relative to the U.S.
A similarity index is a tool that can assess a region’s employment composition by industry relative to that of the nation. It signals a local economy’s specialization—certain industry clusters can set a region apart from the nation. Similarity index readings typically vary by the size of the underlying economy as well as by an area’s location and geographic endowments that help define its local industry. Smaller geographic regions, such as midsized metropolitan areas, tend to be more idiosyncratic relative to bigger places that generally contain a greater variety and depth of firms and institutions, such as universities, land and sea ports, airports and government agencies.
For example, Laredo, Texas, on the border with Mexico, has an outsized transportation and warehousing sector as well as a high share of federal government employment. Midland–Odessa, sister cities at the heart of the Texas Permian Basin, have a high dependence on oil and gas production and oilfield service companies.
Examining local economy similarities and differences relative to the nation is important to understanding local growth potential as well as exposure to shocks and business cycles. Where oil and gas dominate, for example, employment and unemployment are likely to be more cyclical because of energy price volatility. Those regions also tend to have higher than average wages. On the other hand, a region dominated by a large health care sector might see greater than average employment stability.
In general, the big shifts in the jobs-based similarity index for Texas and its metros have been associated with less variability in job growth and more muted booms and busts.
Texas job mix looks a lot like the U.S.
Similarity indexes, much like location quotients or a Herfindahl index, numerically depict local industry employment composition. Arithmetically, the similarity index is one minus the aggregated differences between industry shares of local jobs versus the industry shares of national jobs.[1] When the difference in shares is small, the index tends toward 1, indicating a local mix is close to the national mix.
The Texas index value of 0.97 in 2022 suggests that despite the presence of a large upstream and downstream energy industry—from oilfields to refineries—the state’s employment profile is surprisingly close to that of the U.S. in aggregate (Chart 1). By comparison, the payroll mix, since the mid-80s, has more strongly resembled the nation than New York’s or California’s composition.
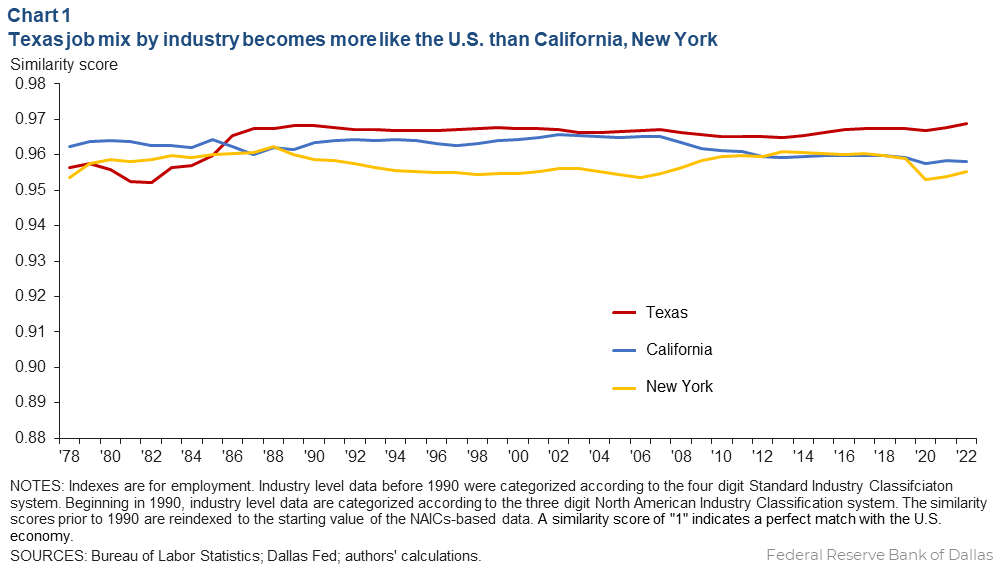
The rise in the similarity index for employment came as the Texas economy diversified away from oil, a shift that didn’t come easy. The massive 1982–86 oil bust on the heels of a U.S. recession and the subsequent shock from the savings and loan crisis hit Texas hard. It helped propel a huge shift from oil production and construction jobs toward services industries. The change signaled sustained growth of professional and business services, particularly within scientific and technical sectors.
Beginning in 1991, Texas grew rapidly, and its job-based similarity index appeared remarkably stable. The trend continued despite a seismic change that followed implementation of the North American Free Trade Agreement in 1994 linking the U.S. more closely with the economies of Mexico and Canada. The agreement most notably affected border metros, though the impact was felt far beyond.
The 2010s brought new technology that enabled the extraction of shale oil, which facilitated renewed oil exports and growth in petrochemicals and refining. Still, these are capital-intensive industries with relatively small employment footprints that were insufficient to materially affect the employment-based similarity index.
Changing environment correlated with growth of services
The state labor market’s increasing similarity to the nation came with accelerated growth of service sector jobs. Services tend to represent less cyclical employment, contributing to improved stability in total payrolls. Such diversification is broadly regarded as positive for Texas.
For all of the state’s ups and downs in the days of being a cotton, cattle and oil economy, Texas total payrolls grew 2 percent a year on average from 1978 to 1999, nearly a full percentage point faster than the nation. While that trend growth rate slowed to 1.7 percent over the 20 years before the pandemic, the state’s growth premium over the U.S. held at nearly 1 percentage point. The premium was supported in part by faster population growth than in the country as a whole, in part due to migration of firms and people to the state. Commercially favorable state tax and regulatory policies also helped.
New York’s employment-based similarity index did not shift as dramatically toward the U.S. as the Texas index in the 1980s but rather began drifting from the nation in the 1990s as the financial sector grew. Specifically, New York’s job similarity index edged down, reflecting shifts in the relative shares of credit intermediaries (financial institutions), education services, health care and administrative services.
New York City, the state’s largest economic engine, began the 2000s with the 9/11 attacks followed later in the decade by the Global Financial Crisis, which pushed the state closer to the national employment profile by destroying jobs in the financial sector.
California has modestly differentiated itself from the nation, especially during the 2010s. Decreases in the share of jobs in manufacturing (mainly apparel and computer and electronic equipment), justice and public safety and crop production diminished the state’s similarity rating.
Despite payroll similarity, Texas’ GDP mix still stands apart
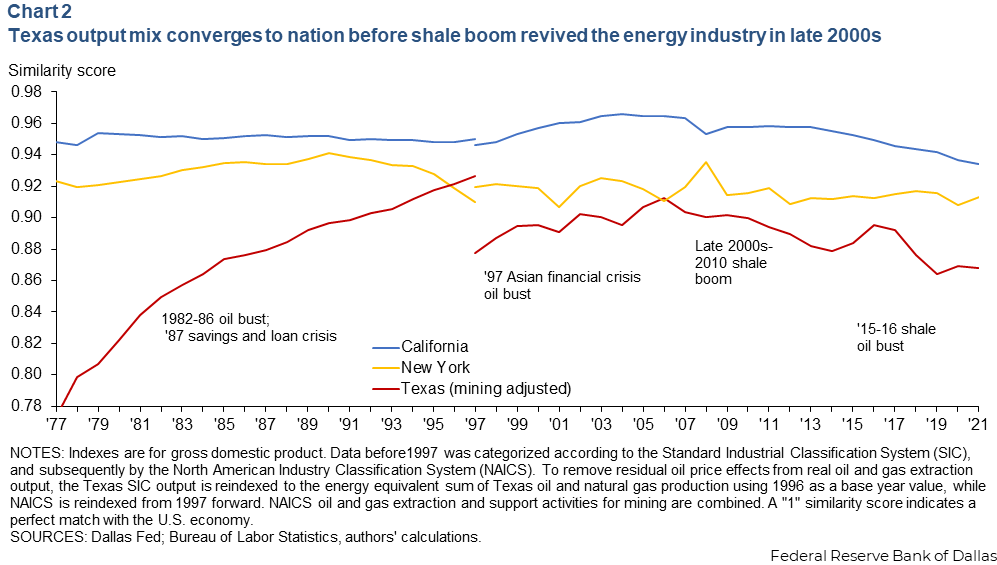
While employment tells the story of Texas becoming more like the country, what it produces (state output as measured by GDP) tells a different tale. Texas remains a petroleum and manufacturing juggernaut, giving credence to believers that Texas stands apart.
In recent years, mining—mostly oil and gas production and oilfield services—accounted for about 9 percent of nominal state GDP (versus 0.9 percent for the nation), while manufacturing accounted for more than 12 percent of GDP (versus 11 percent nationally).[2]
Within Texas manufacturing sectors, the refining share represented 2.4 percent of GDP, chemicals and plastics and rubber products represented 2.4 percent, and the remainder, including equipment and high tech, 7.1 percent. Many firms in Texas’ services sector are at least partially dependent on spending by energy and manufacturing companies and their relatively well paid employees.
Altogether, these capital-intensive sectors with high value-added output and smaller labor footprints accounted for more than one-fifth of Texas GDP in recent years, significantly less than the nearly one-third in the early 1980s but still much higher than the nation. Three-fifths of the value of Texas exports is energy related. Texas is the largest exporting state in the nation, the result of what the state produces as well as its ever-expanding bilateral relationship with the nation’s largest trading partner, Mexico.
By rolling state GDP components into the same type of similarity index as payrolls, Texas’ outsized energy-related GDP shares show a sharper distinction from the nation and other large states.[3] Annual real (inflation-adjusted) mining GDP declined continuously from 1978 through 2004 until the shale-oil boom helped differentiate Texas output from the nation once more (Chart 2).
Two large metropolitan areas underpin Texas’ evolution
The so-called Texas Triangle is the area bounded by Dallas–Fort Worth to the north, Houston and San Antonio in the south, with Austin sitting centrally on Interstate 35 between San Antonio and Dallas. The triangle is where much of the state’s structural economic change occurred.
The region is home to nearly three-quarters of all Texas jobs and 72 percent of output. It has experienced some of the nation’s highest population growth (2.2 percent annually) over the past 40 years and employment growth (2.6 percent annually) during the period.
Year-to-year individual metro growth rates have been volatile, especially in Houston. As the Energy Capital of the World, Houston has bounced with the highs and lows of temperamental oil and gas markets. Between 1982 and 1987, more than one in seven jobs disappeared locally when oil prices collapsed, tumbling by nearly two-thirds in inflation-adjusted terms. The state’s subsequent savings and loan crisis and accompanying bank insolvencies, affecting hundreds of Texas banks, compounded the economic woes.
During this period, the oil and gas extraction share of jobs in Houston dropped from 6.9 percent to 3.9 percent. Heavy construction fell from 4.7 percent to 3.9, as the commercial real estate market reeled statewide. The Houston metro population stagnated, declining slightly from 1986 to 1988. Inflation-adjusted oil prices didn’t recover for nearly a decade.
By the start of the 1990s, Houston firms collectively looked past oil- and gas-related production, manufacturing and services to a broader mix of industries and services including education, non-energy manufacturing, professional, scientific and technical services and health care.
But energy was destined to make a comeback. As hydraulic fracturing technology enabled the shale oil boom in the 2010s, energy reasserted its prominence, again drawing industry executives to Houston. Because the metro economy had widened and diversified its base, the region subsequently weathered the massive 2015–16 shale bust—by many measures a downturn as severe as the one three decades earlier—with only a brief and mild contraction.
San Antonio’s evolution was similarly pronounced. The metro has an outsized military influence with Army, Air Force and National Guard presence and related medical facilities. The latter has contributed to health services’ outsized share of local payrolls.
The military’s relative presence declined in the 1980s and 90s with the end of the Cold War, while tourism, notably hotels and food and drinking places, grew, diversifying San Antonio and making it more like the rest of the U.S.
Business administrative services and health services grew rapidly in the 2000s and into the 2010s. Proximity to the Eagle Ford shale formation provided a boost during the shale boom, albeit to a much lesser extent than in Houston. However, the tourism-related expansion abruptly stopped with the pandemic.
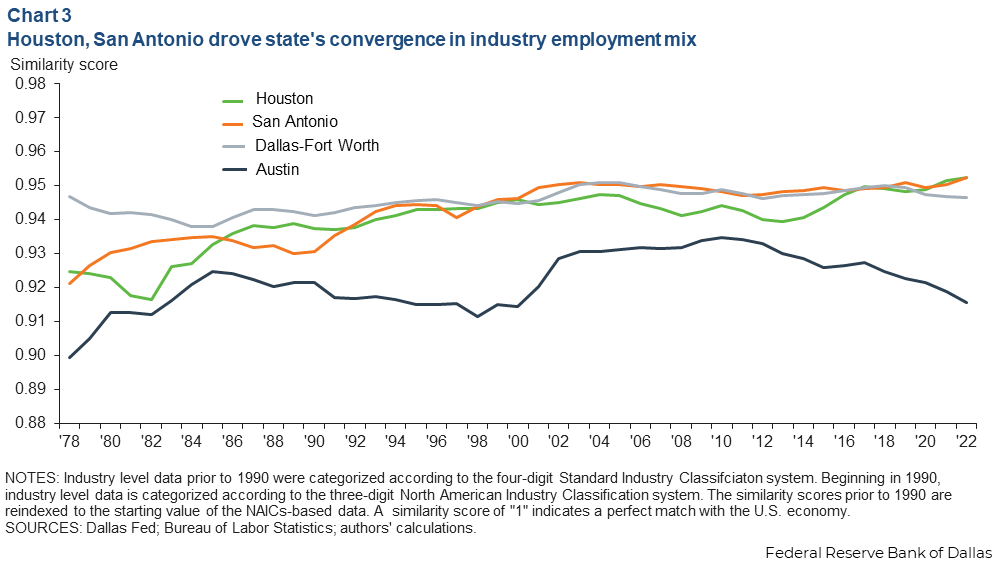
Today, San Antonio vies with Houston for the Texas metro with an industry payroll mix most like the U.S. (Chart 3).
Tech set Austin on a different path
Texans are prone to say of their capital city, “Austin is different.” Its recent economic path reinforces this assessment.
Home to the University of Texas, Austin struck a different path through the 1980s. The rise of personal computing and a boom among technology industries gave birth to Austin’s so-called Silicon Hills.
Firms such as Dell Computer and Advanced Micro Devices invested heavily in the then-affordable metro. They drew talent from the university and built on the presence of giants such as Dallas-based Texas Instruments. Semiconductor manufacturing, research and computer-related manufacturing sectors would flourish through the 1990s.
Austin’s similarity index shifted abruptly closer to the nation with the bursting of the dot-com bubble and subsequent 2001 U.S. recession. Computer manufacturing and related jobs declined sharply. Over the next 19 years, food services and retailers, and professional, scientific and technical services grew their share of payroll jobs at a faster pace than the nation, particularly after the Global Financial Crisis and accompanying U.S. recession (2007–09).
Meanwhile, along I-35, about 200 miles to the northeast, Dallas–Fort Worth’s industry mix has historically resembled the U.S. economy more than other Texas regions. DFW is the most-populous Texas metro, a transportation hub by rail and air, home to large professional services firms, and a manufacturer for aerospace, technology, transportation and defense industries. However, computer and electronic product manufacturing have an outsized share of the region’s payrolls relative to the U.S., suppressing the similarity index.
While high-tech manufacturing’s prominence as a share of DFW employment has declined over the past 30 years, the drop hasn’t been enough to substantially move the region’s similarity index number. There have been offsetting increases in the relative shares of professional services, including corporate management, scientific and technical services as well as relative increases in the local share of financial services.
Pandemic reshuffled industry mixes
The pandemic hit services harder than goods producers nationwide. Cities and states had significantly different private and public policy COVID-19 responses from 2020 to 2022. The many dramatic and simultaneous changes that occurred make interpreting the pandemic-era indexes challenging.
The pandemic especially slowed leisure and hospitality industries along with the energy sector, at least initially. The rise of remote work changed where individuals prefer to live and, thus, the locations where they consume services. The most recent employment similarity indexes reflect changes that may not persist. New York state’s jobs index shifted away from the U.S. in 2020, while California’s hardly moved. The Texas employment index indicated greater similarity to the nation.
In the wake of the pandemic, major federal legislation such as the Inflation Reduction Act and the CHIPS and Science Act are accelerating investment in high-tech manufacturing, such as for computer chips, battery manufacturing and electric vehicles, especially in Texas.
Already the No. 1 state in the nation for renewable energy production, Texas is bolstering its unique position as a leader in the oil and gas sector and the energy transition. Investment in solar manufacturing is rising, as is investment in the battery supply chain. For example, Tesla’s lithium refinery in Corpus Christi will help support vehicle production in Austin at the company’s Gigafactory.
The state is also likely to be a prime beneficiary of carbon capture and sequestration investments along with hydrogen hubs. At the same time, the state is growing its prominence as one of the world’s largest producers and exporters of crude oil, natural gas, refined petroleum products and petrochemicals.
Outlook for distinct growth, migration to fill jobs
Potential increases in investment in capital-intensive production of high technology, renewable energy, batteries and hydrocarbons will likely make the state’s output mix more dissimilar to the U.S. in the next decade. However, a rising output share from computers and renewable energy will help keep the state’s economy well diversified relative to its oil, cotton and cattle heritage.
Simultaneously, the payroll mix—the measure by which Texas has become more like the U.S.—should be little affected in the long run. Capital expenditures in these areas will produce a surge of temporary construction and related jobs. Professional and ancillary services to support this activity will likely follow.
Texas has benefitted from outsized population growth for decades, including during the pandemic, helping the state maintain its job-growth premium over the U.S. However, without in-migration, critical gaps in the labor force could emerge, challenging the state’s capacity to grow its employment resemblance to the nation.
Notes
- The index is calculated as one minus the square root of the sum of squared differences between an industry’s local share of payroll employment and the industry’s national share of payrolls, similar in construction to the Makowski distance between two vectors. This has the advantage of minimizing the contribution of small differences in shares to the total. The narrower the differences, or the shorter the distance between the vectors, the closer the index gets to a value of one, which would be identical to the national job mix. Conceptually, the index is an aggregate way of looking at location quotients, industry-specific ratios of local job shares to national job shares. Data are from the Quarterly Census of Employment and Wages. For 1978–89, the similarity indexes were constructed using four-digit Standard Industrial Classification (SIC) codes. After 1989, industry classification switched to the North American Industry Classification System (NAICs). Three-digit NAICs industry details were used to construct the index after 1989.
- The real GDP from oil and gas extraction measure from the Bureau of Economic Analysis is adjusted using changes in the annual energy equivalent production of crude oil and marketed natural gas. For an explanation of the motivation and methodology, see Potential mismeasurement of mining limits official Texas real GDP data - Dallasfed.org. Applied to New York and California, the adjustment made no discernable difference to the output similarity indexes, but it significantly affected Texas.
- In 1997, the state GDP data switched from the SIC classification system to the NAICS system. This change was much more pronounced for output than payrolls, particularly in Texas.
About the authors

Jesse Thompson is a senior business economist in the Houston Branch of the Federal Reserve Bank of Dallas.

Keighton Hines is a statistics programmer and analyst in the Statistics Department at the Federal Reserve Bank of Dallas.
The views expressed are those of the authors and should not be attributed to the Federal Reserve Bank of Dallas or the Federal Reserve System.


