
Potential mismeasurement of mining limits official Texas real GDP data
Timely measures of economic activity are scarce at the state and local level. Many analysts rely heavily on Bureau of Labor Statistics regional data on job growth and unemployment to gauge economic conditions. In recent years, the Bureau of Economic Analysis (BEA) has improved the timeliness and periodicity of state output data, offering analysts a broader measure of economic activity than just labor utilization.
However, data for Texas appear distorted by a potential mismeasurement of real (inflation-adjusted) output in the mining sector. Oil and gas production represents about 9 percent of state gross domestic product (GDP). Because the industry is so volatile, in any given year it can account for a much larger share of the state’s growth or decline. We find that traditional inflation-adjusted metrics can lead to inaccurate measurement of activity, particularly during periods of large oil price swings. The distortions to overall GDP are significant enough that they can convey a misleading sense of the state economy’s performance.
We show how a new measure tied to oil and gas production provides a result that is more consistent with other assessments of real output in this industry.Outsized importance of oil and gas
In the past, comprehensively measuring output growth at the state level was a challenge. BEA data were only available at an annual frequency and with a three- or four-quarter lag from the reference year. Beginning in 2014, the BEA began producing quarterly state-level GDP statistics with a much faster turnaround time—three to four months from the reference quarter.
When measuring GDP, economists commonly adjust for price movements in order to calculate the change in units produced. This is done at an industry level and aggregated up to measure total real GDP. Texas real GDP growth has averaged 3.6 percent annually since 1990, compared with 5.7 percent when not adjusting for inflation.
In the case of the Texas oil and gas industry, this price-adjusted measure of output can break down due to industry-specific price idiosyncrasies. Real GDP calculations attempt to assign an inflation-adjusted dollar value to oil and gas output, so a nominal decline entirely driven by prices should result in no change in the real measure.
Measuring energy price trends
However, in the BEA’s measure of Texas oil and gas output, sharp nominal output declines are generally accompanied by sharp real output increases. This is because of the deflation method used to adjust the value of energy output.
The BEA price deflator for the Texas mining sector is highly correlated to the British thermal unit (BTU)-weighted combined spot prices for oil and gas produced in Texas. In reality, most energy companies sell oil and gas on longer-term contracts or use options contracts to mitigate price risk, so that the price they receive does not change quickly, as spot prices do.
This can distort the measure of real GDP. For example, suppose spot prices decline by 50 percent but the price that oil companies receive only declines 5 percent (because most oil is sold at contracted prices or hedged with options). If production doesn’t change, the measure of real oil output would increase by 90 percent. If prices stay low, then in later months when contracts are renegotiated, the measure of real GDP will fall even if production remains stable.
The relationship between oil prices and real GDP in the energy sector is consistent with the previous example. During periods of significant oil price declines, including the Great Recession in 2007–09 and the shale oil bust in 2015–16, real GDP in mining (which in Texas is almost entirely composed of oil and gas output) increased sharply and fell in later months (Chart 1).
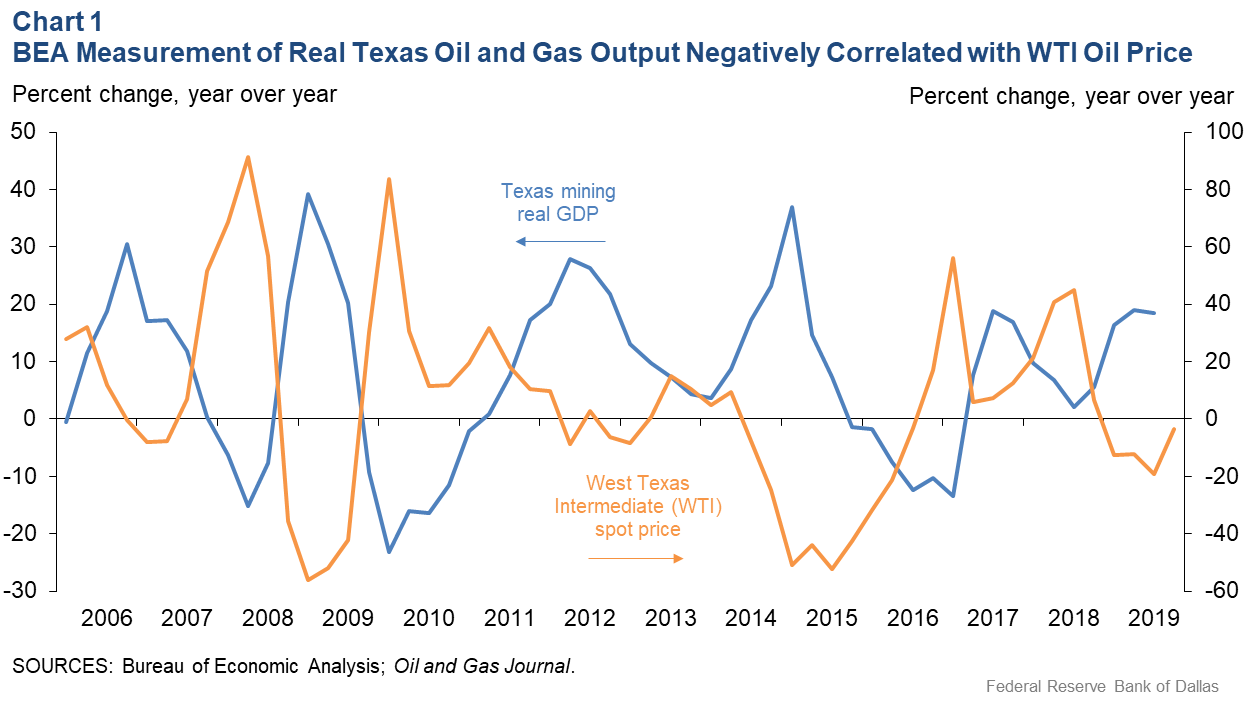
While changes in production measures lag price swings, such a sharp acceleration in mining GDP—by 39 percent in first quarter 2009 and 37 percent in first quarter 2015—would appear to be inconsistent with an accurate measure of output because every other measure of energy activity had peaked one to three quarters earlier.
This over- or under-estimation of growth can significantly affect top-line GDP estimates. For instance, oil prices dropped 21 percent from third quarter 2018 to first quarter 2019, followed by a drop in the rig count and mining employment and moderating oil and gas production in the first half of 2019. Despite this, first-half 2019 Texas real GDP in mining accelerated by a 27 percent annualized rate, boosting headline real GDP by more than 3 percentage points.Refining measurements of output
What can be done to calculate a more robust measure of energy output? Because data on contracted oil prices are unavailable, more-concrete measures—such as the physical production of oil and gas—can be used to filter out price effects. Converting production of oil and natural gas into a common unit of measure—BTUs—provides an aggregate output measure that can be checked against other indicators of energy activity.
This proxy for mining GDP has moved in concert with other key energy indicators since 2006 (Chart 2). The 2007–09 recession and the 2015–16 shale bust illustrate the pattern of decline-and-recovery expected with sharp, persistent swings in energy prices.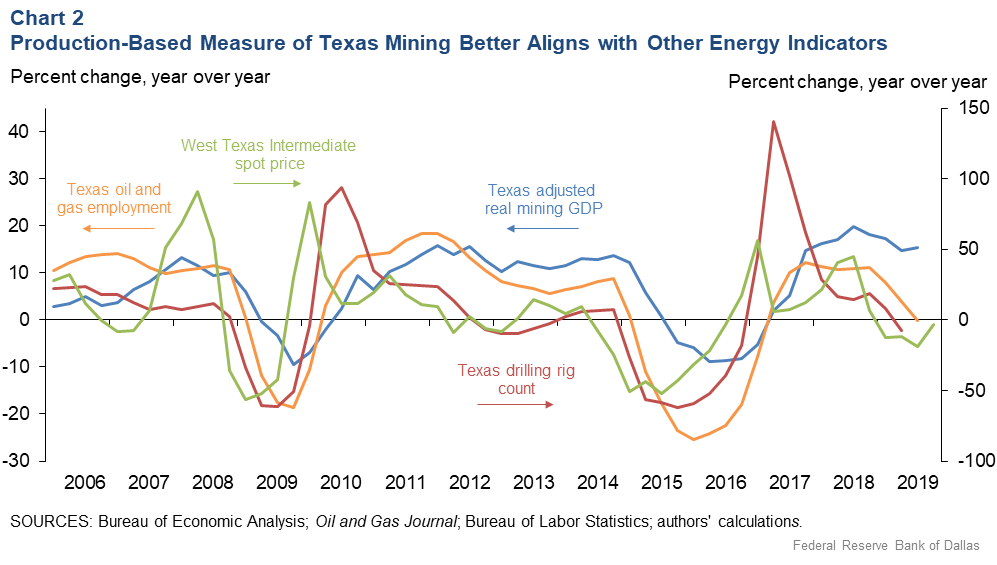
Because energy production is capital intensive, activity changes significantly lag price swings. New drilling activity—measured by the drilling rig count—declines first. Oil and gas employment falls next, as layoffs signal expectations of more-persistent weakening within energy. Finally, production declines reflect the drop-off in existing-well productivity coupled with less new-well drilling. When prices recover, a similar sequence occurs in reverse—rebounding rig counts, employment and, ultimately, production.
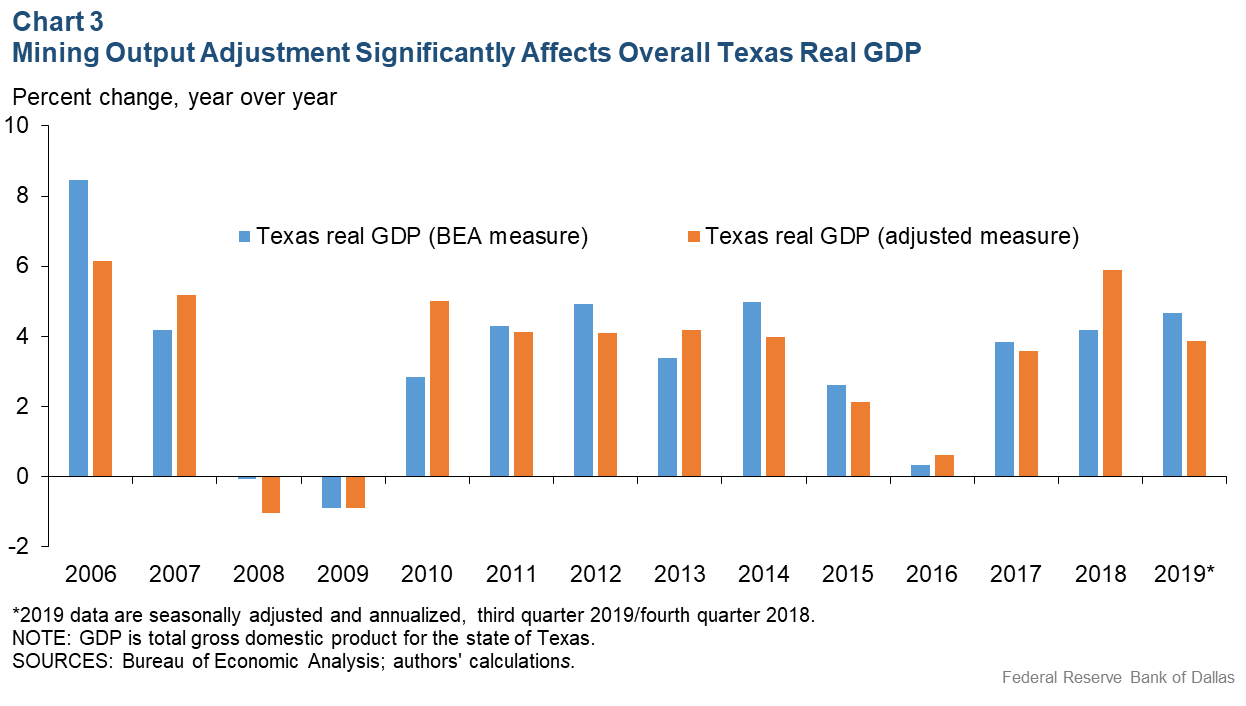
An overall estimate of state output that is more reflective of actual oil and gas activity results when such a measure is incorporated into Texas headline real GDP.
Using this approach, real GDP in Texas grew a more moderate 3.9 percent from fourth quarter 2018 through third quarter 2019, compared with the official BEA estimate of 4.7 percent (Chart 3). The alternative calculation is more consistent with other measures of activity such as job growth, which also slowed over the period.
About the Authors

Keith Phillips
Phillips is an assistant vice president and senior economist in the San Antonio Branch of the Federal Reserve Bank of Dallas.

Christopher Slijk
Slijk is an associate economist in the Research Department at the Federal Reserve Bank of Dallas.
The views expressed are those of the authors and should not be attributed to the Federal Reserve Bank of Dallas or the Federal Reserve System.