Solar
Over the last ten years, solar power has picked up steam in Texas and Southern New Mexico, bringing new green jobs to the region. Using the tabs below, learn more about the growth in solar production across the region and its effects on employment.
| Highlights |
|---|
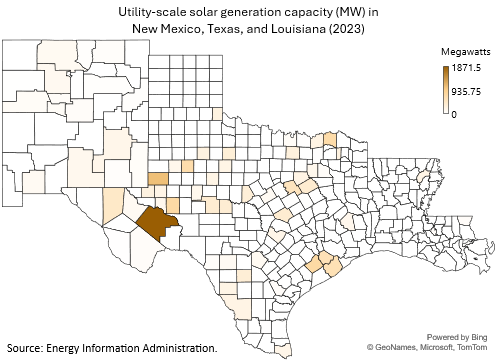
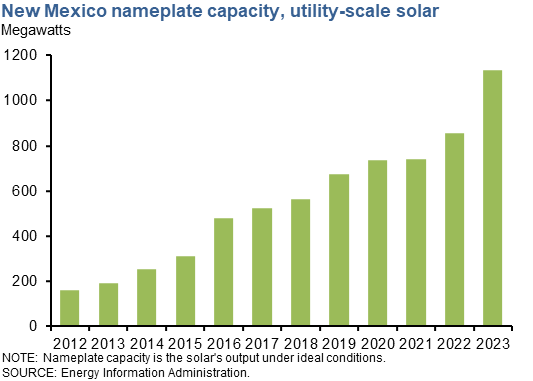
Texas is one of the leading states for solar energy in the country. As of 2022, the state had more than 11 gigawatts (GW) of utility-scale solar capacity, behind only California. Abundant sunshine and close proximity to major demand centers of electricity make the state an attractive proposition for solar generation. This is particularly true in recent years as costs have plummeted, boosting the economics of solar power in general. There is solar capacity in various parts of the state, but it is most prevalent in West Texas, in particular Pecos, Andrews and Uptown counties. Those three counties had 28.4 percent of the state's capacity. Pecos county is by far home to the largest amount of solar power, having capacity of 1560 megawatts. New Mexico is also home to solar capacity, with 857.9 megawatts. Over half of that capacity, 53 percent, is contained within the Eleventh District. Within our district, Chaves, Luna and Doña Ana are the top producing counties with a combined 292.6 megawatts. |
Generation of solar power is primarily done through two main options, which are solar thermal power plants and photovoltaic systems.
Solar thermal power plants use mirrors to concentrate sunlight into a receiver, generally a tower. Steam is produced from the heat, which is used to power a turbine to produce electricity. In Texas, there are no utility-scale solar thermal power plants but there are a limited number of plants in Arizona, California, Nevada and Utah.
Photovoltaic (PV) power, the converting of sunlight into electricity, became possible with the discovery of the silicon cell in 1954 by Bell Labs. However, utility-scale PV systems were uneconomical due to high costs for most of the 20th century and into the early 21st century.[1]
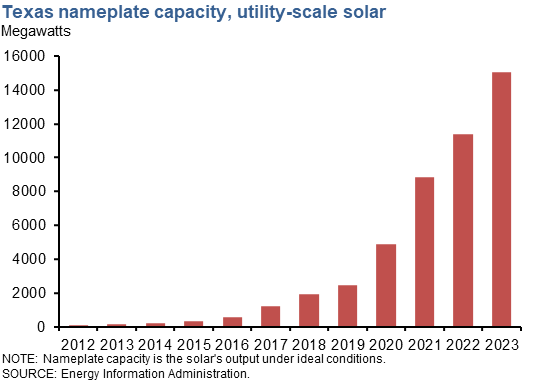
Over the past decade, though, the cost of solar panels has declined dramatically and this has led to a substantial increase in solar capacity in the state, particularly in recent years. From 2010-19, Texas added 2,406 megawatts (MW) of capacity and this was followed by an additional 8,967 MW of capacity from 2020-22.
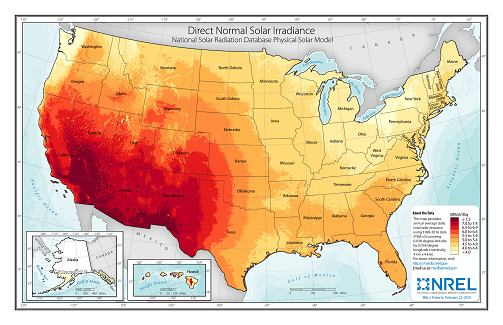
Much of this capacity is for larger, utility-scale solar projects. The abundant open land in West Texas made it perfect for solar farms. Facilities between 5 and 50 MW started to become operational in 2010. The first project was Blue Wing Solar Energy Generation, located in Bexar County, which become operational in November 2010 with a nameplate capacity of 13.9 MW. Most of the 100+ MW solar parks were built in West Texas where there is a higher solar irradiance, but they serve the more populated central and eastern regions of the state.
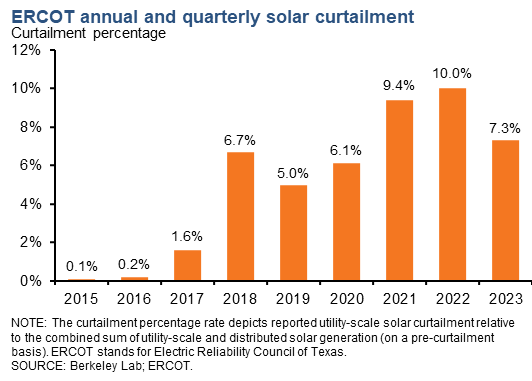
Recently, more facilities are being built closer to populated areas to reduce the risk around power transmission congestion (when transmission lines are unable to carry additional electricity flow due to the risk of overheating) which can adversely affect the prices received by solar farms, and to also lower the risk of curtailment, which is when the producer is not allowed to sell power even if it is being produced.
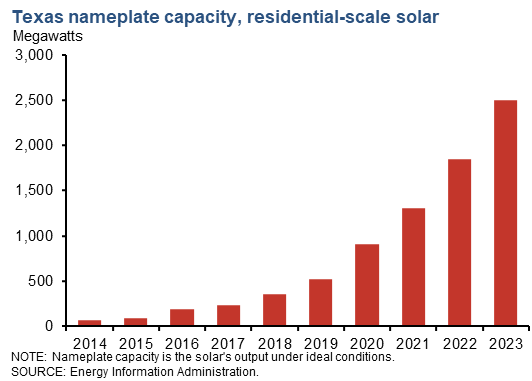
Photovoltaic systems can also be added to homes. However, these systems have a higher cost on a watt basis when compared to utility-scale systems as they lack economies of scale and have significantly higher labor and marketing costs. Some utilities in Texas using a bill system called net metering to provide credits to customers when excess power is sold to the grid, but these programs in general aren’t as attractive as some of those offered in other states. As a result of these factors, the increase in residential solar power in the region has been smaller than in utility-scale power and smaller than that seen in some other states.
Notes
- For more information on solar power plants, see Solar Explained, U.S. Energy Information Administration, April 15, 2022.
| Highlights |
|---|
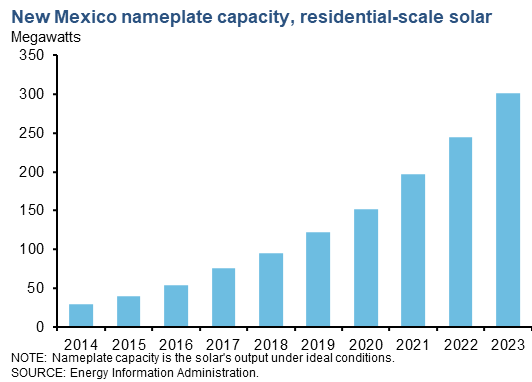
Solar capacity in the Eleventh District began growing rapidly in the late 2010s. The area is home to both utility-scale capacity and residential capacity, although most of the solar capacity is with large utility-scale projects. Utility-scale nameplate capacity - a measure of the potential output under ideal conditions (77 degrees Fahrenheit, when photovoltaic cells absorb sunlight with maximum efficiency) - rose from a meager 76 MW in 2012 to 11,373 MW in 2022, with most of the increase occurring in recent years. The region's share of U.S. utility-scale solar has also grown. In 2012, the district's capacity share was 5.9 percent of U.S. utility solar power capacity, but in 2022, it accounted for 16.2 percent of the nation's nameplate capacity.[1] Residential solar capacity has also increased dramatically in the state over the past decade. There was almost no capacity in 2012 compared to 1,851 MW of capacity in 2022. Texas' share of U.S. residential solar is only 7.0 percent as residential solar capacity has risen more dramatically in other states, especially California. That state alone has 37 percent of U.S. residential solar capacity.[2] New Mexico also has some solar capacity. In 2022, New Mexico had 858 megawatts of utility-scale nameplate capacity, and 245 megawatts of residential scale nameplate capacity. There is very little solar capacity in Louisiana. Utility-scale capacity was 125 megawatts and residential capacity was 149 megawatts in 2022. However, none of Louisiana's utility-scale capacity is within the Eleventh District. Solar is an intermittent source of power; it only generates electricity when the sun is shining. If more solar power is available than the grid can use, grid operators have to curtail solar production to keep the grid balanced. Curtailment has gone from 0.1 percent of solar generation in 2015 to 10.2 percent in 2022 in ERCOT. |
| Utility-scale Capacity 2022 |
||
|---|---|---|
| Megawatts |
Year/year change (percent) |
|
| Texas | 11,373 | 27.3 |
| New Mexico | 452 | 15.8 |
| Louisiana | 125 | 67.1 |
| U.S. | 73,196 | 18.3 |
| SOURCE: Energy Information Administration. | ||
| Residential-scale Capacity 2022 |
||
|---|---|---|
| Megawatts |
Year/year change (percent) |
|
| Texas | 1,851 | 41.2 |
| New Mexico | 245 | 24.1 |
| Louisiana | 175 | 2.9 |
| U.S. | 26,294 | 24.5 |
| SOURCE: Energy Information Administration. | ||
Notes
- Utility-scale generation capacity comes from the Energy Information Administration's 860 Report.
- Residential-scale capacity comes from the Energy Information Administration's 861 Report.
| Highlights |
|---|
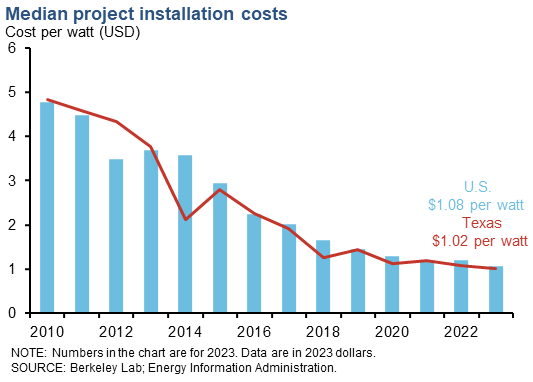
The cost per watt to install a solar project in Texas has declined 58.0 percent from 2017 to 2022. For 2022, the median project installation cost in Texas was 0.36 cents or 33.6 percent lower than the national average. These trends are similar to what has happened nationwide, where installation costs have also declined.[1] Government incentives have long been a part of the solar industry in the United States. The Energy Tax Act of 1978 established an investment tax credit for both residential and commercial solar at 10 percent.[2] The Energy Policy Act of 2005 increased the tax credit to 30 percent. While the tax credit was set to be phased down, it was extended through a series of bills. The recent 2022 Inflation Reduction Act set the solar tax credit at 30 percent through 2032. Texas doesn't have a statewide solar rebate program but does offer a property tax exemption for residential and commercial renewable energy systems. |
| Project Costs 2022 |
||
|---|---|---|
| Cost per watt (dollars) |
Year/year change (percent) |
|
| Texas | $0.71 | –33.6 |
| U.S. | $1.07 | –7.8 |
| SOURCE: Energy Information Administration; Berkeley Lab. | ||
Notes
- Cost data come from the Berkeley Lab Electricity Markets and Policy Report.
- Information about energy tax credits Congressional Research Service .
| Highlights |
|---|
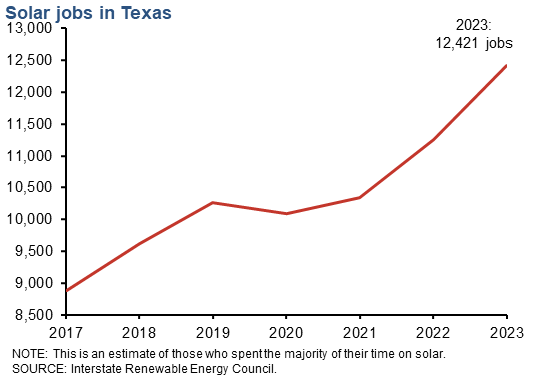
Solar employment in Texas has grown 26.8 percent since 2017. That figure is especially impressive when compared to the national average which saw solar jobs grow at a meager 3.4 percent over the same time frame. In 2022 Texas came in fourth for the largest number of solar jobs behind California, Florida and New York. The number of solar jobs in Texas now stands at 11,250. |
| Employment 2022 |
||
|---|---|---|
| Employment |
Year/year change (percent) |
|
| Texas | 11,250 | 8.7 |
| U.S. | 263,883 | 3.5 |
| SOURCE: Interstate Renewable Energy Council. | ||
- General background solar information
- Record-breaking Texas summer heat tests the grid
- Energy transition means more than just additional electric vehicles
- Residential solar power shines on, backed by securitized lending
- Renewable energy projects present unique lender risks
- Solar lights up outlook for renewable energy in Texas
- Surging renewable energy in Texas prompts electricity generation adequacy questions
- Wind and Solar Power:
Perfect When Paired in Texas
- Abundant Sunshine Not Enough to Power
Texas Residential Solar Energy