Impact of Hurricane Harvey and a Discussion of Key Structural Drivers Affecting U.S. Monetary Policy
October 17, 2017
At the September 2017 meeting, the Federal Open Market Committee (FOMC) announced plans to begin the process of gradually reducing the size of the Federal Reserve balance sheet. I strongly support the decision to begin the process of reducing the balance sheet. I believe that the gradual and phased-in design of this plan should allow the Fed to reduce the Treasury and mortgage-backed securities portfolios without materially impacting either of these important markets. In the September meeting, the committee also decided to leave the target federal funds rate in a range of 100 to 125 basis points but left open the possibility of gradual removals of accommodation (i.e., raises in the federal funds rate) in the future.
The purpose of this essay is to provide a synopsis of my current views regarding the economic impact of Hurricane Harvey as well as economic conditions in the Eleventh District, U.S. and globally. I will also discuss key structural drivers, such as aging demographics, high levels of government debt to gross domestic product (GDP), globalization, and technology-enabled disruption and their implications for U.S. monetary policy.
The Dallas Fed is one of the 12 regional Federal Reserve Banks in the United States. The Eleventh District is composed of Texas, northern Louisiana and southern New Mexico. Texas accounts for 8.8 percent of U.S. GDP [1] and 8.4 percent of U.S. nonfarm employment.[2] It is the largest exporting state in the U.S. and is home to more than 50 Fortune 500 companies.[3] The characteristics of our district give the Dallas Fed unique insights into energy, trade and immigration issues, as well as great insight into the regional, national and global economies.
With that background, let me begin with a discussion of Hurricane Harvey and its impact on the Eleventh District as well as the U.S.
Impact of Hurricane Harvey
The Eleventh District is working to recover from the effects of Hurricane Harvey. It is our base-case assumption that property damage from the storm is likely to be in the range of approximately $75–$100 billion. Most of this damage was due to flooding versus wind and other forms of hurricane damage. Of that amount, we estimate that approximately $45–$55 billion was due to damage to residential property. In addition, approximately $16–$20 billion was due to commercial property damage, approximately $10–$12 billion was due to vehicle damage and another $6–$10 billion was due to infrastructure damage.[4] Unfortunately, some substantial percentage of these losses will ultimately prove to be uninsured.
Before the storm, the Dallas Fed estimated that multifamily rental housing in Houston had a relatively high vacancy rate. Since the storm, because many displaced homeowners have elected to rent (if only temporarily), occupancy rates have risen substantially and the multifamily overhang appears to have been eliminated. Further, our contacts suggest that multifamily developer/operators in Houston may accelerate their plans to build additional rental housing capacity.
We expect some short-term job loss in the Gulf Coast region of Texas in the range of 55,000 to 75,000 jobs. However, we believe that these losses will prove to be temporary.
The storm has also spurred substantial discussion of undocumented workers, in Houston specifically and in Texas generally. It is estimated that approximately 575,000 undocumented people live in the Greater Houston area.[5] Our contacts estimate that a substantial percentage of construction workers in Houston are likely undocumented. In studying the aftermath of other severe-weather events, we note that undocumented workers have historically been critical participants in the rebuilding and recovery effort.
There is significant concern about the potential failure rate of small businesses in Houston due to an extended period of business interruption and a significant amount of uninsured losses. In our Dallas Fed September surveys, 58 percent of respondents who suffered Hurricane Harvey damage reported physical capital losses that were uninsured, and 74 percent of hurricane-impacted respondents reported lost revenue and/or production that was uninsured.[6] We are mindful that banks will need to work with borrowers and make tough judgments regarding future business viability in order to help the small business community weather this crisis.
Of course, the Gulf Coast is home to a substantial concentration of refinery capacity and offshore production facilities. The refinery outages resulting from Harvey-related shutdowns temporarily impacted oil inventories and gasoline prices. Our estimate is that the refinery industry came substantially back online by late September. Offshore production has more recently been impacted by Hurricane Nate, which caused substantially all Gulf of Mexico oil production facilities as well as two refineries to temporarily halt operations. While the full impact of the most recent storm has yet to be determined, Dallas Fed economists believe it will likely have only modest and temporary effects on refinery and production operations.
The recent hurricanes have not changed our basic outlook regarding global supply and demand for oil. We continue to believe that we are in a fragile equilibrium over the next few years. While there is certainly a risk that oil prices could break to the downside, the Dallas Fed’s baseline view is that there will be continued price volatility but within a band between the mid-$40s to the mid-$50s for the remainder of 2017 and 2018. Prices moving to the lower end of that range will tend to reduce prospective drilling activity, and prices moving to the higher end of that range will tend to encourage greater drilling activity.
Our energy industry contacts continue to indicate that the bulk of their capital spending plans are focused on shale oil production and involve investment in technologies that will create greater production efficiencies. Our recent Dallas Fed Energy Surveys suggest that the rate of growth in capital spending on shale oil production has slowed materially relative to earlier in the year. Survey participants also continue to report that, in a number of locations, current market prices are above break-even drilling levels, particularly in the Permian Basin.
Overall, we estimate that Hurricane Harvey reduced economic activity in the Eleventh District during the third quarter of 2017. We expect that the fourth quarter will show a rebound in economic activity that should more than offset the decline in the third quarter. Dallas Fed economists expect Texas job growth of approximately 2.6 percent in 2017, the strongest rate in three years. Our business outlook surveys suggest continued strong growth in the state’s manufacturing sector as well as continued strength in services.
Our study of the aftermath of previous severe storms gives us confidence that, after a period of weakness, Texas economic activity will “catch up” and return to previous rates of trend growth. Our confidence in this recovery is bolstered by the continued migration (as well as immigration) of people and firms to the state. Aided by this trend, the Texas economy has, over time, become increasingly diversified. The population of Texas is estimated to have grown from approximately 22.8 million in 2005 to almost 28 million in 2016.[7] Based on these trends, and as the energy sector continues to stabilize and recover, Dallas Fed economists are optimistic about the growth prospects for Texas and the Eleventh District in the months and years ahead.
The U.S.
GDP in the U.S. is estimated to have grown at a 1.2 percent rate in the first quarter of 2017 and a 3.1 percent rate in the second quarter. First-quarter GDP was negatively impacted by weak consumer spending and a deceleration of net inventory investment. The strong second quarter was primarily due to a rebound in consumer spending and a stabilization of inventory investment.
Our Dallas Fed economists recently increased their forecast of U.S. GDP growth to approximately 2.4 percent in 2017. Embedded in this forecast is a likely drag on third-quarter GDP growth due to recent hurricanes. However, we expect a rebound in economic activity in the fourth quarter which should substantially offset hurricane-related impacts from the third quarter. The key underpinning of our forecast is our expectation of a healthy U.S. consumer. The U.S. consumer has spent the past nine years deleveraging from record levels of debt to GDP and is today in relatively good financial shape and, as a result, has capacity to spend.
In addition to a healthy consumer, we also expect GDP growth in 2017 will continue to be bolstered by some improvement in nonresidential fixed investment and international trade. We expect that this rate of GDP growth, while sluggish by historical standards, should be sufficient to remove any remaining slack from the labor market.
Potential changes in fiscal policy and structural reforms could provide upside to this forecast. However, it is also the case that U.S. policy regarding trade and immigration bears watching and could have some negative impact on future rates of growth.
Unemployment and the Impact of Demographic Trends
The September jobs report showed a decrease of 33,000 in payroll employment. Our Dallas Fed economists believe that the September report was significantly negatively impacted by recent hurricanes, and it will likely take some time to separate “signal” from “noise” in this report.
Even with the weak September data, the year-to-date average monthly pace of job gains in 2017 has been approximately 148,000. This compares to an average of approximately 171,000 through August 2017 and 187,000 in 2016. As we move toward full employment, I would continue to expect the average rate of job growth to slow, consistent with a declining level of labor slack in the economy.
In addition to the most recent headline unemployment rate of 4.2 percent, my economic team looks at several measures of labor market slack, including estimates of discouraged workers and people working part time for economic reasons (otherwise known as U-6 unemployment), as well as the labor force participation rate.
U-6 unemployment (see chart below) stands at 8.3 percent, which is the lowest rate since June 2007. Looking at this historical data suggests to me that we have moved very close to full employment in the U.S.
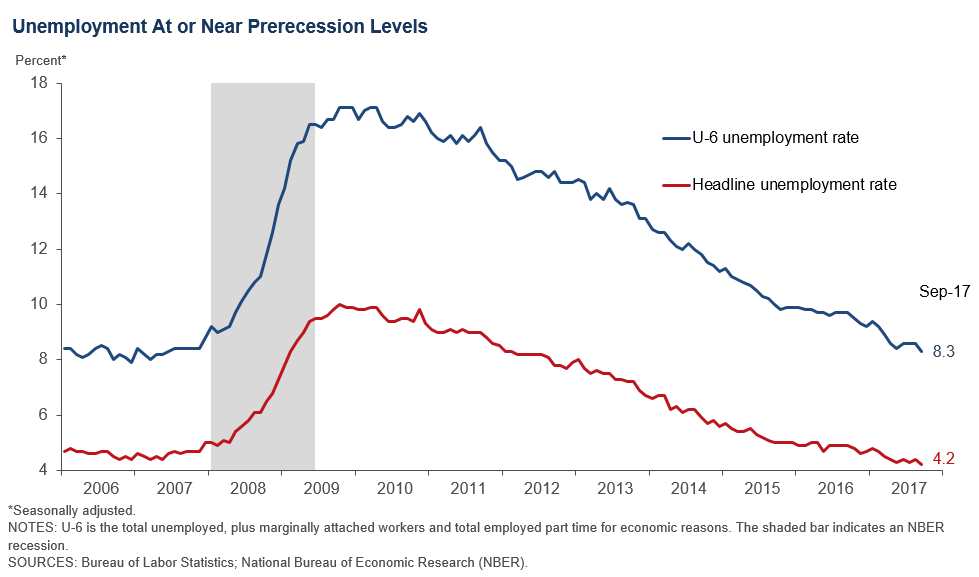
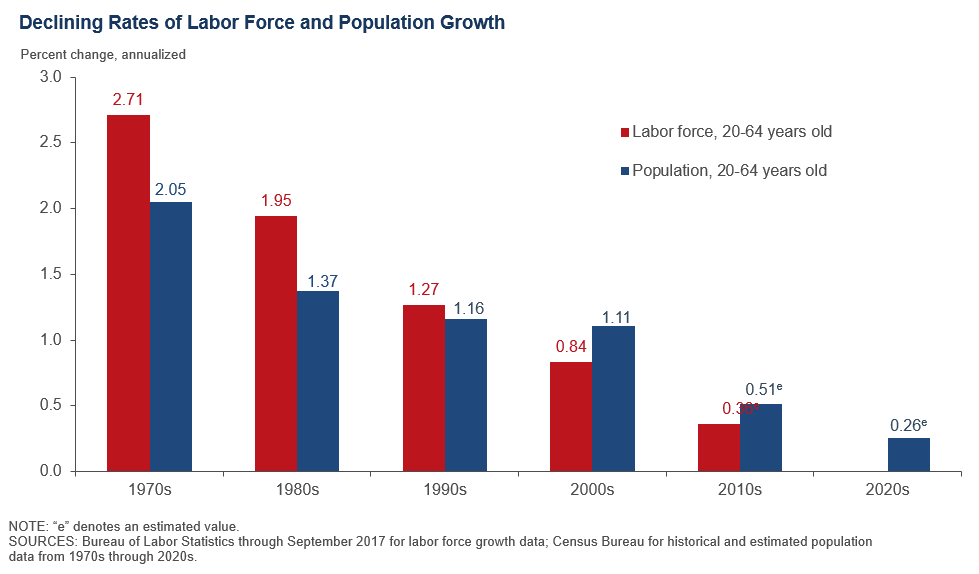
In addition to U-6, we also closely look at the labor force participation rate, which now stands at 63.1 percent. This compares with a participation rate of 66 percent in 2007. Our economists believe that a majority of the decline in participation is due to the aging of the population. This aging trend is expected to continue in the U.S. as well as across almost all advanced economies. Over the next 10 years, we expect that, due to aging of the workforce, the U.S. participation rate will decline to below 61 percent.[8]
The likely net impact of this aging trend will be to reduce the rate of labor force growth in the United States. You can see from the chart below that, beginning in the 2000s, population growth among those 20 to 64 years old has outpaced overall labor force growth. This trend has been due to a steadily increasing percentage of the 55–64 population within the 20–64 age cohort as well as a plateauing of the rate at which women have been entering the workforce. Dallas Fed economists expect these trends to continue as we enter the next decade.
Because GDP growth is comprised of growth in the workforce plus gains in productivity, weaker expected workforce growth trends will likely negatively affect potential GDP growth in the years ahead—unless we take steps to mitigate these effects.
Educational Attainment and the Skills Gap in the U.S.
When we look at measures of discouraged workers and those who are working part time for economic reasons, I would note the high correlation between participation rates (as well as unemployment rates) and levels of educational attainment. The labor force participation rate for prime-age workers is approximately 88 percent for college graduates and 83 percent for those who have attended some college. However, prime-age worker participation is only 77 percent for those with a high school diploma and only 66 percent for those who have less than a high school diploma.[9]
While the labor participation rate is disappointing for those with lower levels of educational attainment, our Dallas Fed economists also note that there is a substantial skills gap in the U.S. That is, there are more job openings than workers for various types of middle-skills positions. The National Federation of Independent Business reports that as of September 2017, nearly half of small businesses indicated that they were unable to find qualified applicants to fill job openings. CEOs report difficulty in hiring workers for middle-class-wage jobs such as nurses, construction workers, truck drivers, oilfield workers, automotive technicians, industrial technicians, heavy equipment operators, computer network support specialists, web developers and insurance specialists. When these types of jobs go unfilled, U.S. businesses expand more slowly and the nation’s growth is impeded.
While a college education is highly correlated with better employment outcomes, it is also the case that the substantial skills gap highlights the need for the U.S. to do much more to beef up public/private partnerships that focus on middle-skills training. This training is critical to help workers, who may not have attended college, attain the capabilities needed to find attractive employment in the 21st century economy.
One other significant educational concern is the lagging levels of early-childhood literacy among fast-growing demographic groups in the U.S. Studies suggest that, if a child begins first grade with reading capability behind grade level, they typically fail to catch up during their educational career.[10] This has significant implications for their ultimate level of educational attainment. As a result of this trend, the Dallas Fed has consistently highlighted the need, nationally and locally, to invest in programs that improve early-childhood literacy and generally enhance the level of educational attainment among our younger population.
Education initiatives are an investment in our future. They are likely to help in the effort to reduce income inequality by creating broader workforce productivity gains and more inclusive prosperity.
Inflation
Progress toward reaching the Fed’s 2 percent inflation objective has been slow over the past several years. I believe this has likely been due to past strengthening of the dollar and weaker energy prices as well as a number of persistent secular forces, such as globalization and technology-enabled disruption (see “Broader Secular Trends” below).
Twelve-month measures of both headline and core inflation have weakened since February 2017. While I believe that this recent weakening may well be transitory, I will continue to be patient and open-minded in assessing upcoming data releases in this regard.
In order to analyze inflation trends, our economists look at headline inflation but also track several measures of core inflation. In particular, Dallas Fed economists closely monitor our Dallas Fed Trimmed Mean PCE inflation rate (see chart below). This measure trims out the most extreme upward and downward monthly price movements and, our economists believe, represents a more reliable indicator of trend inflation. After running at approximately 1.6 percent in 2015, Trimmed Mean PCE inflation gradually increased from 1.7 to 1.9 percent during 2016. Through August 2017, this measure has fallen back to 1.6 percent on a 12-month basis.
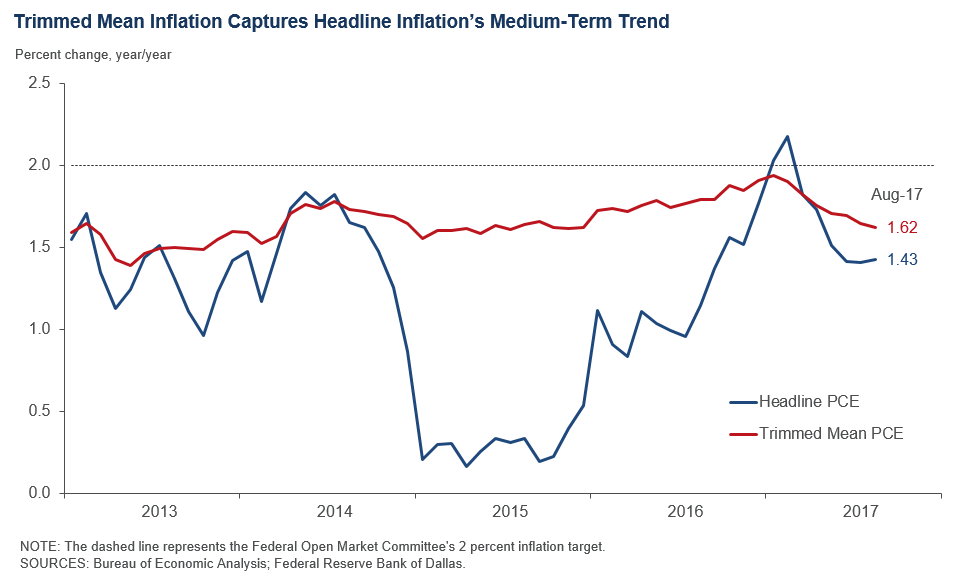
I am of the view that, despite recent weakness, as slack continues to be removed from the labor market, headline inflation should reach, or exceed, the Fed’s 2 percent objective over the medium term. However, I will be closely watching this measure in the months ahead in order to confirm that recent weakness is indeed transitory and that we are continuing to make progress in reaching our inflation objective.
Non-U.S.
In assessing economic conditions in the U.S., my research team closely monitors economic developments outside the U.S. to evaluate how these developments might impact economic growth domestically. Over the past year, we have seen a broad-based improvement in global economic activity. Brazil and Russia appear to be emerging from recession; Japan and the euro area are now growing more robustly.
The United Kingdom is still growing but at a much-reduced rate. The British government is working toward articulating a coherent vision for its post-Brexit arrangements with the European Union. Dallas Fed economists continue to believe that the impact of Brexit is likely to be manageable for the U.S.
Dallas Fed economists continue to carefully monitor emerging-market countries, particularly China. As discussed in previous essays, China is challenged by a high degree of overcapacity (particularly in state-owned enterprises) and high and growing levels of debt. The nation is also in the midst of a multiyear transition from being a manufacturing- and export-driven economy to one that is based on consumer spending and services. As this transition unfolds, the world is likely going to have to become accustomed to lower rates of Chinese growth. In the meantime, China is working to manage capital outflows and currency volatility. As we saw in the first quarter of 2016, this situation has the potential to create periods of financial market volatility and lead to bouts of tightening in global financial conditions, which could, in turn, slow economic growth in the U.S.
Broader Secular Trends
As I have discussed in almost all my recent essays and speeches, my economic research team carefully considers and works to understand cyclical forces in the economy as well as several key secular drivers. As I have emphasized over the past two years, these drivers are likely having a powerful influence on unfolding economic conditions.
I have particularly focused on four key secular drivers:
- Aging-workforce demographics in the U.S. and across major economies. As discussed earlier, aging-population trends, on balance, reduce labor force participation rates and ultimately create headwinds for potential GDP growth. These demographic trends are also likely to impact the “dependency ratio”[11]—that is, they are likely to exacerbate a situation in which an increasing share of the population is depending on those of working age to pay for future medical and retirement benefits. These trends are likely to create further strains on the ability of the U.S. government to manage its fiscal obligations (discussed further below).
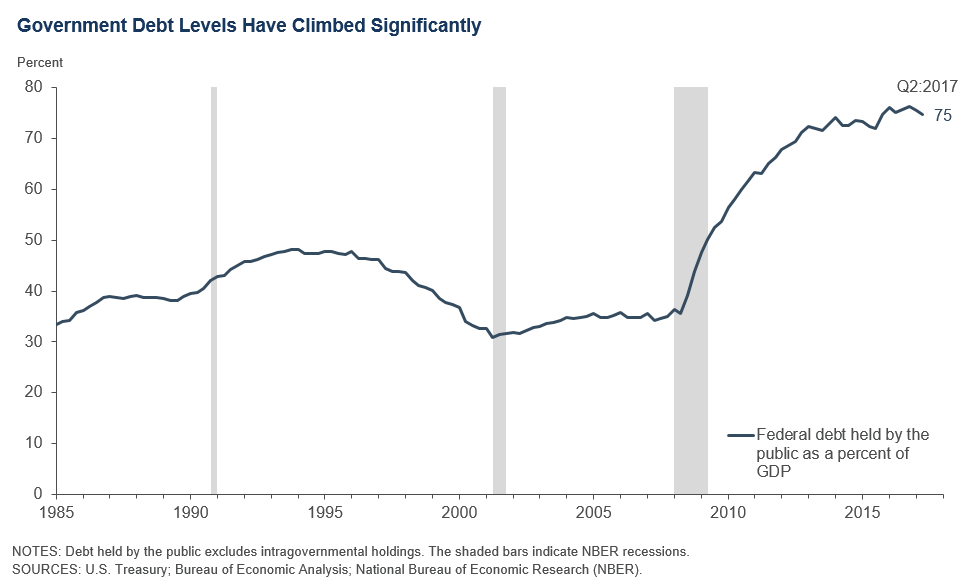
- Limits to the sustainability of the so-called global debt super cycle. Historically, the U.S. and other countries have used increasing public debt—often through tax cuts and higher government spending—to boost economic growth. In some countries, such as China, large quantities of private sector debt have also been used to fuel growth. At this point, there are likely limits to the ability of countries, including the U.S., to further increase debt to GDP in order to bolster economic growth. As I discussed earlier in this essay, we have seen a deleveraging of the U.S. household sector since 2008. As a result, the household sector is in much better shape today. However, while household balance sheets have improved since the Great Recession, government debt held by the public stands at the highest levels since the World War II era [12]—approximately 75 percent of GDP (see chart below)—and the present value of future unfunded entitlements is now estimated at $49 trillion.[13] These obligations will increasingly work their way into U.S. budget deficits over the next five to 10 years—raising questions regarding fiscal sustainability which, if not addressed, could negatively impact longer-run economic growth.
- Globalization. Economies, financial markets and companies are more closely intertwined than ever before. For example, regarding trade, estimates indicate that in excess of 40 percent of the content of U.S. imports from Mexico is of U.S. origin.[14] Furthermore, Dallas Fed economists estimate that as much as 70 percent of U.S. imports from Mexico are “intermediate goods.”[15] This is because much of the U.S. trade with Mexico is related to integrated production chains and logistical arrangements between U.S. and Mexican companies. It is our view at the Dallas Fed that these arrangements have helped improve competitiveness and create jobs in the U.S. Without these arrangements, these jobs might have otherwise been lost to other areas of the world, particularly Asia.
While trade and globalization have yielded net economic benefits for the U.S. economy, they have also created severe local hardships that the U.S. and other advanced economies have struggled to address. The challenge is how to reap the benefits of globalization while addressing the disruptions it creates—failing to address these disruptions is likely to reduce public support for global trade, which could have negative implications for the pace of economic growth in the U.S. and globally. - Technology-enabled disruption. In order to improve their competiveness, many companies are actively investing in technology, which is leading to a significant reduction in the number of workers needed to produce goods and services. The result is that U.S. workers across a range of industries are finding that their jobs are being restructured or eliminated. While this trend has increased productivity in most industries, I believe one key reason that overall labor productivity growth has been sluggish is that displaced workers are often going to less-productive jobs. This issue is a key reason I have been emphasizing the need for beefed-up skills training to help displaced workers get retrained so they can find more-productive employment. It is also why the Dallas Fed has been working on highlighting the need for early-childhood literacy and other initiatives which could improve educational-attainment levels in order to help our citizens better thrive in a world which increasingly demands greater education, training and adaptability.
Many industries are also facing a disruptive technology-enabled competitor that is threatening their business model by offering lower cost and greater convenience in the sale of goods or services. Think the digital camera versus the old film industry, Amazon versus retail stores, Khan Academy versus brick-and-mortar schools, 3-D printing versus traditional manufacturing, Uber and Lyft versus taxis, and so on. This technology-enabled disruption has allowed consumers to achieve better value and more easily comparison shop for merchandise and services. It has also reduced the pricing power of many companies and caused them to intensify their focus on creating greater operational efficiencies.
I believe that the dislocations resulting from technology-enabled disruption are sometimes confused with the impacts of globalization. That is, a substantial number of job losses may have more to do with technology-enabled disruption even though they may be attributed to globalization.
Disruption may also help explain why companies, facing one or more disruptive competitors, have been more cautious about making capacity-expansion decisions as well as investing in major capital projects. In my view, it may also help explain the record level of merger activity globally, as companies attempt to address disruptive changes and lack of pricing power by achieving greater scale economies in order to maintain or improve profit margins.
In light of these secular trends and the sluggish economic growth over the past several years, I have been speaking the last several months about the need for structural reforms and fiscal policy to join the menu of economic policy. Monetary policy is not designed, by itself, to address the key structural challenges we face today stemming from changing demographic trends and lower rates of productivity growth as well as dislocations created by globalization and increasing rates of technology-enabled disruption. While monetary policy has a key role to play, it is not a substitute for structural reforms and other actions that could address deeper fundamental challenges.
The primary prism I use to judge new structural reforms and potential fiscal policies is whether they help grow the labor force and/or improve productivity growth in the U.S. GDP growth is comprised of these two components, and I believe potential new policies should be judged in the context of whether they create sustainable improvement in these measures.
The Current Stance of Monetary Policy
I believe that we are making good progress in reaching our full-employment objective. The U.S. consumer is healthy, and business activity continues to strengthen. Global growth has been stronger than expected in 2017. While our estimate of 2.4 percent U.S. GDP growth in 2017 is sluggish by historical standards, it should be sufficient to continue to remove slack from the labor market.
Normally, at this stage in the recovery and with a tightening labor market, we would expect to see increasing evidence of inflation pressures. I believe that cyclical inflationary pressures are building as we remove slack from the labor market and approach full employment. However, I also believe that these cyclical forces are being at least partially offset by secular forces (described earlier in this essay), particularly an intensifying rate of technology-enabled disruption and, to a lesser extent, globalization. These secular forces are likely limiting the pricing power of businesses and muting inflationary pressures.
From a risk-management point of view, I am mindful that if we wait too long to see signs of greater inflation, we may get “behind the curve” and have to play catch up by increasing rates more rapidly. Historically, this has increased the likelihood of recession.
I am also mindful that there is a cost to excessive accommodation in terms of limiting returns to savers as well as creating distortions and imbalances in investing, hiring and other business decisions. Monetary policy accommodation is not costless—it carries risks. It has been my experience that significant imbalances are often easier to recognize in hindsight and can be very painful to address.
However, I believe that structural forces, particularly slowing workforce growth due to an aging population, will continue to pose challenges for future economic growth. As a result, my view is that the neutral rate, the interest rate at which we are neither accommodative nor restrictive, is likely to be much lower than we are historically accustomed. Therefore, I have argued that future removals of accommodation should be done in a gradual and patient manner.
Based on these considerations, I intend to keep an open mind about removing accommodation in upcoming FOMC meetings. In the months ahead, I will continue to assess the economy’s progress in removing labor slack, and I will be looking for evidence that building cyclical forces have the prospect of offsetting structural headwinds, such that we can expect to make progress toward meeting our 2 percent inflation objective in the medium term. Given the strength of the U.S. economy, I think it is likely we will see greater evidence of this progress and, as a consequence, it will be appropriate to continue the process of gradually removing monetary accommodation.
Notes
The views expressed are my own and do not necessarily reflect official positions of the Federal Reserve System.
- Bureau of Economic Analysis, first quarter 2017.
- Federal Reserve Bank of Dallas and Bureau of Labor Statistics, second quarter 2017.
- See the 2017 Fortune 500 list of companies headquartered in Texas, http://fortune.com/fortune500/list/filtered?statename=Texas.
- “Hurricane Irma Losses $58–$83 Billion: Moody’s Analytics,” Artemis, Sept. 13, 2017, www.artemis.bm/blog/2017/09/13/hurricane-irma-economic-losses-58-83-billion-moodys-analytics/.
- “Twenty Metro Areas Are Home to Six-in-Ten Unauthorized Immigrants in the U.S.,” by Jeffrey S. Passel and D’Vera Cohn, FactTank, Pew Research Center, Feb. 9, 2017, www.pewresearch.org/fact-tank/2017/02/09/us-metro-areas-unauthorized-immigrants/.
- Texas Business Outlook Surveys special questions, Sept. 25, 2017. www.dallasfed.org/research/surveys/tssos/2017/1709/specquest.aspx.
- Census Bureau.
- “Labor Force Projections to 2024: The Labor Force Is Growing, but Slowly,” Monthly Labor Review, Bureau of Labor Statistics, December 2015, www.bls.gov/opub/mlr/2015/article/labor-force-projections-to-2024.htm.
- Census Bureau, Current Population Survey 2017 Annual Social and Economic Supplement, www.census.gov/cps/data/cpstablecreator.html.
- See “Catch Them Before They Fall: Identification and Assessment to Prevent Reading Failure in Young Children,” by Joseph K. Torgesen, National Institute of Child Health and Human Development, 1998 (and references therein).
- “Global Demographic Trends Shape Policy Environment,” by Mark Wynne, Federal Reserve Bank of Dallas Economic Letter, vol. 11, no. 7, 2016.
- Congressional Budget Office, www.cbo.gov/publication/52370.
- The 2017 Annual Report of the Board of Trustees of the Federal Old-Age and Survivors Insurance and Federal Disability Insurance Trust Funds, U.S. Social Security Administration, July 13, 2017. The 2017 Annual Report of the Boards of Trustees of the Federal Hospital Insurance and Federal Supplementary Medical Insurance Trust Funds, July 13, 2017.
- “Give Credit Where Credit Is Due: Tracing Value Added in Global Production Chains,” by Robert Koopman, William Powers, Zhi Wang and Shang-Jin Wei, National Bureau of Economic Research, National Bureau of Economic Research, NBER Working Paper no. 16426, December 2011.
- Federal Reserve Bank of Dallas Southwest Economy, Second Quarter 2017, www.dallasfed.org/~/media/documents/research/swe/2017/swe1702b.pdf
About the Author
Robert S. Kaplan was president and CEO of the Federal Reserve Bank of Dallas, 2015–21.