Eleventh District Banking Trends
First Quarter 2026
This report tracks the financial performance of Eleventh District banks in comparison with national averages, looking at profitability, loans, deposits and other key metrics. It is updated quarterly.
Highlights
- Banking conditions remained satisfactory through first quarter 2026.
- Profitability increased quarter over quarter and year over year for both Eleventh District banks and their U.S. peers with improvement driven by higher net interest income and lower provision expense.
- Asset quality metrics remained relatively benign, although troubled CRE loans continued to fuel an increase in Eleventh District banks’ noncurrent loan rate.
- Loan growth accelerated both overall and for Eleventh District banks’ CRE and C&I loans.
- Equity capital ratios increased.
Charts
Select a metric to go directly to the related chart below.
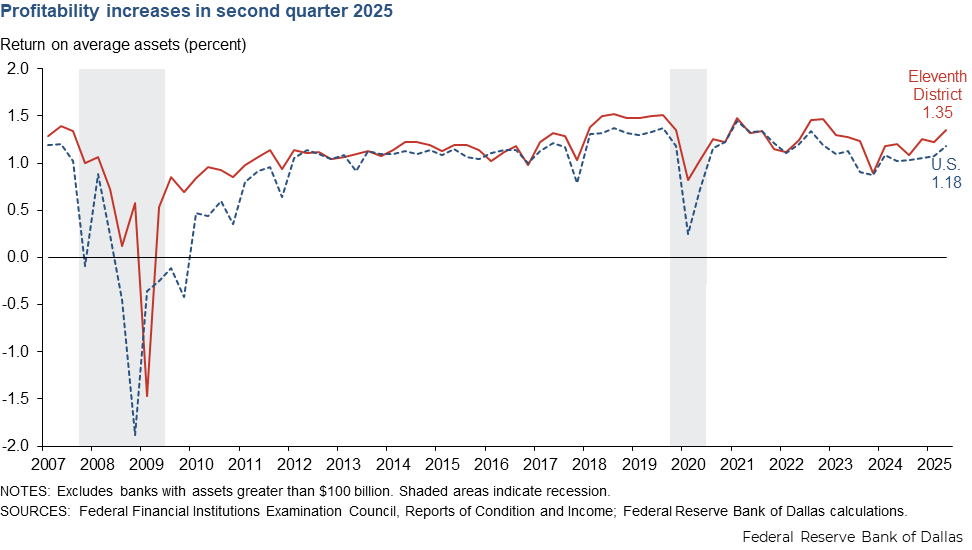
Return on average assets
- Eleventh District banks continued to outperform their U.S. peers in first quarter 2026.
- Return on average assets was up 7 basis points (bps) quarter over quarter and 19 bps year over year for Eleventh District banks and 1 bp quarter over quarter and 21 bps year over year for U.S. banks.
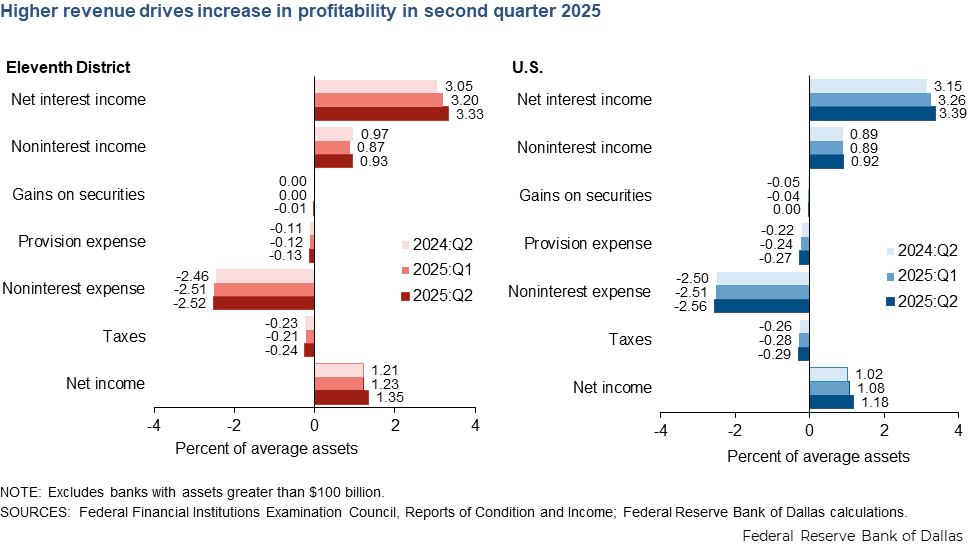
Net income breakdown
- Higher net interest income and lower provision expense led to an increase in Eleventh District banks’ profitability in first quarter 2026.
- Much of the higher profitability for Eleventh District banks relative to U.S. peers can be attributed to lower provision expense.
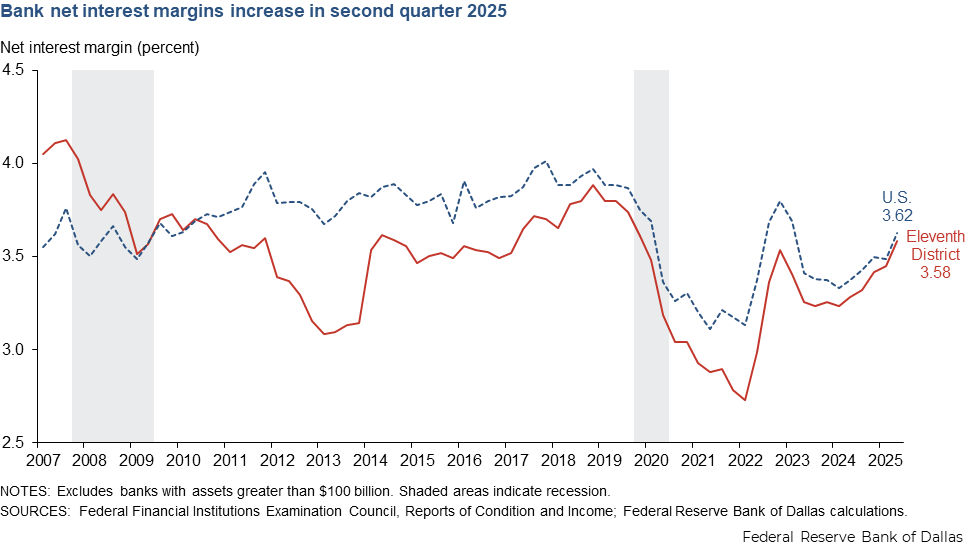
Net interest margins
- Bank net interest margin (NIM) trends were mixed in first quarter 2026, with an increase for Eleventh District banks and a decline for U.S. banks.
- For Eleventh District banks, interest expense fell faster than interest income in first quarter 2026, and NIM increased 3 bps quarter over quarter and 26 bps year over year.
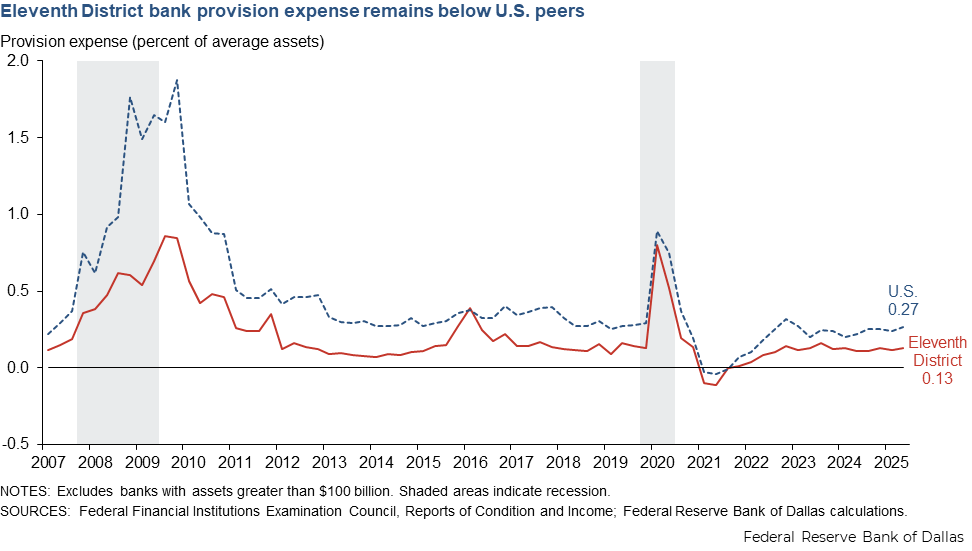
Provision expense
- Provision expense relative to average assets declined for the second consecutive quarter in first quarter 2026, falling to 0.11 percent for Eleventh District banks and 0.21 percent for U.S. banks.
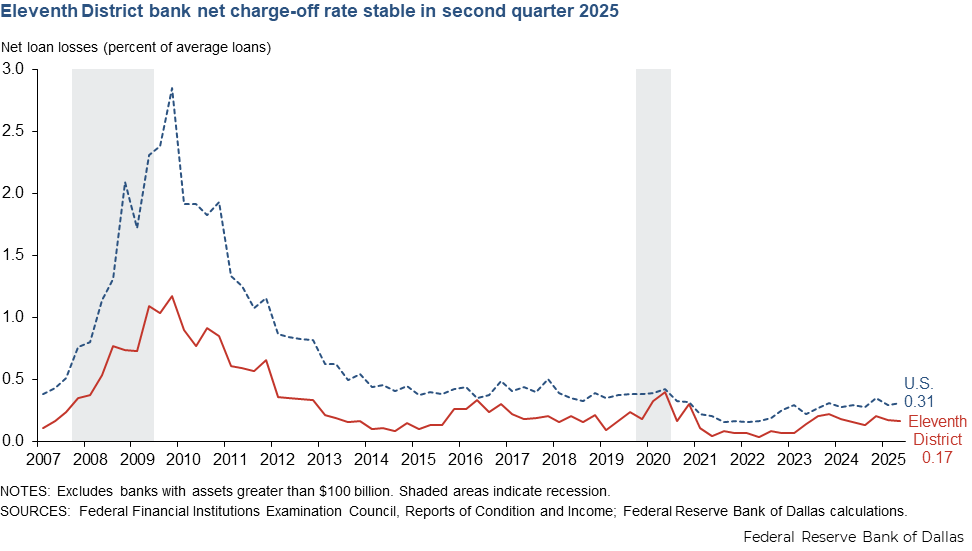
Net loan losses
- Eleventh District banks’ net loan charge-off rate declined 3 bps in first quarter 2026 to 0.18 percent.
- U.S. banks’ net loan charge-off rate fell 4 bps in first quarter 2026 to 0.31 percent.
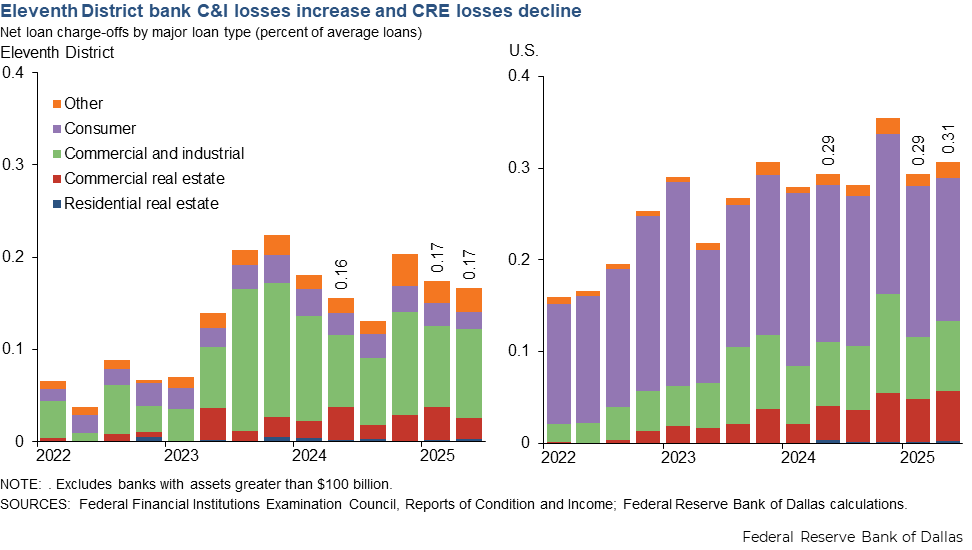
Net charge-offs by loan type
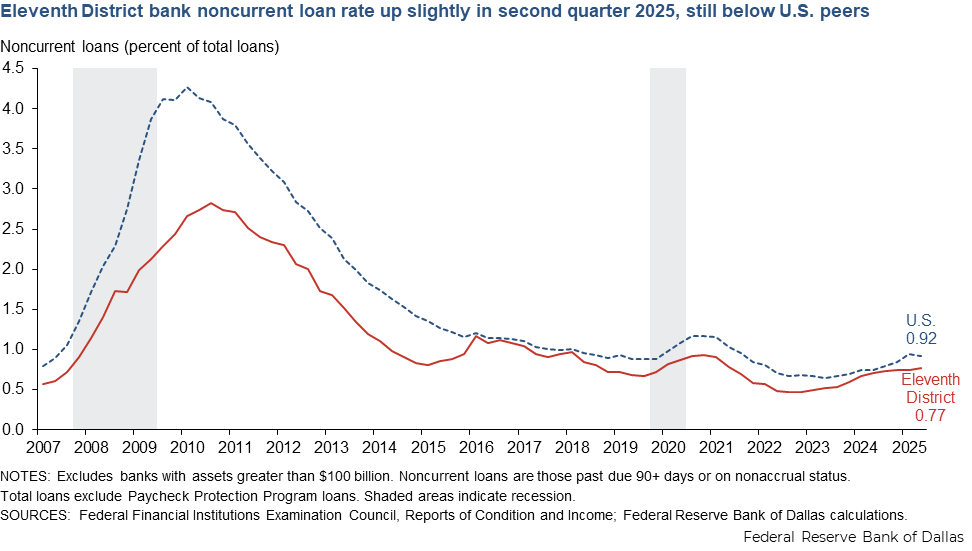
Noncurrent loans
- While still low compared with 2010 values, noncurrent loan rates increased to their highest level since early 2021.
- Eleventh District banks’ noncurrent loan rate remained below U.S. peers in first quarter 2026 but was up 7 bps quarter over quarter and 13 bps year over year
- U.S. banks’ noncurrent loan rate was up 7 bps quarter over quarter and 9 bps year over year in first quarter 2026.
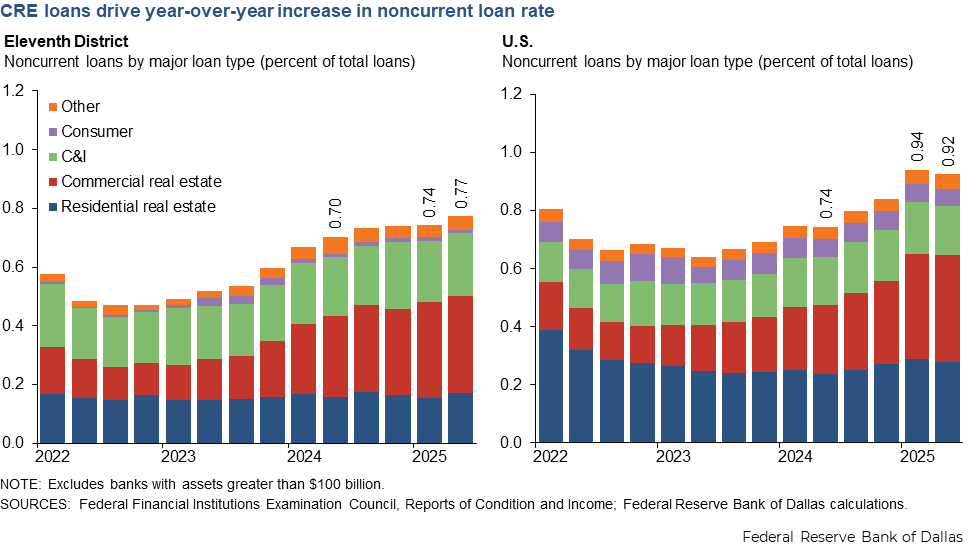
Noncurrent loans by type
- Eleventh District banks’ noncurrent loan rate increase was driven primarily by a 7 bps increase in noncurrent commercial real estate loans in first quarter 2026.
- U.S. banks’ noncurrent commercial real estate loans increased by 1 bp in first quarter 2026.
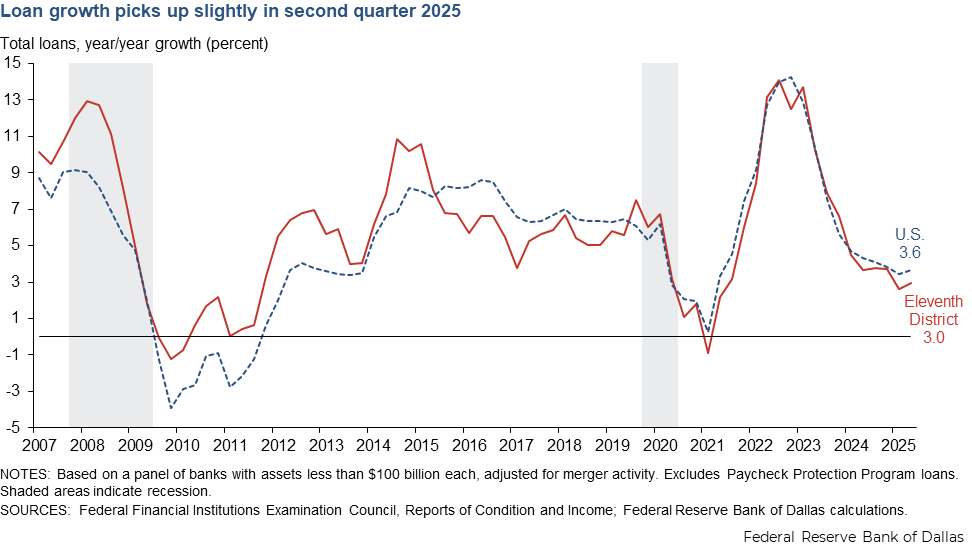
Loan growth
- Loan growth picked up in first quarter 2026 for both Eleventh District banks and U.S. peers.
- For Eleventh District banks, loan growth for the one-year period ending March 31, 2026, was 5.6 percent, up from 4.1 percent the previous quarter, as CRE and C&I growth accelerated.
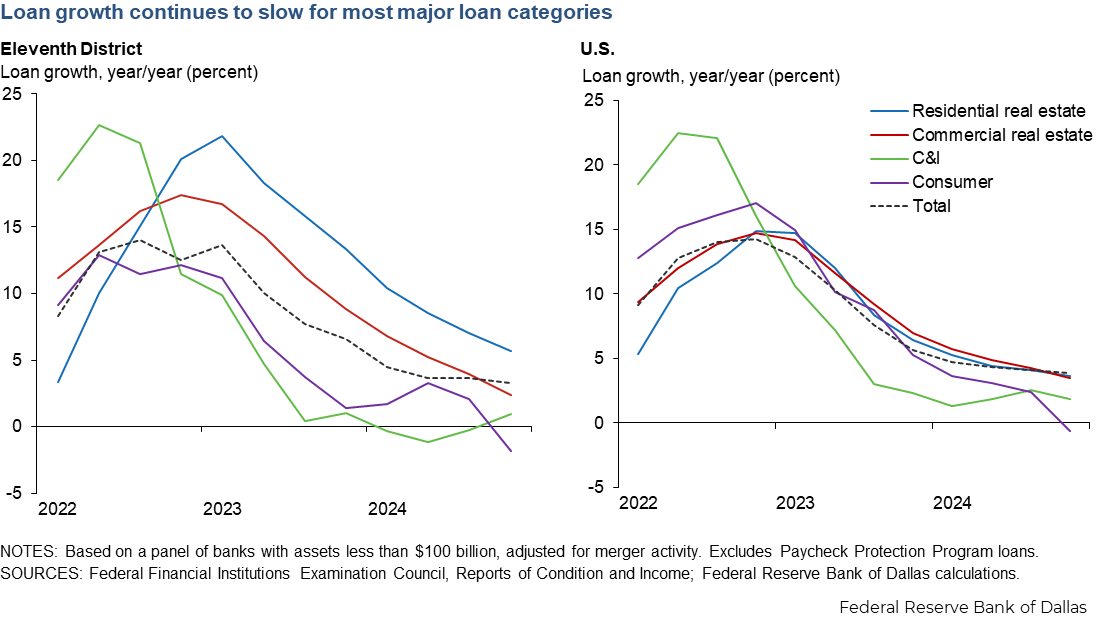
Loan growth by type
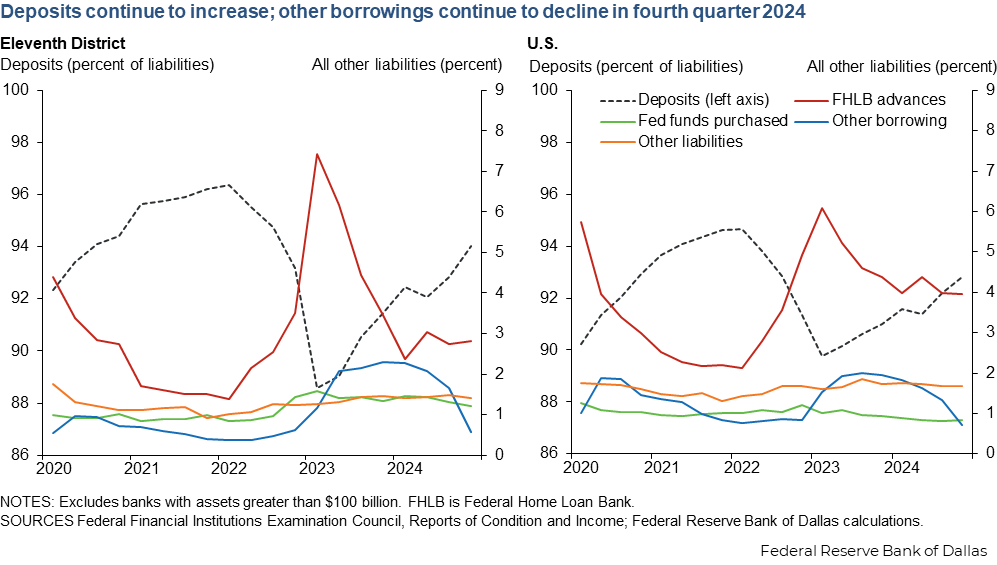
Funding mix
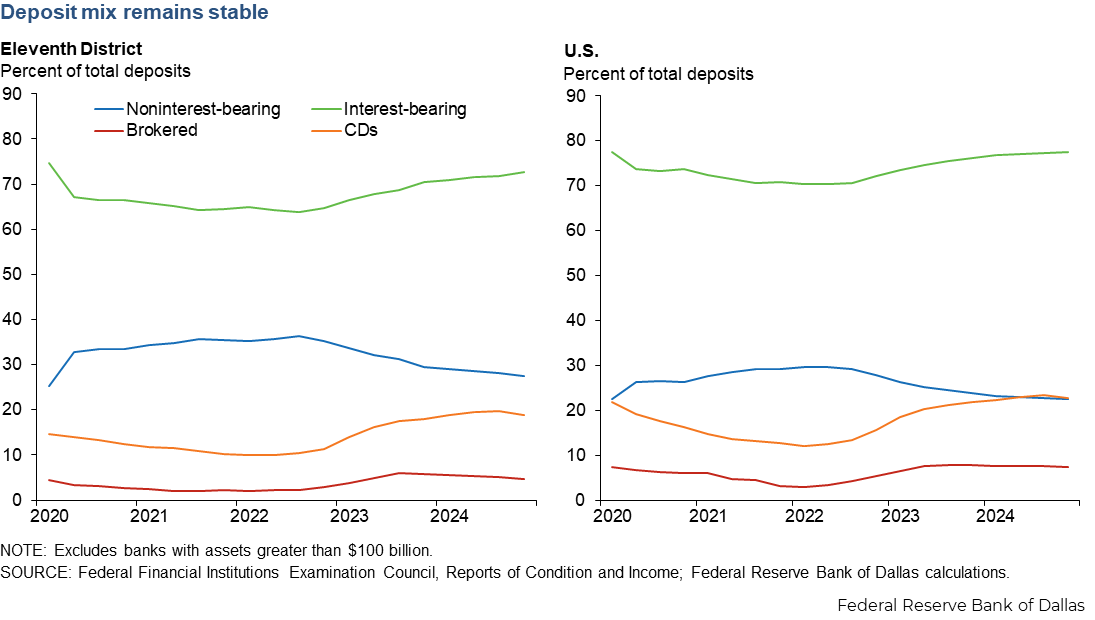
Deposit mix
Equity capital ratios
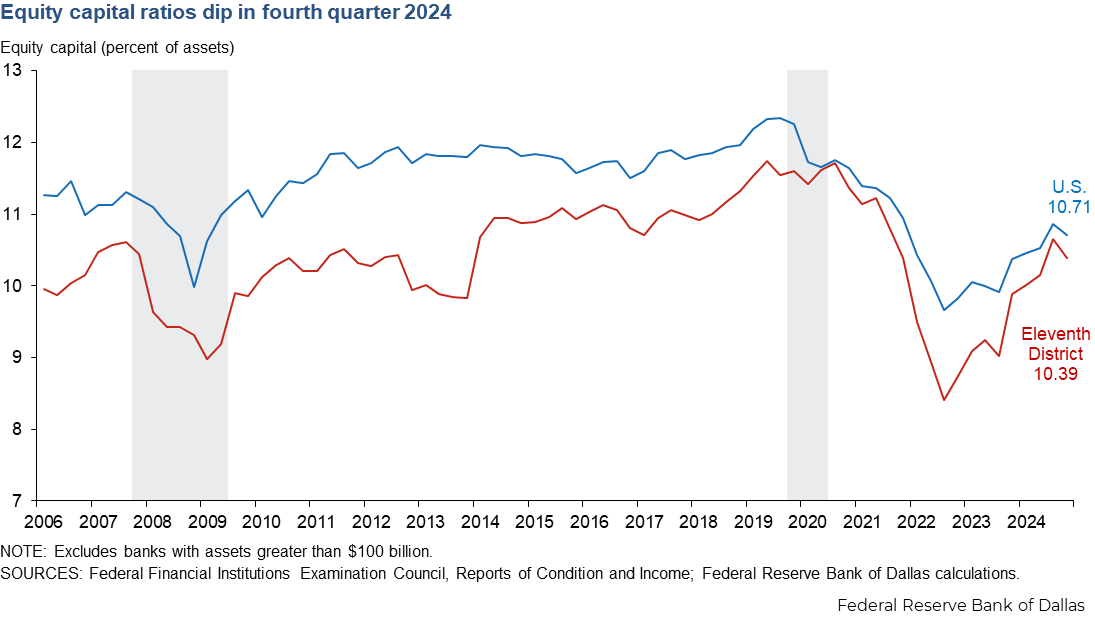
NOTES: Analysis excludes banks with assets greater than $100 billion (one bank in the Eleventh District and 33 banks nationwide).
The Eleventh Federal Reserve District includes Texas, northern Louisiana and southern New Mexico. Banks headquartered in the Eleventh District may also operate elsewhere.
About Eleventh District Banking Trends
For more information about this report, contact Emily Greenwald.