Where We Stand: Assessment of Economic Conditions and Implications for Monetary Policy
August 21, 2018
In our most recent Federal Open Market Committee meeting, the committee agreed to keep the federal funds rate in a range of 1.75 to 2 percent. Our August 1 statement characterized the current stance of monetary policy as “accommodative” and described growth in economic activity and employment as “strong.”
The Dallas Fed is one of the 12 regional Federal Reserve Banks in the United States. The Eleventh District is composed of Texas, northern Louisiana and southern New Mexico. Texas accounts for approximately 8.8 percent of U.S. gross domestic product (GDP) and 8.4 percent of U.S. nonfarm employment. It is the largest energy-producing state in the U.S. as well as the nation’s largest exporting state.[1] It is home to approximately 50 Fortune 500 companies and numerous industry-leading small and mid-sized firms. The characteristics of our district give the Dallas Fed unique insight into energy, trade and immigration issues as well as great insight into the regional, national and global economies.
The purpose of this essay is to discuss economic conditions in the Eleventh District and the U.S. I will also discuss the implications of this assessment for the stance of monetary policy in the U.S.
Economic Conditions
The Eleventh District
Texas jobs increased at an annualized rate of approximately 3.2 percent for the first seven months of 2018. This rate of job growth is estimated to be the second-highest of any state in the nation. Dallas Fed economists expect Texas jobs to increase nearly 3 percent for the full-year 2018. This strong rate of growth is broad based geographically and across industries. While growth is highly diversified, the energy sector is adding jobs at a faster rate than any other industry. Our Texas Business Outlook Surveys lend further evidence to continued widespread and broad-based expansion.[2]
The Texas economy continues to benefit from domestic migration (as well as immigration) of people and the movement of firms to the state. Aided by this trend, the state’s economy has become increasingly diversified and its population continues to grow rapidly. The population of Texas is now approaching approximately 29 million. This population growth has been associated with faster workforce growth than in other states in the U.S., which has helped fuel the district’s very strong rate of economic growth.
Energy Industry. Due to the significant industrial diversification in the state, the energy industry now accounts for approximately 9.4 percent of Texas GDP. The state’s energy production, transmission and refining industries have expanded considerably over the past few years. Due to substantial growth in the Permian Basin, the United States is now producing approximately 10.7 million barrels of oil per day (mb/d) and is expected to produce approximately 11.2 mb/d by the end of 2018.[3] This compares with current production in Russia of approximately 11.2 mb/d and in Saudi Arabia of 10.4 mb/d.[4] Texas is the largest oil-producing state in the U.S. and accounts for a significant percentage of U.S. production growth. The state is expected to produce approximately 4.7 mb/d by year-end. As a geographic entity, Texas would be the fourth-largest oil producer in the world.[5]
Dallas Fed economists believe that global oil supply and demand are now in rough balance. Due to growth in global demand for oil, lack of investment in long-lived production projects over the past several years, and various production constraints (particularly pipeline capacity, worker shortages and other infrastructure challenges) in the Permian Basin as well as outages due to geopolitical issues (e.g., Iran and Venezuela), we believe that we are more likely to move to a global undersupply situation in the years ahead—with oil price risk tilted to the upside. These elements underpin our forecasts that Texas oil production, even with constraints, will grow substantially over the next several years.
The Outlook. Based on all these factors, Dallas Fed economists are optimistic about the prospects for Eleventh District growth in the short and medium term. However, worker shortages as well as U.S. trade policy, particularly regarding NAFTA, are issues that could negatively impact the outlook. Research by Dallas Fed economists indicates that the U.S. trading relationship with Mexico is substantially an “intermediate goods” relationship—part of integrated supply chain and logistics relationships that allow U.S.-domiciled companies to keep jobs in this country and increase their global competitiveness.[6] It is our view that without these trading relationships, the U.S. would likely lose market share to other countries, particularly in Asia. Based on this research, we are very hopeful that NAFTA will ultimately be modernized and that the basic elements of this trading relationship will be reaffirmed in a new NAFTA agreement.
U.S. Economy
U.S. GDP is estimated to have grown at a 3.1 percent annual rate over the first half of 2018. Rising consumer spending accounted for a little less than half of this growth, and unusually strong contributions from nonresidential business investment (approximately 1.2 percentage points) and net exports (approximately 0.5 percentage points) also contributed to growth. Dallas Fed economists forecast full-year GDP growth of approximately 3 percent. Based on this forecast, we expect the headline unemployment rate to reach 3.7 percent by year-end. In addition, we expect that headline personal consumption expenditures (PCE) inflation will remain in the neighborhood of the Federal Reserve’s 2 percent target during the remainder of 2018.
The unemployment rate currently stands at 3.9 percent. Despite job growth averaging 224,000 per month over the past three months, the unemployment rate remains the same as in April due to a strong flow of net entrants into the labor force. While our economists are hopeful that a strong labor market might continue to draw in new entrants who are currently out of the workforce, it is our base-case view that the current rate of labor force growth is unlikely to continue and that the unemployment rate will continue to decline, reaching 3.5 percent by the second quarter of 2019. In short, it is our judgment that we are in a tight labor market and are already past the level of full employment in the U.S. This tightness is likely to increasingly constrain economic growth.
Currently, the headline PCE inflation rate stands at approximately 2.2 percent for the 12 months ending June 2018. As mentioned earlier, Dallas Fed economists expect inflation to remain around the Federal Reserve’s longer-run PCE inflation target of 2 percent through the end of the year. The Dallas Fed tracks a number of measures beyond headline inflation to gauge overall inflation trends. In particular, Dallas Fed economists have developed the Trimmed Mean PCE inflation rate, which is a core inflation measure that, each month, excludes the most extreme upward and downward price movements. This measure now stands at 1.9 percent, and we expect it to reach 2 percent by the end of 2018.
Due to the tight labor market as well as higher input costs, it is my view that cyclical forces are creating upward pressure on inflation. However, I also believe that strong structural forces (discussed below)—particularly automation and globalization—are helping to mute the inflationary impact of these cyclical forces. These crosscurrents are worth keeping in mind as we continue to consider the appropriate stance of monetary policy.
Implications for Monetary Policy
Based on this forecast, it is my judgment that the Federal Reserve is meeting its full employment and price stability objectives. As such, we should be removing accommodation in a gradual manner in order to get to a neutral policy stance.
The Neutral Rate
The neutral rate of interest is the federal funds rate at which monetary policy is neither accommodative nor restrictive. It is a theoretical concept, meaning that it can’t be directly observed—it must be inferred from market and other economic data. Economists’ views on this rate are necessarily estimates and inherently uncertain. However, while theoretical, estimates of the neutral rate are critical to assessing and making decisions regarding the stance of monetary policy.
My own view, informed by the work of my colleagues Evan Koenig at the Dallas Fed [7] as well as John Williams of the New York Fed and Thomas Laubach at the Federal Reserve Board, [8] is that the longer-run neutral real rate of interest is in a broad range around 0.50 to 0.75 percent, or a nominal rate of roughly 2.50 to 2.75 percent.
With the current fed funds rate at 1.75 to 2 percent, it would take approximately three or four more federal funds rate increases of a quarter of a percent to get into the range of this estimated neutral level.
At this stage, I believe the Federal Reserve should be gradually raising the fed funds rate until we reach this neutral level. At that point, I would be inclined to step back and assess the outlook for the economy and look at a range of other factors—including the levels and shape of the Treasury yield curve—before deciding what further actions, if any, might be appropriate.
Beyond 2018
Dallas Fed economists have consistently forecast that 2018 will be a strong year for economic growth in the U.S. Reasons include a strong consumer sector, improved prospects for business investment due to tax incentives, solid global growth and substantial fiscal stimulus due to recent tax legislation and budget agreements.
My economic team has consistently cautioned that while 2018 will be strong, economic growth is likely to moderate in 2019 and 2020 as the impact of fiscal stimulus wanes and monetary policy approaches a more neutral stance. Their view has been that potential GDP growth in the U.S. is in the range of 1.75 to 2 percent and actual real GDP growth will likely reach this level by 2020 or 2021.
Our economists at the Dallas Fed believe that potential GDP growth is likely to be more muted than we have historically experienced due to the impact of four key structural drivers:
1. Demographics
The U.S. population is aging. The median age of the population has gone from 35.3 years in 2000 to 38.0 in 2017.[9] The share of population 65 years or older has risen to 16.1 percent from 12.8 percent 10 years ago. Chart 1 shows the ongoing trend of aging population—leading to declines in labor force growth rates and contributing to slowing population growth in the U.S.
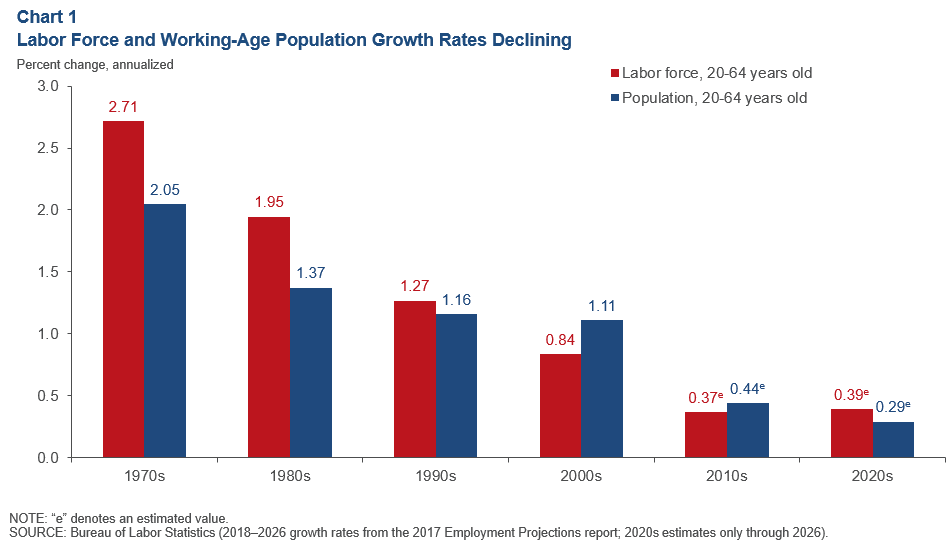
GDP growth is made up of growth in the workforce plus the rate of improvement in labor productivity. If workforce growth is slowing—unless we can make up for it through improvements in labor productivity—we will see lower rates of potential GDP growth. This slower potential GDP growth is crucial because it has significant implications for future living standards in the U.S. Because the projected path of government debt to GDP is historically elevated, higher rates of growth will be needed to service and pay off this debt and meet future entitlement obligations.
Furthermore, the labor force participation rate has declined from 66 percent in 2007 to approximately 63 percent today. Dallas Fed economists believe the bulk of this decline is due to aging of the workforce. In fact, we expect this trend to continue so that the labor force participation rate should decline to 61 percent over the next 10 years.[10] A declining fraction of the population participating in the workforce should lead to lower output growth.
2. Lagging Education and Skill Levels
It is my view that lagging education and skill levels in the U.S. are likely having a negative impact on productivity growth despite substantial innovations in technology and increased business investment.
While we have witnessed very rapid technological change and improvements, productivity growth has remained sluggish. Output per worker grew on average by approximately 1.9 percent per year in the 1990s, slowed to 1.4 percent in the 2000s and has slowed further to 1.0 percent since 2010. Our hypothesis at the Dallas Fed is that advancements in technology are having a profound impact on the workforce. This, in turn, is putting a premium on education and skill levels in order to improve workforce adaptability. A case in point is the changing nature of middle-skills jobs.
If you are one of the 46 million workers in this country with a high school education or less, or have a “routine” type of middle-skills job, you are likely finding that your job is being either restructured or eliminated as a result of technology. These workers may find another job in a strong job market, but unless they have gotten retrained, they are likely to see constraints on growth in their income and productivity. This may be one reason we haven’t seen a bigger productivity-growth payoff from recent advances in technology. Productivity growth that has occurred does not appear to have benefited all workers; those workers with less education may be finding their real wages and productivity declining in a new age where skills training and educational achievement levels are increasingly critical to adapting to the job market.
It is important to recognize that various research studies highlight that skill levels and educational achievement levels of the U.S. workforce have lagged those of other developed countries for the past several years. In surveys of 29 participating Organization for Economic Cooperation and Development (OECD) countries, the U.S. ranked 20th in assessments of adult literacy and math skills.[11] In addition, according to recent OECD surveys, the U.S. ranked 24th out of 35 developed countries in measures of math, science and reading skills among 15-year-olds.[12]
Research by Eric Hanushek of Stanford University with Ludger Woessmann of the University of Munich suggests that improvements in U.S. math and science skills could translate into meaningful improvements in potential GDP growth.[13] While these efforts are likely to take years, they could have substantial potential to improve future growth and prosperity in the U.S.
At the Dallas Fed, we believe that in order to address this powerful structural driver, the U.S. must do more to improve early childhood literacy and college readiness and beef up skills training at our high schools and community colleges. These efforts are a powerful investment in improving the quality of our human capital, which is essential to higher levels of GDP growth in the U.S.
3. The Potentially Unsustainable Path of U.S. Government Debt to GDP
Potentially unsustainable government debt growth in the U.S. is creating a fiscal tailwind in 2018 and 2019 but may turn into a headwind if the U.S. takes steps to moderate its historically high expected path of debt growth. Despite the fact that the current economic expansion is the second longest in the postwar period, U.S. government debt held by the public now stands at 75.8 percent of GDP,[14] and the present value of unfunded entitlements is estimated at approximately $54 trillion.[15] The recent tax legislation and bipartisan budget compromise legislation are likely to exacerbate these issues. As a consequence of this level of debt, the U.S. is much less likely to have the fiscal capacity to fight the next recession.
Further, high and rising levels of government debt as well as elevated levels of corporate debt mean that the U.S. economy is becoming much more interest rate sensitive. That is, increases in interest rates would likely require a higher proportion of cash flow in order to service corporate and government debt obligations. Structural reforms and other actions that flatten the path of future government debt growth may be advisable to keep this short-term-growth tailwind from becoming a medium- and longer-term headwind to economic growth in the U.S.
4. Globalization
Failing to take advantage of the opportunities of globalization is likely to lower U.S. GDP relative to potential. With less than 5 percent of the world’s population,[16] the U.S. faces growth capacity constraints and has developed integrated supply chains and logistics arrangements in this hemisphere which have helped improve U.S. competitiveness. Dallas Fed economists believe it makes sense to segment U.S. trading relationships into those which are primarily final goods versus intermediate goods. For example, our trade deficit with China is primarily final goods. Conversely, our trading relationships with Mexico and Canada are primarily intermediate goods. As mentioned earlier, intermediate-goods trading relationships are more indicative of integrated supply chain and logistics arrangements which have allowed U.S. companies to add jobs and increase their global competitiveness.
In addition, the U.S. has historically added to its workforce growth through immigration. Immigrants and their children have made up over half the workforce growth in the U.S. over the past two decades,[17] and this proportion is likely to be even higher over the next two decades, as shown in Chart 2.
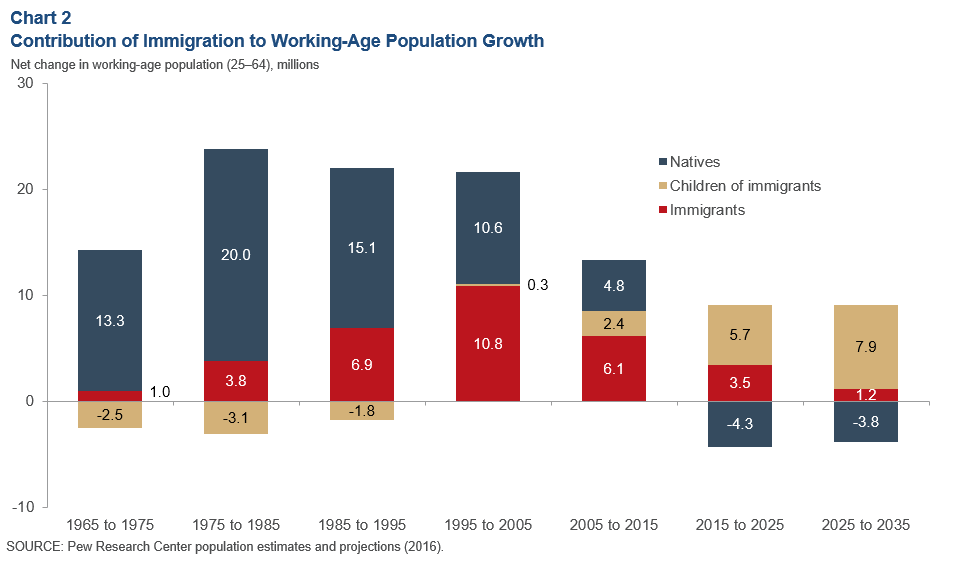
Dallas Fed research indicates that immigration generally contributes to a larger labor force, which has benefits for economic growth.[18] Our research also indicates that high-skilled immigration has been shown to positively influence productivity growth. Nearly half of college-educated immigrants majored in science, technology, engineering or math (STEM). This far outpaces U.S.-born college-educated workers, about one quarter of whom major in STEM fields. High-skilled foreign-born workers have also been shown to patent at higher rates than native workers, largely as a result of their concentration in the STEM fields.[19] This type of innovative activity has been shown to be a key factor in U.S. productivity growth in the post-World War II period.[20]
How the U.S. navigates these globalization challenges will have critical impacts on potential GDP growth.
Where We Go from Here
When I joined the Fed in September of 2015, the federal funds rate was 0.0 to 0.25 percent. This rate had not been adjusted since late 2008. The Fed’s balance sheet stood at approximately $4.5 trillion.
Since that time, the Fed has been able to gradually remove accommodation and implement a plan to reduce the size of its balance sheet. Over this period, the unemployment rate has moved down substantially and inflation is now running at approximately 2 percent.
At this juncture, the challenge for the Fed is to raise the federal funds rate in a gradual manner calibrated to extend this expansion, but not so gradually as to get behind the curve so that we have to play catch-up and raise rates quickly. Having to raise rates quickly would likely increase the risk of recession.
As I judge the pace at which we should be raising the federal funds rate, I will be carefully watching the U.S. Treasury yield curve. Currently the one-year Treasury rate is 2.44 percent, the two-year is 2.61 percent and the 10-year is 2.87 percent.[21] My own view is that the short end of the Treasury curve is responding to Federal Reserve policy expectations. The longer end of the curve is telling me that, while there is substantial global liquidity and a search for safe assets, expectations for future growth are sluggish—and this is consistent with an expectation that U.S. growth will trend back down to potential. Overall, the shape of the curve suggests to me we are “late” in the economic cycle. I do not discount the significance of an inverted yield curve—I believe it is worth paying attention to given the high historical correlation between inversions and recession.
I will also be closely monitoring global financial and economic developments and their potential impact on domestic financial and economic conditions. As global financial markets and economies have become increasingly interconnected, the potential for spillovers to the U.S. is greater than in the past. That is, global economic and financial instability has the potential to transmit to domestic financial markets, potentially leading to a tightening of financial conditions which, if prolonged, could lead to a slowing in U.S. economic activity.
Based on these various factors, as well as the current strength of the U.S. economy and my outlook for economic conditions over the medium term, I believe it will be appropriate for the Fed to continue to gradually move toward a neutral monetary policy stance. I believe that this gradual approach to removing monetary policy accommodation will give us the best chance of managing against imbalances and further extending the current economic expansion in the U.S.
Notes
The views expressed are my own and do not necessarily reflect official positions of the Federal Reserve System. I would like to acknowledge the contributions of Tyler Atkinson, Jennifer Chamberlain, Jim Dolmas, Marc Giannoni, James Hoard, Evan Koenig, Karel Mertens, Pia Orrenius, Kunal Patel, William Simmons, Irfan Taj, Kathy Thacker, Joe Tracy, Mark Wynne and Mine Yücel in preparing these remarks.
- Data are from the U.S. Energy Information Administration and Census Bureau, www.eia.gov/state/rankings/#/series/101 and www.census.gov/foreign-trade/Press-Release/2018pr/06/exh2s.pdf.
- The Dallas Fed’s Texas Business Outlook Surveys can be found at www.dallasfed.org/research/surveys.aspx.
- International Energy Agency, as of July 2018. Oil refers to crude oil and lease condensate.
- International Energy Agency.
- Assuming Iraq oil production stays at current levels. Data are Dallas Fed estimates.
- “Intra-Industry Trade with Mexico May Aid U.S. Global Competitiveness,” by Jesus Cañas, Aldo Heffner and Jorge Herrera Hernández, Federal Reserve Bank of Dallas Southwest Economy, Second Quarter 2017, www.dallasfed.org/~/media/documents/research/swe/2017/swe1702b.pdf.
- “Assessing Monetary Accommodation: A Simple Empirical Model of Monetary Policy and Its Implications for Unemployment and Inflation,” by Evan F. Koenig and Alan Armen, Federal Reserve Bank of Dallas Staff Papers, no. 23, December 2015.
- “Measuring the Natural Rate of Interest,” by Thomas Laubach and John C. Williams, Review of Economics and Statistics, MIT Press, vol. 85, no. 4, 2003, pp. 1,063–70. Also see “Measuring the Natural Rate of Interest: International Trends and Determinants,” by Kathryn Holston, Thomas Laubach and John C. Williams, Journal of International Economics, vol. 108, no. S1, 2017, pp. 59–75.
- Census Bureau.
- Bureau of Labor Statistics employment projections.
- According to the Survey of Adult Skills (Program for International Assessment of Adult Competencies) (2012, 2015) by the Organization for Economic Cooperation and Development (OECD), the U.S. ranks 17th in literacy and 23rd in math out of 29 countries and 15th in problem solving in technology-rich environments out of 26 countries. An average of scores across the literacy and math categories places the U.S. 20th.
- According to the 2015 Program for International Student Assessment (PISA) by the OECD, the U.S. ranks 19th in science, 20th in reading and 31st in mathematics out of 35 OECD countries. An average of the scores across the three categories places the U.S. 24th.
- Hanushek and Woessmann (2016) estimate that a sustained 25-point increase in the U.S. students’ average PISA scores could lead to an increase of 0.5 percentage points in potential gross domestic product growth in the longer run. See “Skills, Mobility, and Growth,” by Eric Hanushek and Ludger Woessmann in Economic Mobility: Research & Ideas on Strengthening Families, Communities & the Economy, Alexandra Brown, David Buchholz, Daniel Davis and Arturo Gonzalez, ed., St. Louis: Federal Reserve Bank of St. Louis and the Board of Governors of the Federal Reserve System, 2016, pp. 423–49. Also see “Human Capital in Growth Regressions: How Much Difference Does Data Quality Make?” by Angel de la Fuente and Rafael Doménech, Journal of the European Economic Association, vol. 4, no. 1, 2006, pp. 1–36; and “Growth and Human Capital: Good Data, Good Results,” by Daniel Cohen and Marcelo Soto, Journal of Economic Growth, vol. 12, no. 1, 2007, pp. 51–76.
- As of second quarter 2018. U.S. Department of the Treasury and Bureau of Economic Analysis.
- “The 2018 Annual Report of the Boards of Trustees of the Federal Hospital Insurance and Federal Supplementary Medical Insurance Trust Funds,” Centers for Medicare and Medicaid Services, June 5, 2018.
- 2017 United Nations population estimates.
- “Immigration Projected to Drive Growth in U.S. Working-Age Population Through at Least 2035,” by Jeffrey S. Passel and D’Vera Cohn, Factank, Pew Research Center, March 8, 2017.
- “Gone to Texas: Migration Vital to Growth in the Lone Star State,” by Pia Orrenius, Alexander T. Abraham and Stephanie Gullo, Federal Reserve Bank of Dallas Southwest Economy, First Quarter, 2018.
- “How Much Does Immigration Boost Innovation?” by Jennifer Hunt and Marjolaine Gauthier-Loiselle, American Economic Journal: Macroeconomics, vol. 2, no. 2, 2010, pp. 31–56.
- “Sources of U.S. Economic Growth in a World of Ideas,” by Charles I. Jones, American Economic Review, vol. 92, no. 1, 2002, pp. 220–39.
- As of August 17, 2018.
About the Author
Robert S. Kaplan was president and CEO of the Federal Reserve Bank of Dallas, 2015–21.