Texas Service Sector Sees Continued Growth in March

Texas Service Sector Outlook Survey
Texas Service Sector Sees Continued Growth in March
For this month’s survey, Texas business executives were asked supplemental questions on wages and prices, as well as impacts related to the Russia–Ukraine war. Results for these questions from the Texas Manufacturing Outlook Survey, Texas Service Sector Outlook Survey and Texas Retail Outlook Survey have been released together. Read the special questions results.
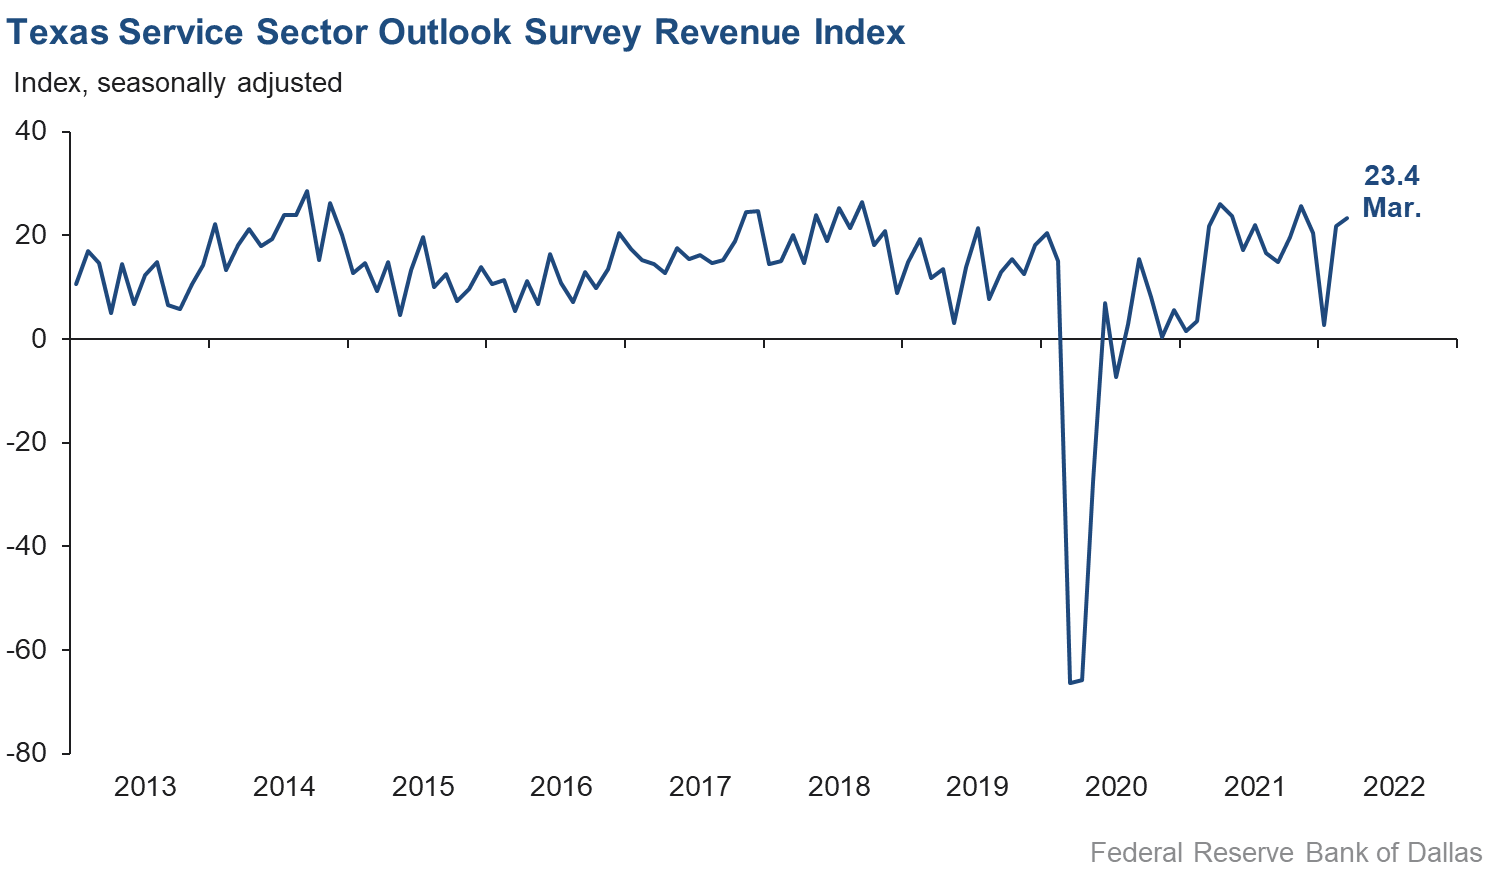
Activity in the Texas service sector grew at a steady pace in March, according to business executives responding to the Texas Service Sector Outlook Survey. The revenue index, a key measure of state service sector conditions, increased from 21.9 in February to 23.4 in March, its highest level in four months.
Labor market indicators point to steady growth in hiring and hours worked relative to February. The employment index was unchanged at 14.4, and the part-time employment index was also stable at 7.0. The hours worked index was flat at 9.9 in March, with 13 percent of respondents noting a lengthening of average hours worked by employees compared with just 3.0 percent noting a shortening of hours worked.
Perceptions of broader business conditions remained positive overall, though optimism was more muted compared with February. The general business activity index fell six points to 10.6, while the company outlook index, though still positive, declined from 14.2 to 2.7. Uncertainty surged, with the outlook uncertainty index rising from 7.6 to 22.5—its highest level since mid-2020.
March saw continued upward pressure on wages and prices. The wages and benefits index rose from 34.7 to 36.5, with 37 percent of respondents noting a rise in labor compensation costs compared with February. The selling prices index rose from 29.9 to 33.9, while the input prices index surged from 51.2 to 59.2. Both readings are record highs for the surveys going back to 2007.
Despite a drastic rise in uncertainty, respondents’ expectations regarding future business activity continued to reflect optimism going forward. The future general business activity index slipped from 21.2 to 15.4, while the future revenue index rose four points to 55.8. Other future service sector activity indexes such as employment and capital expenditures increased or remained elevated, suggesting robust growth over the next six months.

Texas Retail Outlook Survey
Texas Retail Sales Growth Stalls in March
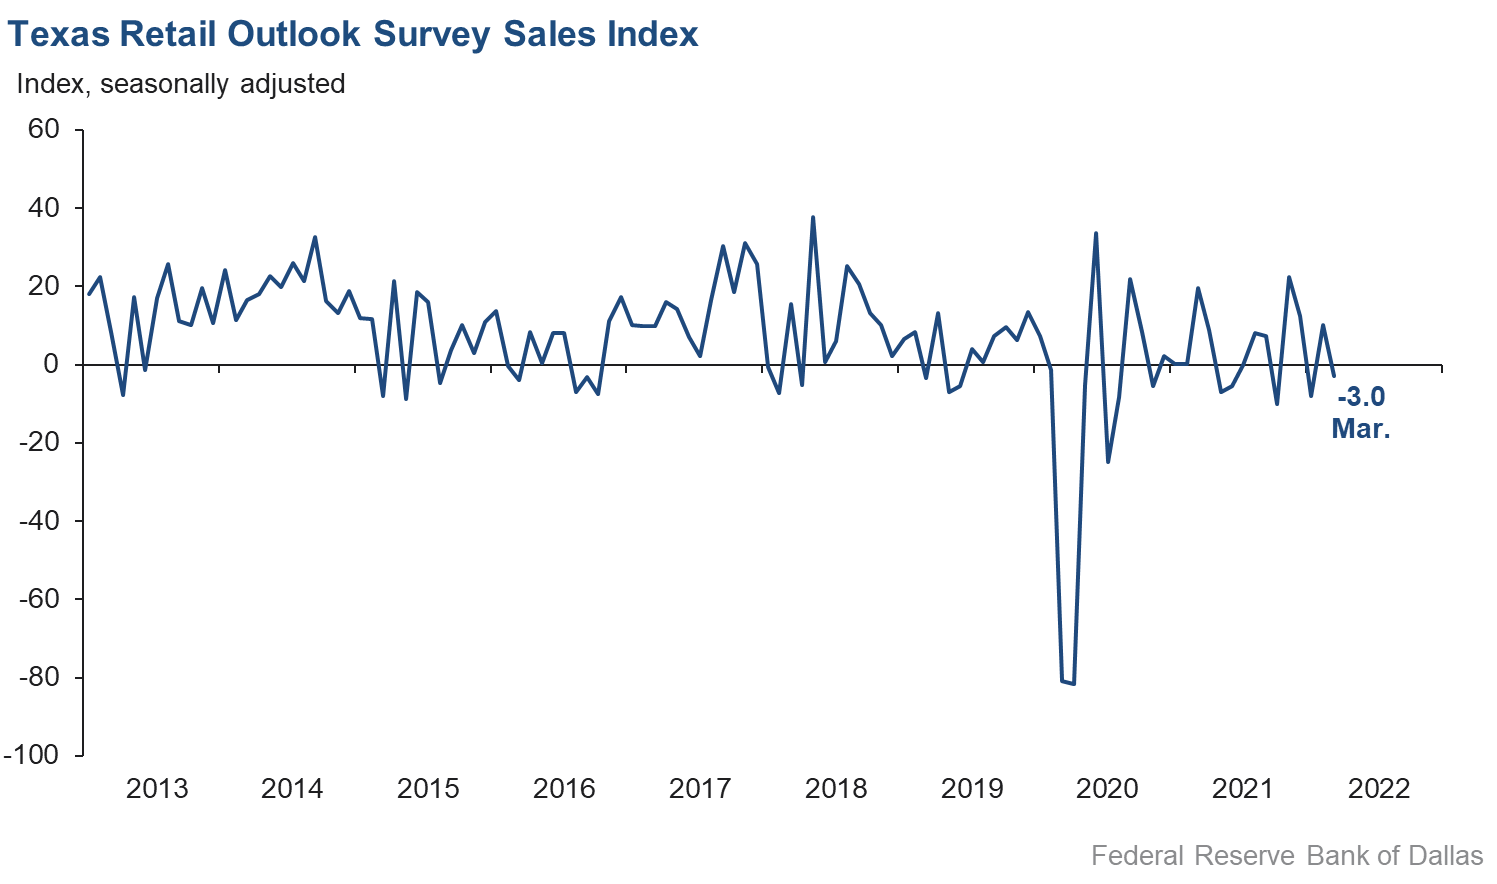
March retail sales activity declined slightly after a moderate rebound last month, according to business executives responding to the Texas Retail Outlook Survey. The sales index, a key measure of state retail activity, fell from 10.2 in February to -3.0 in March. Firms continued to draw down their inventories, as the inventories index fell from -2.1 to -8.3, its third consecutive negative reading.
Retail labor market indicators remained positive but weakened from February’s readings. The employment index fell from 11.0 to 2.0, while the part-time employment index dipped three points to 5.4. The hours worked index declined from 10.6 to 4.5, suggesting a slower pace of growth in the average hours worked among retail staff.
Retailers’ perceptions of broader business conditions turned pessimistic in March. The general business activity index declined into negative territory, falling from 2.7 to -9.8, while the company outlook index plunged nearly 19 points to -10.8. Outlook uncertainty also increased moderately, with the relevant index picking up from 2.2 to 7.5.
Retail price and wage pressures remained highly elevated in March. The selling prices index slipped from 49.9 to 48.6, while the input prices index advanced five points to 59.7. Over half of retailers noted month-over-month increases in input and selling prices. The wages and benefits index held largely steady at 33.7, remaining at a level suggestive of widespread retail wage growth.
Expectations for future retail activity softened in March. The future general business activity index fell from 10.1 to 3.0, while the future sales index declined slightly from 39.1 to 37.9. Other indexes of future retail activity were mixed, though all remained positive and continued to point to further increases in retail activity through much of 2022.
The Texas Retail Outlook Survey is a component of the Texas Service Sector Outlook Survey that uses information only from respondents in the retail and wholesale sectors.
Next release: April 26, 2022
Data were collected March 15–23, and 265 Texas service sector business executives, of which 42 were retailers, responded to the survey. The Dallas Fed conducts the Texas Service Sector Outlook Survey monthly to obtain a timely assessment of the state’s service sector activity. Firms are asked whether revenue, employment, prices, general business activity and other indicators increased, decreased or remained unchanged over the previous month.
Survey responses are used to calculate an index for each indicator. Each index is calculated by subtracting the percentage of respondents reporting a decrease from the percentage reporting an increase. When the share of firms reporting an increase exceeds the share reporting a decrease, the index will be greater than zero, suggesting the indicator has increased over the prior month. If the share of firms reporting a decrease exceeds the share reporting an increase, the index will be below zero, suggesting the indicator has decreased over the prior month. An index will be zero when the number of firms reporting an increase is equal to the number of firms reporting a decrease. Data have been seasonally adjusted as necessary.
Texas Service Sector Outlook Survey
Historical data are available from January 2007 to the most current release month.
| Business Indicators Relating to Facilities and Products in Texas Current (versus previous month) | ||||||||
| Indicator | Mar Index | Feb Index | Change | Series Average | Trend* | % Reporting Increase | % Reporting No Change | % Reporting Decrease |
Revenue | 23.4 | 21.9 | +1.5 | 11.3 | 20(+) | 35.9 | 51.6 | 12.5 |
Employment | 14.4 | 14.6 | –0.2 | 6.4 | 20(+) | 23.9 | 66.6 | 9.5 |
Part–Time Employment | 7.0 | 6.5 | +0.5 | 1.6 | 16(+) | 10.2 | 86.6 | 3.2 |
Hours Worked | 9.9 | 10.4 | –0.5 | 2.8 | 19(+) | 12.9 | 84.1 | 3.0 |
Wages and Benefits | 36.5 | 34.7 | +1.8 | 15.1 | 22(+) | 37.2 | 62.1 | 0.7 |
Input Prices | 59.2 | 51.2 | +8.0 | 26.3 | 23(+) | 59.7 | 39.8 | 0.5 |
Selling Prices | 33.9 | 29.9 | +4.0 | 6.5 | 20(+) | 35.8 | 62.3 | 1.9 |
Capital Expenditures | 15.2 | 19.2 | –4.0 | 10.0 | 19(+) | 19.3 | 76.6 | 4.1 |
| General Business Conditions Current (versus previous month) | ||||||||
| Indicator | Mar Index | Feb Index | Change | Series Average | Trend** | % Reporting Improved | % Reporting No Change | % Reporting Worsened |
Company Outlook | 2.7 | 14.2 | –11.5 | 5.6 | 2(+) | 14.2 | 74.2 | 11.5 |
General Business Activity | 10.6 | 16.6 | –6.0 | 4.1 | 15(+) | 22.5 | 65.6 | 11.9 |
| Indicator | Mar Index | Feb Index | Change | Series Average | Trend* | % Reporting Increase | % Reporting No Change | % Reporting Decrease |
Outlook Uncertainty† | 22.5 | 7.6 | +14.9 | 11.4 | 10(+) | 29.5 | 63.6 | 7.0 |
| Business Indicators Relating to Facilities and Products in Texas Future (six months ahead) | ||||||||
| Indicator | Mar Index | Feb Index | Change | Series Average | Trend* | % Reporting Increase | % Reporting No Change | % Reporting Decrease |
Revenue | 55.8 | 51.6 | +4.2 | 37.9 | 23(+) | 61.6 | 32.6 | 5.8 |
Employment | 40.6 | 38.4 | +2.2 | 22.9 | 23(+) | 46.0 | 48.7 | 5.4 |
Part–Time Employment | 18.3 | 12.0 | +6.3 | 7.0 | 22(+) | 20.9 | 76.5 | 2.6 |
Hours Worked | 13.0 | 12.4 | +0.6 | 6.0 | 23(+) | 16.3 | 80.4 | 3.3 |
Wages and Benefits | 55.3 | 55.4 | –0.1 | 36.8 | 23(+) | 56.6 | 42.1 | 1.3 |
Input Prices | 64.5 | 59.8 | +4.7 | 44.0 | 183(+) | 67.2 | 30.1 | 2.7 |
Selling Prices | 49.5 | 45.4 | +4.1 | 23.9 | 23(+) | 50.7 | 48.1 | 1.2 |
Capital Expenditures | 29.6 | 34.5 | –4.9 | 23.6 | 22(+) | 32.7 | 64.2 | 3.1 |
| General Business Conditions Future (six months ahead) | ||||||||
| Indicator | Mar Index | Feb Index | Change | Series Average | Trend** | % Reporting Improved | % Reporting No Change | % Reporting Worsened |
Company Outlook | 14.6 | 24.6 | –10.0 | 17.1 | 20(+) | 26.8 | 61.0 | 12.2 |
General Business Activity | 15.4 | 21.2 | –5.8 | 14.3 | 20(+) | 27.7 | 60.0 | 12.3 |
Historical data are available from January 2007 to the most current release month.
| Business Indicators Relating to Facilities and Products in Texas Retail (versus previous month) | ||||||||
| Indicator | Mar Index | Feb Index | Change | Series Average | Trend* | % Reporting Increase | % Reporting No Change | % Reporting Decrease |
| Retail Activity in Texas | ||||||||
Sales | –3.0 | 10.2 | –13.2 | 5.5 | 1(–) | 21.7 | 53.6 | 24.7 |
Employment | 2.0 | 11.0 | –9.0 | 1.9 | 8(+) | 12.7 | 76.6 | 10.7 |
Part–Time Employment | 5.4 | 8.4 | –3.0 | –1.6 | 13(+) | 9.2 | 87.0 | 3.8 |
Hours Worked | 4.5 | 10.6 | –6.1 | –1.7 | 2(+) | 12.1 | 80.3 | 7.6 |
Wages and Benefits | 33.7 | 34.9 | –1.2 | 10.5 | 20(+) | 35.0 | 63.7 | 1.3 |
Input Prices | 59.7 | 54.3 | +5.4 | 21.3 | 23(+) | 60.4 | 38.9 | 0.7 |
Selling Prices | 48.6 | 49.9 | –1.3 | 13.1 | 22(+) | 53.2 | 42.2 | 4.6 |
Capital Expenditures | 13.5 | 18.7 | –5.2 | 8.0 | 14(+) | 16.0 | 81.5 | 2.5 |
Inventories | –8.3 | –2.1 | –6.2 | 1.9 | 3(–) | 22.1 | 47.4 | 30.4 |
| Companywide Retail Activity | ||||||||
Companywide Sales | –9.8 | 6.0 | –15.8 | 6.9 | 1(–) | 16.6 | 57.0 | 26.4 |
Companywide Internet Sales | 2.6 | –0.9 | +3.5 | 5.8 | 1(+) | 15.3 | 72.0 | 12.7 |
| General Business Conditions, Retail Current (versus previous month) | ||||||||
| Indicator | Mar Index | Feb Index | Change | Series Average | Trend** | % Reporting Improved | % Reporting No Change | % Reporting Worsened |
Company Outlook | –10.8 | 7.8 | –18.6 | 3.6 | 1(–) | 2.3 | 84.6 | 13.1 |
General Business Activity | –9.8 | 2.7 | –12.5 | –0.1 | 1(–) | 8.0 | 74.2 | 17.8 |
| Outlook Uncertainty Current (versus previous month) | ||||||||
| Indicator | Mar Index | Feb Index | Change | Series Average | Trend* | % Reporting Increase | % Reporting No Change | % Reporting Decrease |
Outlook Uncertainty† | 7.5 | 2.2 | +5.3 | 9.2 | 10(+) | 15.0 | 77.5 | 7.5 |
| Business Indicators Relating to Facilities and Products in Texas, Retail Future (six months ahead) | ||||||||
| Indicator | Mar Index | Feb Index | Change | Series Average | Trend* | % Reporting Increase | % Reporting No Change | % Reporting Decrease |
| Retail Activity in Texas | ||||||||
Sales | 37.9 | 39.1 | –1.2 | 33.0 | 23(+) | 45.3 | 47.3 | 7.4 |
Employment | 31.8 | 28.8 | +3.0 | 13.2 | 23(+) | 35.1 | 61.6 | 3.3 |
Part–Time Employment | 11.0 | 11.0 | 0.0 | 1.7 | 20(+) | 14.9 | 81.2 | 3.9 |
Hours Worked | 13.7 | 11.7 | +2.0 | 3.2 | 23(+) | 18.4 | 76.9 | 4.7 |
Wages and Benefits | 52.2 | 46.0 | +6.2 | 28.7 | 23(+) | 52.7 | 46.8 | 0.5 |
Input Prices | 61.5 | 47.7 | +13.8 | 34.0 | 23(+) | 64.1 | 33.3 | 2.6 |
Selling Prices | 57.5 | 50.0 | +7.5 | 29.9 | 23(+) | 60.0 | 37.5 | 2.5 |
Capital Expenditures | 22.5 | 40.9 | –18.4 | 17.9 | 22(+) | 22.5 | 77.5 | 0.0 |
Inventories | 19.7 | 36.5 | –16.8 | 10.5 | 23(+) | 35.7 | 48.4 | 16.0 |
| Companywide Retail Activity | ||||||||
Companywide Sales | 43.7 | 46.4 | –2.7 | 31.6 | 23(+) | 50.6 | 42.5 | 6.9 |
Companywide Internet Sales | 34.5 | 39.5 | –5.0 | 22.9 | 24(+) | 34.5 | 65.5 | 0.0 |
| General Business Conditions, Retail Future (six months ahead) | ||||||||
| Indicator | Mar Index | Feb Index | Change | Series Average | Trend** | % Reporting Improved | % Reporting No Change | % Reporting Worsened |
Company Outlook | 7.7 | 16.8 | –9.1 | 17.6 | 23(+) | 20.6 | 66.5 | 12.9 |
General Business Activity | 3.0 | 10.1 | –7.1 | 13.4 | 20(+) | 15.6 | 71.8 | 12.6 |
*Shown is the number of consecutive months of expansion or contraction in the underlying indicator. Expansion is indicated by a positive index reading and denoted by a (+) in the table. Contraction is indicated by a negative index reading and denoted by a (–) in the table.
**Shown is the number of consecutive months of improvement or worsening in the underlying indicator. Improvement is indicated by a positive index reading and denoted by a (+) in the table. Worsening is indicated by a negative index reading and denoted by a (–) in the table.
†Added to survey in January 2018.
Data have been seasonally adjusted as necessary, with the exception of the outlook uncertainty index which does not yet have a sufficiently long time series to test for seasonality.
Texas Service Sector Outlook Survey
Texas Retail Outlook Survey
Texas Service Sector Outlook Survey
Comments from Survey Respondents
These comments are from respondents’ completed surveys and have been edited for publication.
- The Ukraine war is causing global supply-chain issues.
- Inflation, supply problems, labor shortage, war and politics are at their worst! What business problems.
- Activity is slightly better as the global oil price level is increasing activity with expected increased volumes in the Permian Basin later this year (about six to nine months’ lag time).
- What is really detrimental to my business, a commercial trailer rental company, is that customers expect no price increases in rentals, yet getting more used trailers to lease now costs three times more. Therefore, even though I have a loan to buy more equipment, I cannot do so, because I cannot raise my leasing rates.
- As expected, the extreme cost of fuel for trucks is taking a huge gouge out of profits. We are restructuring rates and fees. In attempting to add trucks to our fleet, the value and cost of trucks has increased tremendously, again increasing our cost to provide services (lease, maintenance and insurance costs), as well as exposure. We are increasing rates to cover this, also. Evaluation of general business activity is improved due to new staff adding operational capacity to take advantage of market activity; however, the higher costs and exposure are negatively impacting our ability to do so.
- There is some increasing uncertainty based on the conflict in Europe, as our port has three customers that do import goods from Russia or Ukraine. Overall, however, as near-shoring of production continues and Europe looks for additional sources of energy to replace that formerly supplied by Russia, the outcome of the conflict from a business perspective is probably accretive to our economic output.
- [Activity is] about the same as the last survey.
- [There is] lots of activity and deeper purchasing from current clients. Sales to prospects are much more difficult currently. Seems like [there are] a lot of factors—uncertainty about the markets, interest rates, hiring, potential war. Hiring talented folks is as difficult as we've experienced in our many-decade careers. Retaining current employees is all about allowing folks to: (1) work from home (and therefore make managers work harder to ensure work is getting done) and (2) [offering] large wage increases to make up for high inflation and other firms paying much more to attract talent.
- We really do not know what the general level of business activity is. We know our industry—residential 1–4 [unit] financing. Refinances are down. Housing inventory for the middle class is shrinking. We are trying to figure out how to help our staff deal with rising prices. The infection of falling expectations is probably everywhere in the private sector.
- There are so many variables taking place simultaneously that it is difficult to anticipate the outcome. Inflation is certainly creating huge burdens for most industries. Commodity prices are increasing at a record pace and agriculture supplies like fuel, fertilizer and seed are causing a change in plans for the spring. A large region of the country is also feeling the effects of a widespread drought. If the velocity of money stalls again, there will be another collection of cash in banks—driving deposits up to record highs and putting more pressure on capital levels for banks.
- There is too much uncertainty with the war in Europe, inflation, interest rate hikes, wage increases and lack of a qualified workforce.
- Costs are increasing everywhere. The labor market remains tight but not as tight as six months ago. Regulatory concerns are increasing.
- We have concerns about supply-chain issues, inflation and labor costs.
- Inflation and construction costs and the cost of property insurance in Texas are causing some concern.
- Rising interest rates, high energy prices and decoupling from the Russian economy appear to provide ample reason to believe a recession is around the corner.
- Energy, labor, food and services are all going up with inflation. Much of this is due to the U.S.’ lack of energy independence. The war is creating uncertainty along with the supply chain.
- We are still dealing with lack of inventory Also, hiring qualified people is difficult. Now the rise in interest rates and war in Ukraine are unsettling.
- The supply chain is not getting any better. We normally carry 700 to 800 whole goods (construction machinery) in stock. We have 114 right now. We got 63 units in February; they were all sold as soon as they touched down, which isn't all that bad, it's just that we could sell three times that many if we could get them. War, inflation, supply chain, fuel costs—everything is certainly worse!
- While oil prices are currently high, the push to increase production in the U.S. has the potential to drive prices very low as we have seen in the past. The swings in the oil price do not make for a good capital investment environment for larger projects. Fracking a well is clearly defined in terms of cost, and usually there is assurance that the results will yield sufficient oil to pay for it in a year two. Larger projects that are on a time scale of four to five years are held back by the total uncertainty in the current global environment. The war in Ukraine and the sanctions associated with it, as well as the future actions that may be taken by either side, just further restrict major investments. My independent consulting business is not seeing very many opportunities in major projects. I really expect this to continue for the next few years and is very dependent upon the outcome of the war in Ukraine.
- The U.S. economy is slowing down a lot and may be entering recession due to severe economic mismanagement by the new Biden administration. With the COVID situation receding, U.S. growth should be skyrocketing, but we do not see it. First quarter 2022 (January, February, March) is looking very bad for our company's revenue and business climate. (We sell our software worldwide.)
- We are usually busier by this time of year, but COVID kept courtrooms in limbo and still uncertain about how many trials can go forward. However, they continue to conduct proceedings as best as they can to keep things moving. It feels like things are starting to open up more, which will increase cases.
- Energy prices are up, due in part to Russia's invasion of Ukraine. Energy companies are unlikely to increase their real estate holdings or occupancy in the near term due to the current increase in energy pricing and in the long term due to their cost constraints, pressure on profitability and share prices, and due to remote-work lessons learned during COVID. This will lessen the typical upward pressure on real estate—a direct impact on our workload.
- Product delays are extending further; some items now are more than a year on backorder. Our total backorder [value] is over $12 million.
- We are still having trouble finding qualified skilled labor despite offering more money per hour and benefits.
- We are exploring the possibility of expanding our small team from three to four people as there is potential for a handful of contracts to increase. We are approaching this expansion ever so slowly however because of the volatility of our world right now and how it will impact the nonprofit sector.
- There is a lot of uncertainty with the recent lockdowns in China. We expect the supply-chain crisis to continue and possibly even get worse. This is in addition to rising prices of commodities.
- The real estate market continues to be strong in spite of the inflation levels and the war. The residential market is showing signs of weakening due to the lack of inventory, but the commercial market remains very strong. We all know what higher inflation and interest rates can do to real estate, so we are being cautious as we look at the possibilities of future expansion.
- We see a continuation of last year's high level of activity and good acceptance of rates. So, the trend is for a better year than last year.
- Labor costs for new hires and employee retention are onerous and challenging.
- The continuing uncertainty created in Western markets by the Ukraine–Russia war, including pending economically painful results in the European Union from the effects of the sanctions against Russia, presently overshadows the prospectively positive economic developments as the world broadly adjusts to a return to normal operating procedures following two years of disruption from COVID.
- Fuel costs rising could lead to reduced consumer spending and hurt retail tenants’ revenue and desire to grow, thus reducing demand.
- Inflation being at [a multi-decade] high is a major concern for consumers and businesses as well as increasing our labor/employee cost. Unless increasing revenues catch up with rising costs, a recession is inevitable. Rising interest rates will positively impact our bank's gross margin (net interest margin), but the time lag is creating a negative impact.
- We are still unable to find labor.
- We cannot increase our prices enough to overcome the increase in costs.
- We are concerned about the continued shortage of labor, uncertainty around the war in Ukraine, plus the new strain of COVID in Hong Kong and Europe.
- I'm not seeing anything worrisome in data, so for that reason, I am remaining positive, but the world events and the increasing inflation have my uncertainty higher for sure.
- Our biggest challenge is getting technical testing equipment from overseas now. We have hired new technicians but cannot equip them for at least three months because of the "supply-chain issues." This is really starting to affect our day-to-day operations. The second challenge is the price of fuel is starting to work its way into our revenue as of the last two weeks.
- There is unease over international uncertainty, inflation concerns and general market uncertainty.
- Access to qualified or provisionally qualified teaching staff K–12 remains the critical concern. Government support in bringing more individuals into the profession or opening immigration for professionals is urgent and necessary.
- Delivery of our trainings occurs both virtually and in person, and there's still a margin of safety schools are adhering to that allows in-person trainings or even makes their staff available to train. The virtual option allows for flexibility to continue generating revenue.
- Supply-chain disruption and escalating cost, particularly for building supplies, have become somewhat ominous for us as we embark on a large expansion of the physical plant.
- Hiring challenges persist, and salaries continue to increase to prevent attrition.
- Interest in our retirement community remains strong; however, cost of goods and services is increasing. Higher costs of living are also having an adverse effect on our employees, some of which are asking for higher wages or looking for higher-paying positions.
- We have seen an increase in sickness and [employee] time not at work.
- Back-to-office delays, slow business travel, employee shortage and increased cost of goods sold as well as other expenses are our main problems.
- Supply-chain issues continue to be a major factor.
- The cost of goods and inflation are likely preventing some from dining out, and the restaurant industry still has many waiting on help from EIDL [Economic Injury Disaster Loan] modifications, including me.
- I am in the process of expanding my barbershops in and around San Antonio. I am doubling my footprint from six locations to 12 locations. My greatest concern is being able to hire qualified barbers and stylists. Hiring is our biggest challenge, as we are not getting enough applicants.
- Supply-chain issues continue to be a negative impact on manufacturing. Material shortages ranging from resins to precious metals persist.
- Supply-chain issues continue to plague the food service industry. Protein orders are still being filled below order quantities (down 20–30 percent). Trucking costs are skyrocketing, up 30–50 percent, sometimes more. With the recent run-up in oil prices, all transportation companies are passing along increased fuel surcharges. They are averaging 5 percent of total shipping cost. In other words, shipping costs have been historically high for the last 12 months, and now they are increasing another 5 percent because of higher fuel costs.
- Supply-chain problems continue to make the automobile business difficult.
- We continue to see supply-chain issues further eroding our new-vehicle inventory levels to the lowest in 18 months. The lack of new-vehicle production is continuing to affect used-vehicle values. Our auto repair business is seeing supply-chain issues causing parts shortages and delays. Labor [cost] is at an all-time high as we see wages for repair technicians continue to climb. The lack of new and used vehicles is pushing customers to repair more.
- Inventories remain tight.
- We are very concerned about a number of things negatively impacting our business and our country. Generally, I see problems on the horizon. Once again, the Federal Reserve’s decision to misread the market and consistently increase prime interest rates is not the answer to our many problems.
Historical Data
Historical data can be downloaded dating back to January 2007.
Indexes
Download indexes for all indicators. For the definitions of all variables, see Data Definitions.
Texas Service Sector Outlook Survey |
Texas Retail Outlook Survey |
| Unadjusted | Unadjusted |
| Seasonally adjusted | Seasonally adjusted |
All Data
Download indexes and components of the indexes (percentage of respondents reporting increase, decrease, or no change). For the definitions of all variables, see Data Definitions.
Texas Service Sector Outlook Survey |
Texas Retail Outlook Survey |
| Unadjusted | Unadjusted |
| Seasonally adjusted | Seasonally adjusted |
Special questions
Questions regarding the Texas Service Sector Outlook Survey can be addressed to Christopher Slijk at christopher.slijk@dal.frb.org.
Sign up for our email alert to be automatically notified as soon as the latest Texas Service Sector Outlook Survey is released on the web.