Texas Service Sector Outlook Survey


Solid growth in Texas service sector activity continues
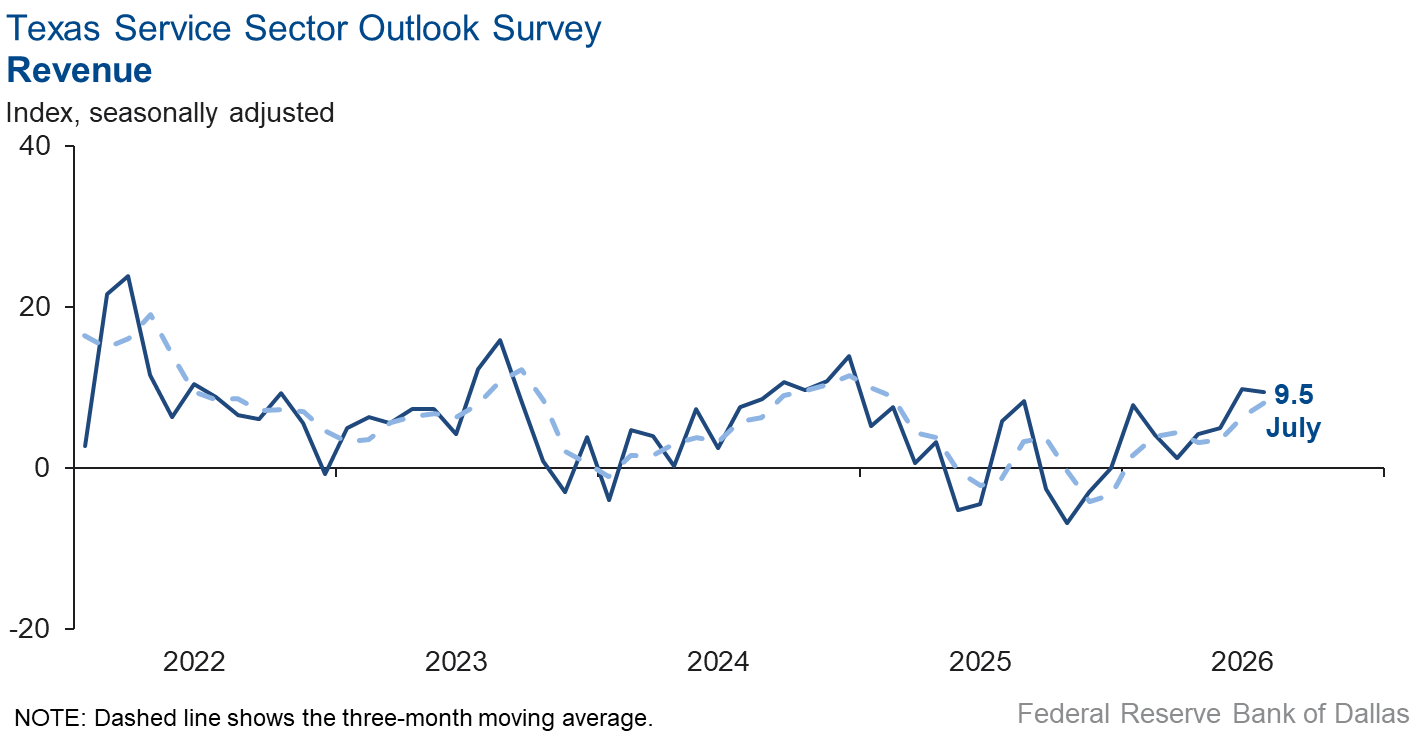
Texas service sector activity expanded at about the same pace in July as the prior month, according to business executives responding to the Texas Service Sector Outlook Survey. The revenue index, a key measure of state service sector conditions, was little changed at 9.5.
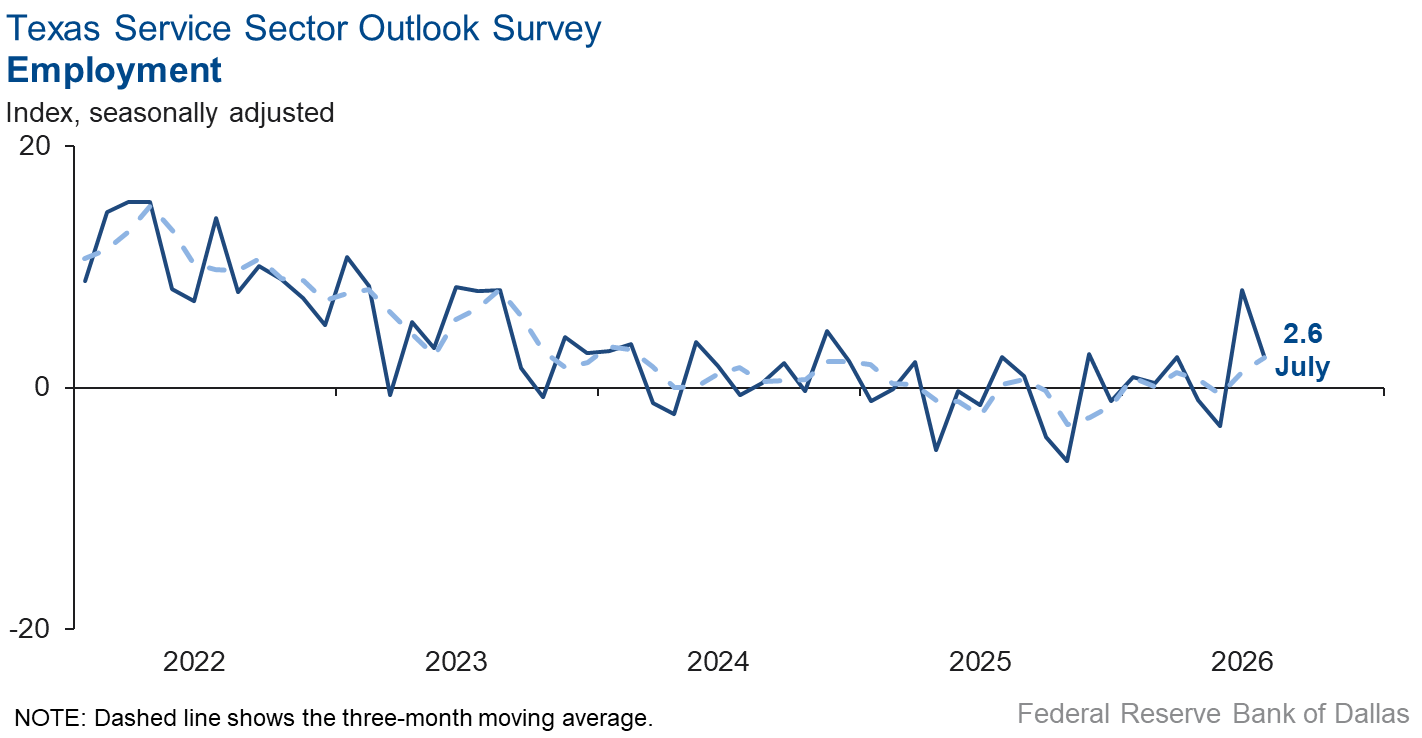
Labor market measures suggested employment continued to grow, though at a slower pace than in June, while workweeks increased at a similar pace. The employment index fell to 2.6 from 8.1 while the hours worked index held steady at 4.9.
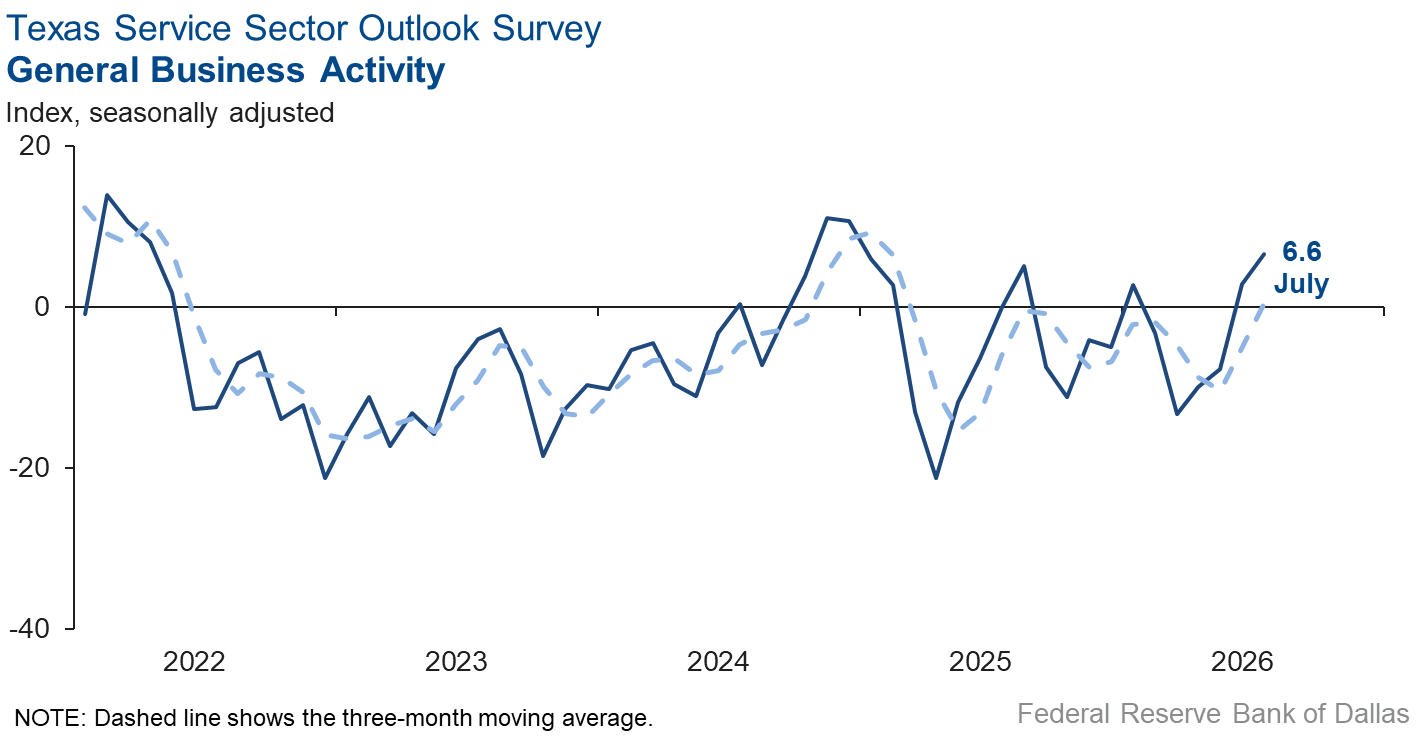
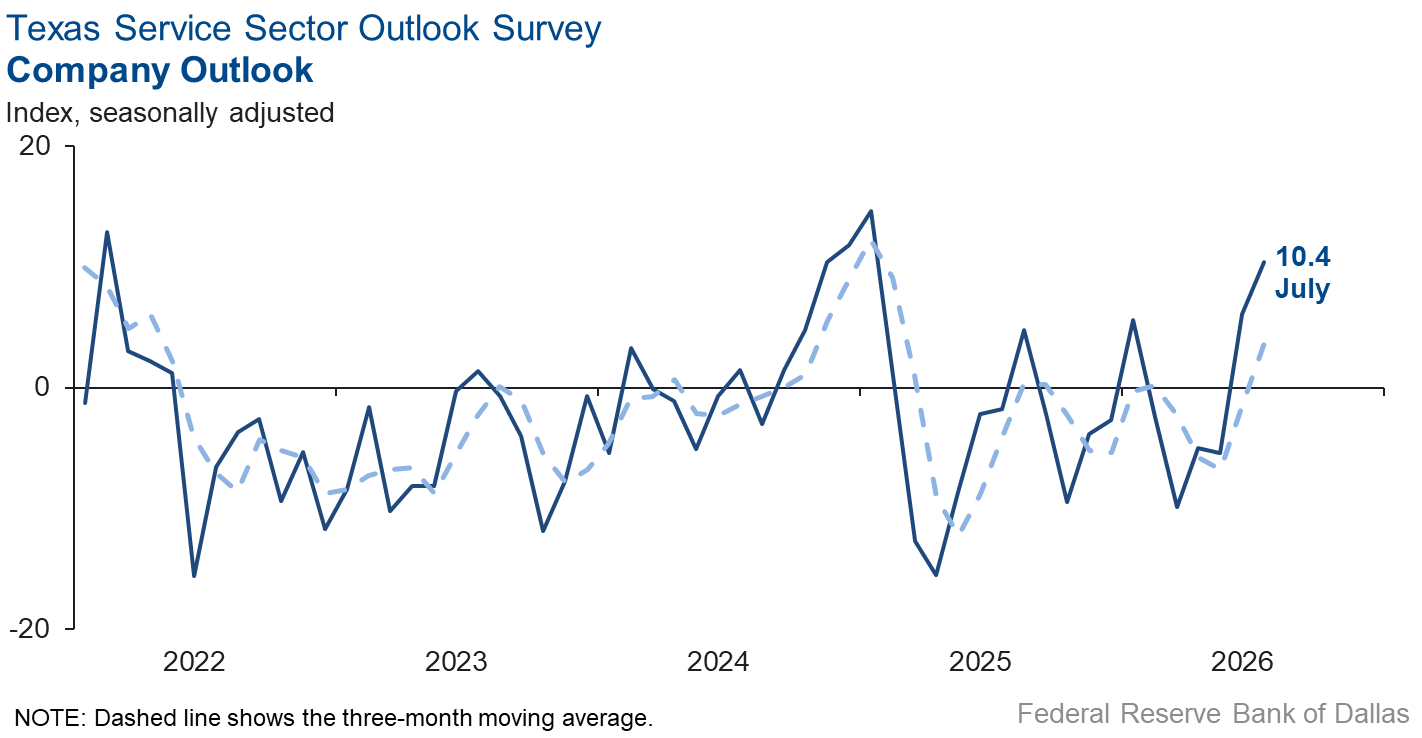
Perceptions of broader business conditions continued to improve. The general business activity index rose four points to 6.6. The company outlook index increased to 10.4 from 6.1. Meanwhile, the outlook uncertainty index was little changed at 12.7.
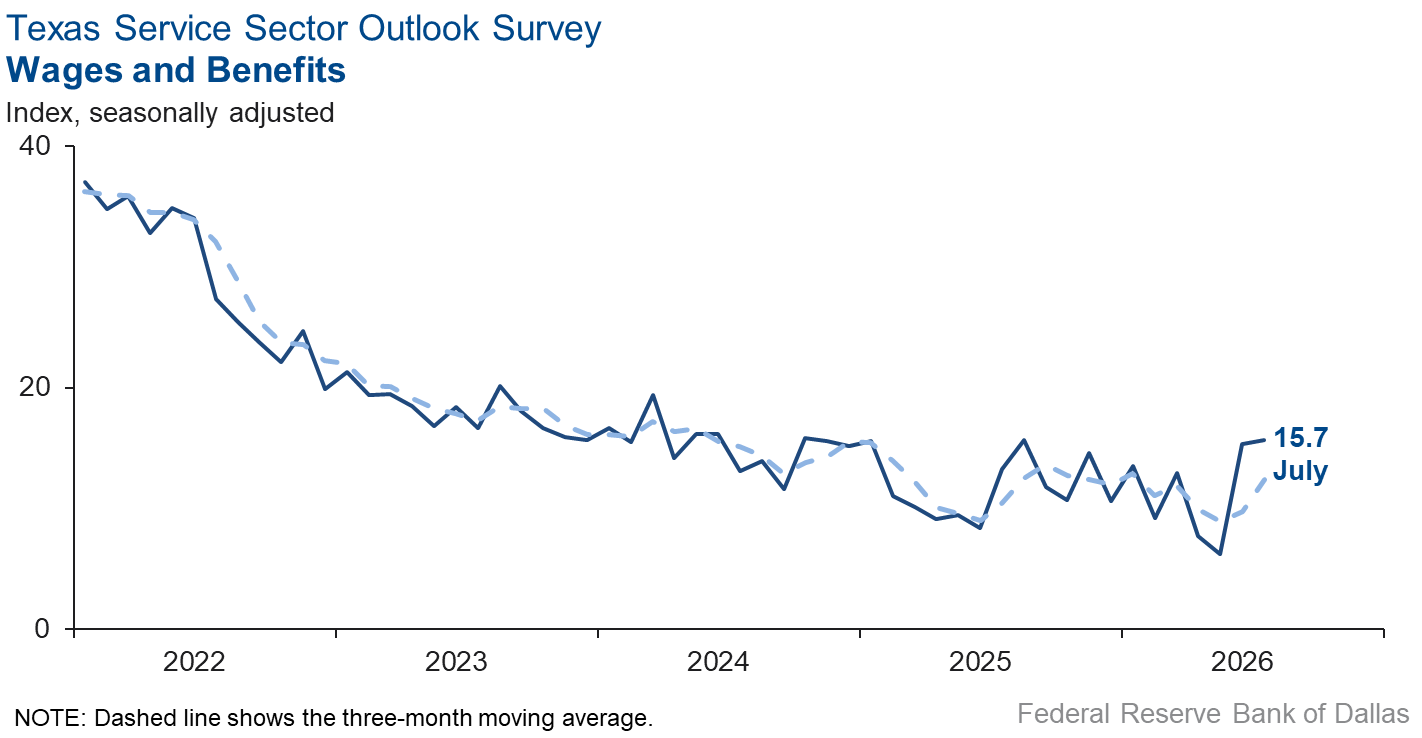
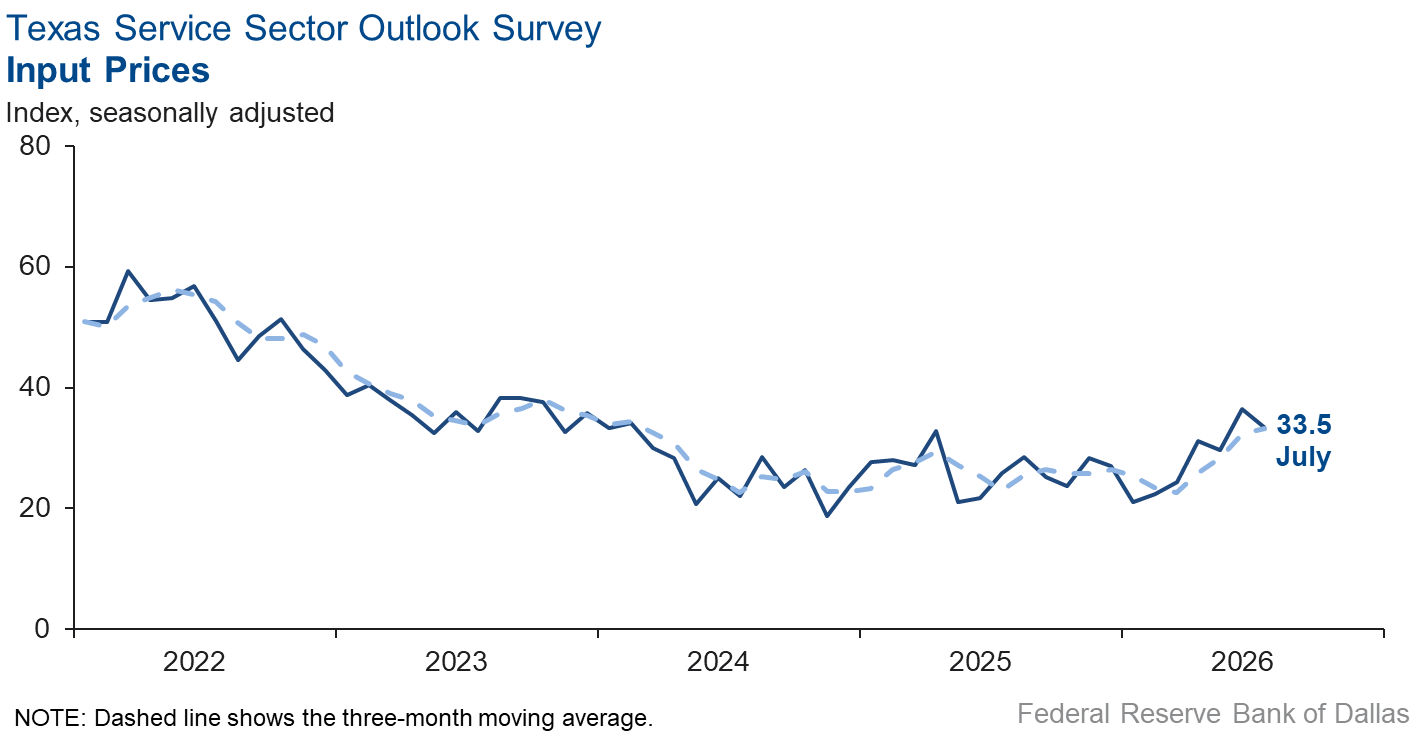
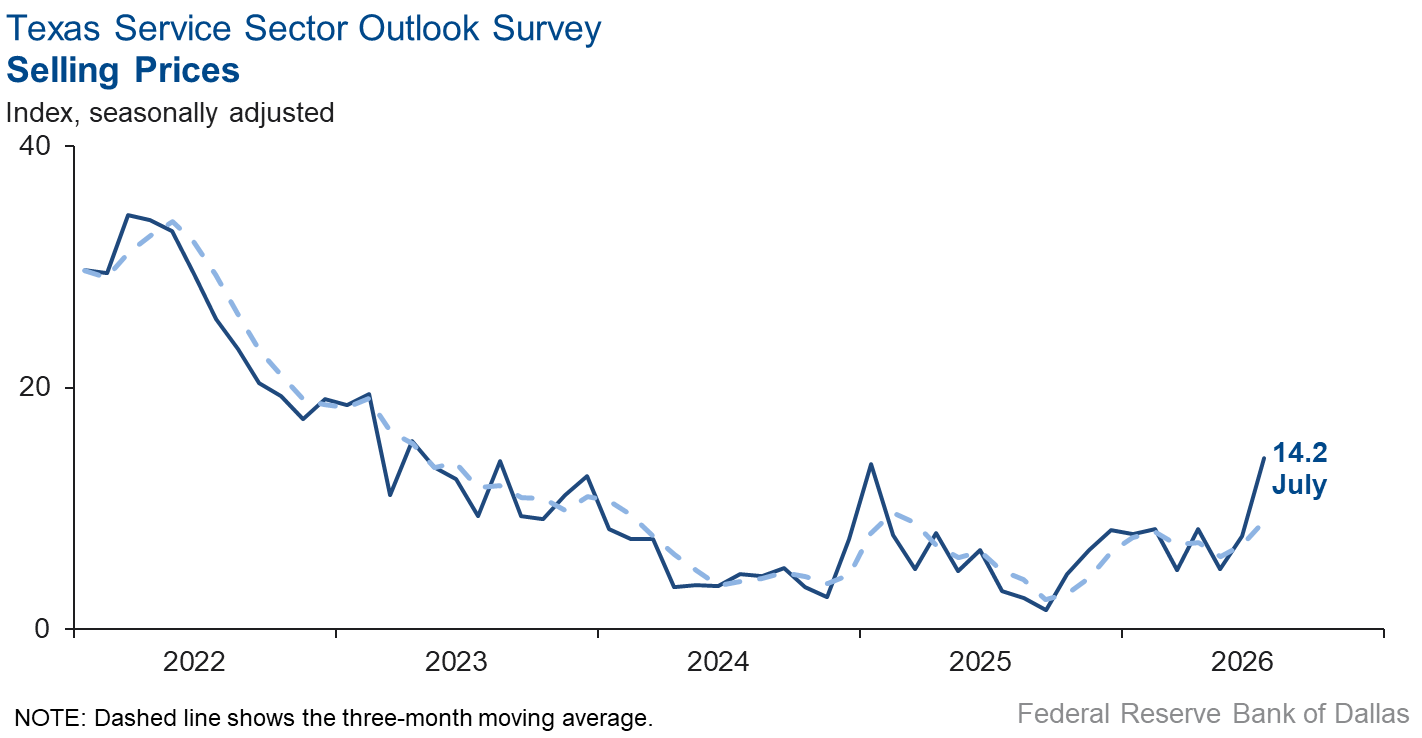
Selling price pressures increased, while input prices rose at a slightly slower pace than the previous month. The selling prices index climbed seven points to 14.2, surpassing the series average of 7.5. The input prices index dipped to 33.5 from 36.5 but remained well above the series average of 27.8. The wages and benefits index was little changed at 15.7.
Respondents’ expectations regarding future business activity reflected continued optimism in July. The future revenue and future general business activity indexes held steady, registering 32.6 and 16.8, respectively. Other future service sector activity indexes, such as employment and capital expenditures, remained in solidly positive territory.
Next release: Sept. 1, 2026
Data were collected July 14–22, and 241 of the 341 Texas service sector business executives surveyed submitted responses. The Dallas Fed conducts the Texas Service Sector Outlook Survey monthly to obtain a timely assessment of the state’s service sector activity. Firms are asked whether revenue, employment, prices, general business activity and other indicators increased, decreased or remained unchanged over the previous month.
Survey responses are used to calculate an index for each indicator. Each index is calculated by subtracting the percentage of respondents reporting a decrease from the percentage reporting an increase. When the share of firms reporting an increase exceeds the share reporting a decrease, the index will be greater than zero, suggesting the indicator has increased over the prior month. If the share of firms reporting a decrease exceeds the share reporting an increase, the index will be below zero, suggesting the indicator has decreased over the prior month. An index will be zero when the number of firms reporting an increase is equal to the number of firms reporting a decrease.
Data have been seasonally adjusted as necessary.
Historical data are available from January 2007 to the most current release month.
| Business Indicators Relating to Facilities and Products in Texas Current (versus previous month) | ||||||||
| Indicator | Jul Index | Jun Index | Change | Series Average | Trend* | % Reporting Increase | % Reporting No Change | % Reporting Decrease |
Revenue | 9.5 | 9.8 | –0.3 | 9.9 | 7(+) | 27.9 | 53.7 | 18.4 |
Employment | 2.6 | 8.1 | –5.5 | 5.7 | 2(+) | 13.7 | 75.2 | 11.1 |
Part–Time Employment | –0.1 | 2.4 | –2.5 | 1.2 | 1(–) | 5.0 | 89.9 | 5.1 |
Hours Worked | 4.9 | 3.6 | +1.3 | 2.4 | 2(+) | 9.0 | 86.9 | 4.1 |
Wages and Benefits | 15.7 | 15.3 | +0.4 | 15.4 | 74(+) | 20.6 | 74.4 | 4.9 |
Input Prices | 33.5 | 36.5 | –3.0 | 27.8 | 75(+) | 36.2 | 61.1 | 2.7 |
Selling Prices | 14.2 | 7.7 | +6.5 | 7.5 | 72(+) | 18.8 | 76.6 | 4.6 |
Capital Expenditures | 11.5 | 10.2 | +1.3 | 9.7 | 72(+) | 16.3 | 78.9 | 4.8 |
| General Business Conditions Current (versus previous month) | ||||||||
| Indicator | Jul Index | Jun Index | Change | Series Average | Trend** | % Reporting Improved | % Reporting No Change | % Reporting Worsened |
Company Outlook | 10.4 | 6.1 | +4.3 | 3.8 | 2(+) | 22.2 | 66.0 | 11.8 |
General Business Activity | 6.6 | 2.9 | +3.7 | 1.8 | 2(+) | 23.7 | 59.3 | 17.1 |
| Indicator | Jul Index | Jun Index | Change | Series Average | Trend* | % Reporting Increase | % Reporting No Change | % Reporting Decrease |
Outlook Uncertainty | 12.7 | 12.6 | +0.1 | 14.0 | 62(+) | 22.5 | 67.5 | 9.8 |
| Business Indicators Relating to Facilities and Products in Texas Future (six months ahead) | ||||||||
| Indicator | Jul Index | Jun Index | Change | Series Average | Trend* | % Reporting Increase | % Reporting No Change | % Reporting Decrease |
Revenue | 32.6 | 33.3 | –0.7 | 37.1 | 75(+) | 46.8 | 39.0 | 14.2 |
Employment | 22.4 | 14.6 | +7.8 | 22.8 | 75(+) | 30.5 | 61.4 | 8.1 |
Part–Time Employment | 4.0 | 0.0 | +4.0 | 6.4 | 1(+) | 8.8 | 86.4 | 4.8 |
Hours Worked | 4.2 | 5.9 | –1.7 | 5.8 | 13(+) | 10.7 | 82.8 | 6.5 |
Wages and Benefits | 42.7 | 41.6 | +1.1 | 37.5 | 75(+) | 46.4 | 49.9 | 3.7 |
Input Prices | 47.3 | 48.2 | –0.9 | 44.2 | 235(+) | 50.6 | 46.1 | 3.3 |
Selling Prices | 25.2 | 24.2 | +1.0 | 24.4 | 75(+) | 30.8 | 63.6 | 5.6 |
Capital Expenditures | 23.9 | 21.2 | +2.7 | 22.4 | 74(+) | 28.7 | 66.6 | 4.8 |
| General Business Conditions Future (six months ahead) | ||||||||
| Indicator | Jul Index | Jun Index | Change | Series Average | Trend** | % Reporting Improved | % Reporting No Change | % Reporting Worsened |
Company Outlook | 21.0 | 17.1 | +3.9 | 15.3 | 15(+) | 35.4 | 50.2 | 14.4 |
General Business Activity | 16.8 | 17.2 | –0.4 | 11.8 | 2(+) | 32.6 | 51.6 | 15.8 |
*Shown is the number of consecutive months of expansion or contraction in the underlying indicator. Expansion is indicated by a positive index reading and denoted by a (+) in the table. Contraction is indicated by a negative index reading and denoted by a (–) in the table.
**Shown is the number of consecutive months of improvement or worsening in the underlying indicator. Improvement is indicated by a positive index reading and denoted by a (+) in the table. Worsening is indicated by a negative index reading and denoted by a (–) in the table.
Data have been seasonally adjusted as necessary.
Comments from survey respondents
Survey participants are given the opportunity to submit comments on current issues that may be affecting their businesses. Some comments have been edited for grammar and clarity.
- The uncertainty of what our goals and actions are in Iran is driving folks nuts.
- The instability created by the conflict with Iran continues to be unsettling. The primary impact has been the fluctuations in the price for fuel. The economy in general is fairly steady. The drama of the AI development and the expansion in data centers have resulted in regional market influences.
- I wish we could afford capital expenditures.
- The market has shifted. We are waiting to see if it is a temporary shift or the beginning of a more permanent downturn.
- The continuing changes in federal and state regulations are impacting our outlook. Specifically, this month student visa rules became more restrictive, student loan limits decreased and the state asked us to submit a proposed 3 percent budget cut. None of this helps our revenue.
- Gas prices remain elevated, and that increase is filtering into the cost of goods and services. A clear path toward resolving the conflict would be very welcome.
- It is very difficult to understand the actions of the current administration. The on-and-off war and the increases at the grocery stores and at restaurants are creating much mental anguish among my customers. When Permian Basin oil and gas operators start pulling back production and articles are stating concerns among major oil and gas companies, it spooks West Texans who depend on the oil field jobs to support their families. This administration's economic problems appear to be over its head, or they are out of touch with the pain that uncertainty causes. I wish they would communicate what policies they are working on to stabilize the economy.
- Back-to-office and business travel remain depressed [relative] to 2019. GLP-1 drugs and reduced alcohol consumption are also depressing sales [resulting in] a tough top-line formula for restaurants. Increasing cost of goods sold, labor and almost every expense adds to the difficult operating environment. Inflation continues, albeit at lower levels than earlier in the decade. But it is painful, nonetheless.
- I feel our revenues dropped due to the FIFA World Cup. We lost business to sports bars and town centers, which had FIFA watch parties.
- The Iran issue seems to be calming down.
- Part-time employees will start college in the next two weeks; I will lose two employees going full time and keep one.
- If interest rates, fuel and the overall cost of living don’t start to improve, we will have to do layoffs to adjust for the decrease in business while having to pay more to the employees we keep.
- We are increasing spending on AI but have not seen the corresponding increase in revenue or decrease in overhead.
- Increased loan demand in commercial—industrial and agricultural—real estate is reflecting an improving economy and reduction in uncertainty. Consumer loans—especially 1 to 4 family residential—remain slow, with little or no growth.
- Business has slowed, and we are now noticing an extra one to two weeks between loyal customer visits. Over the past 19 years, we have seen this activity when the economy goes into a recession.
- The Middle East situation continues to support oil prices and is constructive for producers that midstream companies support.
- Overall uncertainty has increased. We see a great deal of turmoil in the federal government agencies trickling down to the private sector. Policy changes and reorganization are all affecting procurement and spending.
- Significant uncertainty is the norm.
- The cost of fuel is affecting our operating cost because we manage a significant vehicle fleet.
- I own a recruiting firm. We work on the following positions: accounting and finance, sales and other go-to-market (GTM) professionals, operations and human resources. The past two to three months have been very busy. Many companies have been asking for help because they can't find the right talent on their own.
- The continued uncertainty and soft market conditions are creating hesitation and pulling back our clients for our company, but also our clients’ clients in their businesses. Our legislative body does not seem to understand how interconnected our economy is.
- The war in the Middle East in particular is problematic for the economy. Higher energy costs raise the price of all products and services.
- Until the Iran war really ends, there is no way to predict where this economy is headed. Interest rate fluctuations are killing the resale market for residential properties and causing the commercial market to take a pause.
- While demand for enterprise performance management (EPM) and related consulting services remains healthy, prospective clients are taking longer to make purchasing decisions. We continue to see a solid pipeline of opportunities, but extended approval cycles and increased budget scrutiny have lengthened the time required to convert prospects into active projects, making short-term revenue timing less predictable.
- There is a rise in uncertainty due to higher oil prices from renewed military action in Iran and restricted shipping in the Strait of Hormuz.
- We have written a lot of proposals the last three months. But in the last 30 days, we have seen fewer new projects start.
- The summer season has been particularly slow for our clients and economic outlook. There is a fear as the economy feels unstable to most (grants being cancelled, funding changing, expenses high, so spending and projects are fragile or slow) the industry (small business and nonprofit organizations) seems to be trying to be sure of footing. Its effects on our client load, projects and partnerships are a direct response.
- Our company’s success depends directly on the success of our clients. In June and July, our clients in the retail sector experienced their third-worst revenue performance in years of operation. Their results were affected by rising raw material costs and declining consumer demand. Our clients in the IT services sector reported an average revenue decline of 2 percent compared with the same period last year. In addition, the U.S. dollar has declined against other currencies over the past year. As a result of these economic conditions and ongoing uncertainty, several expansion projects planned by our clients in Texas have been placed on hold or canceled.
- Prices for memory-related components continue to escalate, so our resale prices keep escalating. We are holding our margins at this point. Lead times are starting to increase, but it is very sporadic and hard to forecast. The cost referenced above indicates cost for our services, which is not increasing. But hardware cost of goods sold as input cost definitely is. There seems to be no end in sight, either.
- An increasing number of lenders, clients and investors are accepting that the values of multifamily investment assets purchased between 2021 and 2024 are unlikely to recover for years to come, and that there will be no interest rate bailout.
- Politics and possible war are a problem for the economy [with regard to people] purchasing homes or real estate.
- June was an excellent month. People buying whole goods (construction machinery and material-handling equipment) dramatically increased. We have been down all year. We were down 10 percent in February, and we are now ahead of 2025 through six months by 5.6 percent. That is still far behind where we were in 2023. I think people still fear taking on new debt, even if our programs include 0 percent [interest] for 4, 5 or 6 years. They fear higher prices. They fear construction projects will be gone post-AI construction. And no one doesn't fear the war with Iran.
- Oil price and interest rate volatility continue to bring uncertainty to the costs of new developments and increased investment.
- Activity and spending have increased somewhat while uncertainty has abated.
- Rain has helped farming and ranching. Data center construction juices retail and hospitality activity.
- The continued war in Iran, escalating tensions and exorbitant cost are increasing inflation expectations, putting upward pressure on interest rates and contributing to business uncertainty and delaying major business decisions.
- The weather is impacting our business, and people are not spending money.
- We just landed a contract with a major company, and we are adjusting accordingly.
- The cost of fuel and diesel is hurting our business.
- We are watching and waiting to see how things play out in the Middle East. We're prepared to adapt either way.
Special questions
For this month’s survey, Texas business executives were asked supplemental questions on labor market conditions. Results below include responses from participants from both the Texas Manufacturing Outlook Survey and Texas Service Sector Outlook Survey. View individual survey results.
Historical Data
Historical data can be downloaded dating back to January 2007.
Indexes
Download indexes for all indicators. For the definitions of all variables, see data definitions.
| Unadjusted |
| Seasonally adjusted |
All Data
Download indexes and components of the indexes (percentage of respondents reporting increase, decrease, or no change). For the definitions of all variables, see data definitions.
| Unadjusted |
| Seasonally adjusted |
Questions regarding the Texas Service Sector Outlook Survey can be addressed to Isabel Brizuela.
Sign up for our email alert to be automatically notified as soon as the latest Texas Service Sector Outlook Survey is released on the web.